Exceptional outburst of the blazar CTA 102 in 2012: The GASP-WEBT campaign and its extension. ††thanks: The radio-to-optical data collected by the GASP-WEBT collaboration are stored in the GASP-WEBT archive; for questions regarding their availability, please contact the WEBT president, Massimo Villata (villata@oato.inaf.it).
Abstract
After several years of quiescence, the blazar CTA 102 underwent an exceptional outburst in 2012 September–October. The flare was tracked from -ray to near-infrared frequencies, including Fermi and Swift data as well as photometric and polarimetric data from several observatories. An intensive GASP-WEBT collaboration campaign in optical and NIR bands, with an addition of previously unpublished archival data and extension through fall 2015, allows comparison of this outburst with the previous activity period of this blazar in 2004–2005. We find remarkable similarity between the optical and -ray behaviour of CTA 102 during the outburst, with a time lag between the two light curves of hour, indicative of co-spatiality of the optical and -ray emission regions. The relation between the -ray and optical fluxes is consistent with the SSC mechanism, with a quadratic dependence of the SSC -ray flux on the synchrotron optical flux evident in the post-outburst stage. However, the -ray/optical relationship is linear during the outburst; we attribute this to changes in the Doppler factor. A strong harder-when-brighter spectral dependence is seen both the in -ray and optical non-thermal emission. This hardening can be explained by convexity of the UV–NIR spectrum that moves to higher frequencies owing to an increased Doppler shift as the viewing angle decreases during the outburst stage. The overall pattern of Stokes parameter variations agrees with a model of a radiating blob or shock wave that moves along a helical path down the jet.
keywords:
galaxies: active – quasars: individual: CTA 102 – methods: observational – techniques: photometric – techniques: polarimetric1 Introduction
The blazar CTA 102 (4C +11.69, 2FGL J2232.4+1143, ) is a luminous, well-studied quasar. Like other blazars, it is believed that its jet is oriented close to our line of sight, which causes strong relativistic beaming of the jet’s emission and violent variability at all wavelengths. CTA 102 was first identified as a quasar by Sandage & Wyndham (1965) and belongs to the optically violently variable (OVV) (Angel & Stockman, 1980), as well as the high polarized quasar (HPQ), subclasses (Moore & Stockman, 1981).
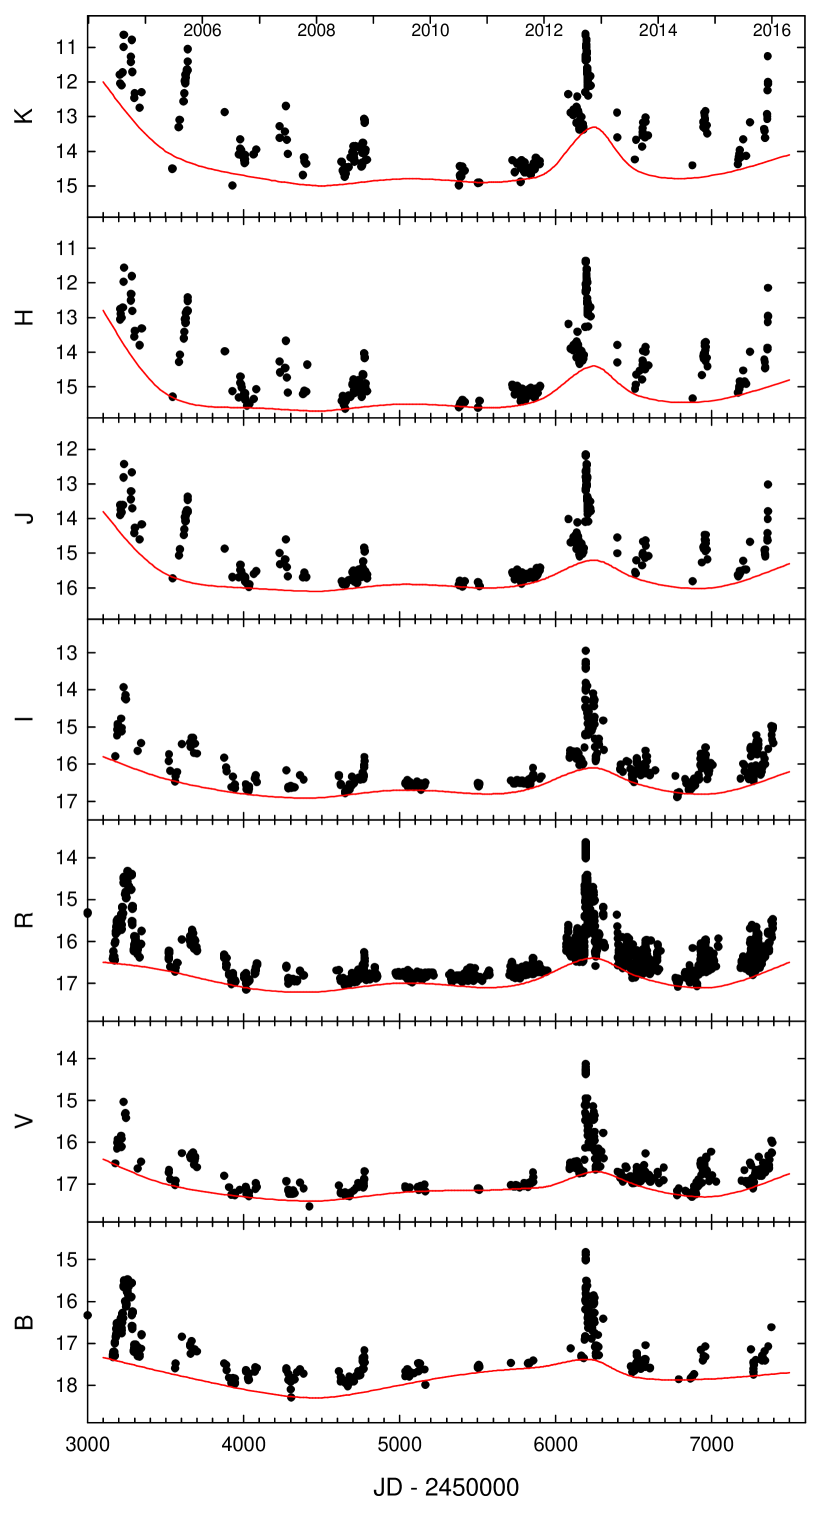
On long time-scales the blazar exhibits rather modest variability at optical bands. Moderate-amplitude fluctuations around the average magnitude of over a 14 yr range (about 65 observations between 1973 and 1987) were reported by Pica et al. (1988). An overall amplitude was observed by Villata et al. (2001) in 1994-1997. However, occasional sharp flares have also been observed in CTA 102. Variations as high as in 2 days (Pica et al., 1988) and in 3 days (Katajainen et al., 2000) were observed in 1978 and 1996, respectively. The previously reported historical maximum for the object, , was reached on Oct. 4, 2004 during a short-term event accompanied by prominent intra-night variability (Osterman Meyer et al., 2009). Between that episode and 2012, only moderate variability has been seen in the light curve of this blazar (see Fig. 1).
CTA 102 was discovered to be a -ray emitter early in the Compton Gamma Ray Observatory (CGRO; EGRET detector) mission at a level of ( MeV) (Nolan et al., 1993). It was also detected in the 10–30 MeV energy range by the COMPTEL instrument of CGRO (Blom et al., 1995). Since the blazar usually exists in a quiescent state, the average -ray flux is rather low, ( GeV) according to the 2FGL catalog based on data from the Large Area Telescope (LAT) of the Fermi Gamma-ray Space Telescope (Nolan et al., 2012). Therefore, accurate relative timing of flux variations in -ray and optical bands is only possible during large outbursts. Similar events may serve as a crucial test for models localizing the -ray emission in blazars (e.g., Marscher & Jorstad, 2010). This type of cross-correlation analysis, performed for several other blazars, has recently shown that -ray and optical flares are usually coincident (e.g., Raiteri et al., 2012, 2013) and associated with the passage of a new superluminal knot through the 43-GHz radio core (e.g., Marscher et al., 2010; Agudo et al., 2011). Casadio et al. (2015) studied the evolution of the parsec-scale jet in CTA 102 with ultra-high angular resolution through a sequence of 80 total and polarized intensity Very Long Baseline Array (VLBA) images at 43 GHz, covering the time span from June 2007 to June 2014. They have shown that a flare seen both in and optical bands took place 12 pc from the black hole, and suggested the synchrotron self-Compton (SSC) process as the source of the -ray emission.
In this paper we analyse the largest outburst of CTA 102 to date at optical and -ray bands (Larionov et al., 2012). A preliminary analysis of our data collected through fall 2012 is reported in Larionov et al. (2013a); in the present paper we extend the data set up to the end of 2015. In § 2 we describe our observational data and their reduction; in § 3.1 we analyse the colour variability of CTA 102 and evolution of its spectral energy distribution (SED); § 3.2 deals with – optical correlations. Optical spectra are discussed in § 3.3. The polarimetric behaviour of this blazar and a model describing its temporal evolution are presented in § 4. The final conclusions are summarised in § 5.
2 Observations and data reduction
2.1 Optical and Near-infrared Photometry
The GASP-WEBT (see e.g., Villata et al., 2008, 2009) observations in 2008–2013 were performed in band at the following observatories: Belogradchik, Calar Alto, Crimean Astrophysical, Lowell (Perkins telescope), Lulin, Mount Maidanak, New Mexico Skies (iTelescopes), Roque de los Muchachos (Liverpool Telescope), Rozhen, Sabadell, Skinakas, St. Petersburg, Teide (IAC80), and Tijarafe. photometric data are from St. Petersburg and Lowell observatories. The and -band light curves are complemented by data taken at Steward Observatory under a monitoring program in support of the Fermi mission. Near-infrared (NIR, ) data are from the Perkins Telescope, AZT-24 (Campo Imperatore), and Teide (TCS). We also use and Mt. Maidanak data during the 2004 outburst. After the nominal end of the GASP campaign, we continued monitoring CTA 102 in optical–NIR bands (Crimean Astrophysical Observatory, Lowell Observatory, St. Petersburg University, Steward Observatory, Campo Imperatore observing station of Rome Observatory) in order to track the post-outburst behaviour. We used photometric sequences in optical bands reported in Raiteri et al. (1998) and, in NIR bands, those given on the AZT-24 web-page 111http://www.astro.spbu.ru/staff/vlar/NIRthumbs/cta102.html.
We corrected the optical and NIR data for Galactic extinction using values reported in the NASA Extragalactic Database (NED)222http://ned.ipac.caltech.edu/ for each filter (Schlafly & Finkbeiner, 2011). The magnitude to flux transformations were calculated with coefficients determined by Mead et al. (1990).
The optical and near-IR light curves of CTA 102 during the 2004–2015 time interval are shown in Fig. 1; spline curves correspond to lower envelopes of variations in each colour band. We note that during both the 2004 and 2012 outbursts the amplitudes of long-term (marked with splines) and short-term (individual data points) variations increase with wavelength, as is common in flat-spectrum radio quasars (FSRQs).
2.2 Optical Polarimetry
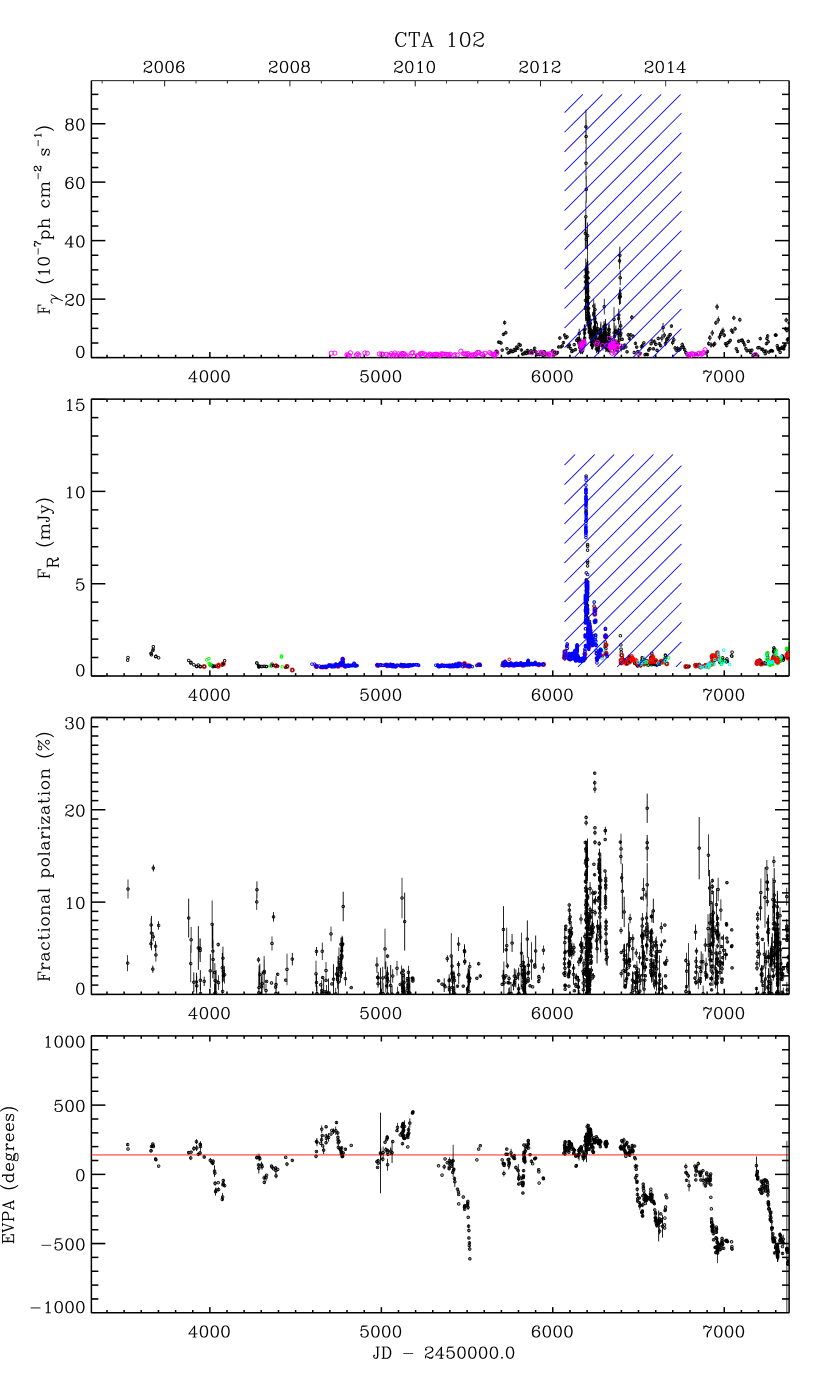
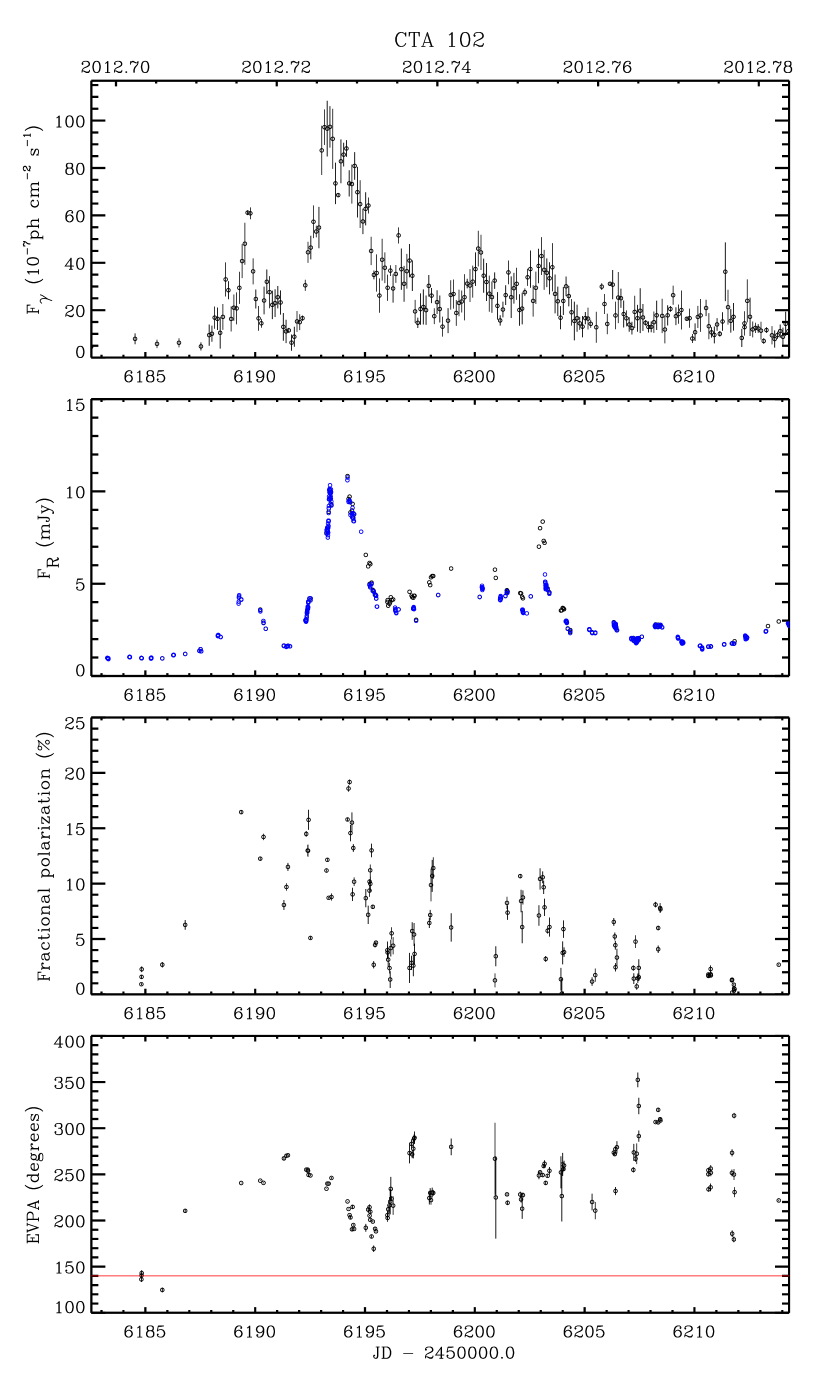
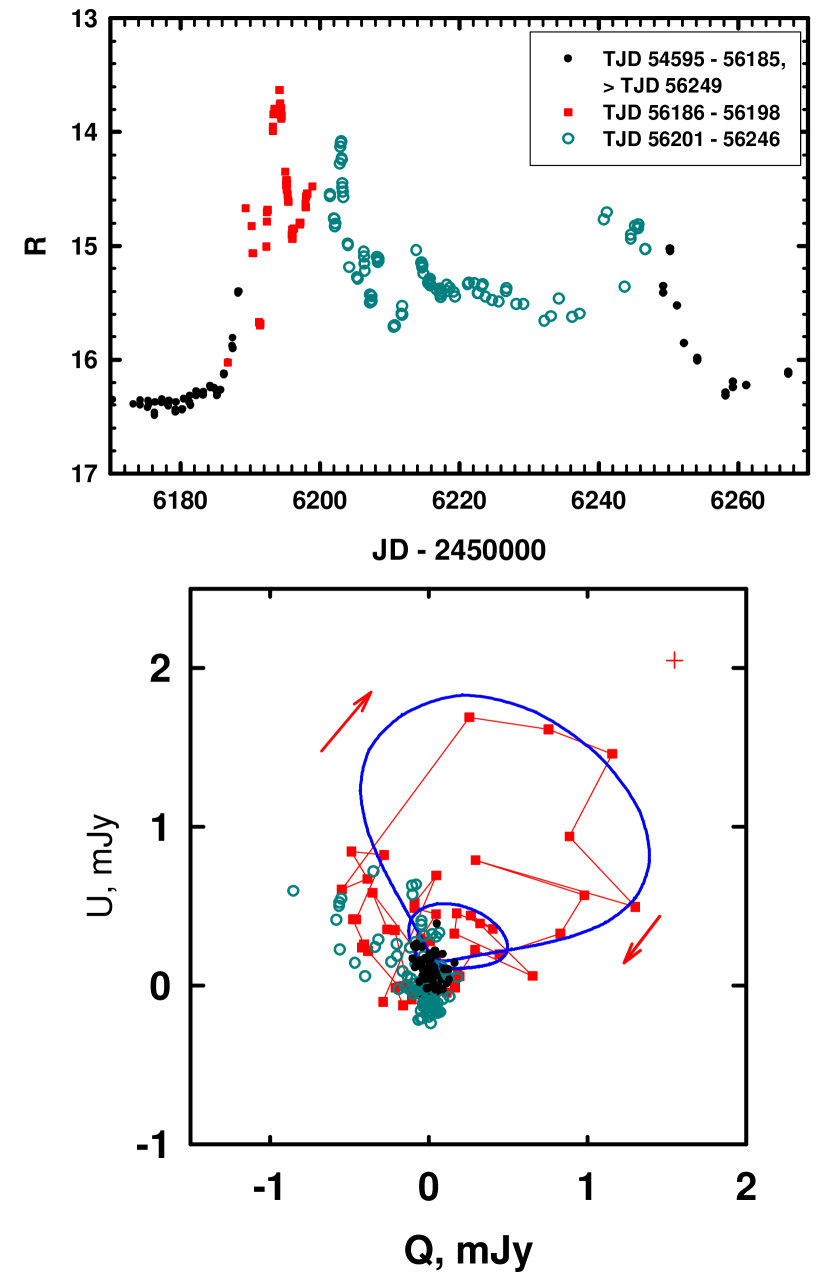
We use polarimetric data collected at St. Petersburg University (Crimea and St. Petersburg), Lowell (Perkins), Steward, and Calar Alto observatories, supplementing these with data from the Kanata telescope (Itoh et al., 2013). Instrumental polarization was derived from measurements of stars located near the object under the assumption that their radiation is intrinsically unpolarized. The Galactic latitude of CTA102 is -38°and = 0.16 mag, so that interstellar polarization (ISP) in its direction is less than 0.6 per cent. To correct for ISP, the mean relative Stokes parameters of nearby stars were subtracted from the relative Stokes parameters of the object. This removes the instrumental polarization as well. The fractional polarization has been corrected for statistical bias, according to Wardle & Kronberg (1974). Figure 2 presents the flux and polarization behaviour of CTA 102 for 2005–2015. We supplement this plot with a panel showing the -ray light curve from the Fermi LAT in order to demonstrate that the most prominent -ray activity ever recorded for this source was observed during the September–October 2012 optical outburst. In Fig. 3 we present a blowup of the most active interval of the 2012 outburst. From visual inspection of these figures, it is apparent that during the entire time range covered by Fermi observations up to the 2012 season, CTA 102 remained inactive at both -ray and optical bands; the degree of polarization was mostly per cent, while the electric-vector position angle (EVPA) showed marked variations over the range [-200°, 400°]. We resolve the ambiguity by adding/subtracting each time that the subsequent value of the EVPA is less/more than the preceding one. Occasional clockwise rotations of the polarization vector by up to are apparent. The onset of the activity in the 2012 season was accompanied by a violent increase of optical polarisation activity. The degree of polarisation exceeded 20 per cent at some epochs, during which the position angle varied over the range 150–.
2.3 -ray Observations
The -ray data were obtained with the Fermi (LAT), which observes the entire sky every 3 hours at energies of 20 MeV–300 GeV (Atwood et al., 2009). We analysed the LAT data in the energy range 0.1–200 GeV using the unbinned likelihood analysis of the standard Fermi analysis software package Science Tools v9r33p0 and instrument response function P8R2_SOURCE_V6. Source class photons (evclass=128 and evtype=3) were selected within a region of interest centred on the blazar. Cuts in the satellite zenith angle () and rocking angle () were used to exclude the Earth limb background. The diffuse emission from the Galaxy was modelled using spatial model gll_iem_v06. The extragalactic diffuse and residual instrumental backgrounds were included in the fit as an isotropic spectral template iso_source_v05. The background model333http://fermi.gsfc.nasa.gov/ssc/data/access/lat/4yr_catalog/gll_psc_v16.xml includes all sources from the 3FGL catalog within of the blazar. Photon fluxes of sources beyond from the blazar and spectral shapes of all targets were fixed to their values reported in the 3FGL catalogue. The source is considered to be detected if the test statistic TS provided by the analysis exceeds 10, which corresponds to approximately a detection level (Nolan et al., 2012). The systematic uncertainties in the effective LAT area do not exceed 10 per cent in the energy range we use (Ackermann et al., 2012). This makes them insignificant with respect to the statistical errors, which dominate over the short time scales analysed in this paper. Moreover, our analysis is based on the relative flux variations. Because of this, the systematic uncertainties are not taken into account.
Different time bins , from 12 hours to 7 days, were used, depending on the flux density of the object. This maximizes the availability of detections at temporal resolutions that are as short as possible.
2.4 Swift Observations
2.4.1 Optical and Ultraviolet data
Swift UVOT observations were performed in the optical , , and bands, as well as in the UV filters , , and . We reduced the data with HEAsoft package version 6.10, with the 20101130 release of the Swift/UVOTA CALDB. Multiple exposures in the same filter at the same epoch were summed with uvotimsum, and then aperture photometry was performed with the task uvotsource. We used an aperture radius of 5″centred on the source, and background from an annulus between 25″and 35″radii. To take the spectral shape of CTA 102 into account, we re-calibrated the effective wavelengths and count-to-flux conversion factors as explained in Raiteri et al. (2010), using a power-law fit to the average source spectrum. This also produced a better agreement between the ground-based and space data than when using the Breeveld et al. (2011) calibrations. Galactic extinction was calculated by convolving the Cardelli et al. (1989) mean extinction laws with the filter effective areas and source flux. All of the derived parameters are given in Table 1.
| Bandpass | v | b | u | uw1 | um2 | uw2 |
|---|---|---|---|---|---|---|
| , Å | 5427 | 4353 | 3470 | 2595 | 2250 | 2066 |
| , mag | 0.24 | 0.32 | 0.38 | 0.54 | 0.67 | 0.64 |
| conv. factors | 2.603 | 1.468 | 1.649 | 4.420 | 8.372 | 5.997 |
2.4.2 X-ray Data
The X-ray data were obtained over a photon energy range of 0.310 keV by the Swift XRT. We reduced the data using HEAsoft package version 6.11. The standard xrtpipeline task was used to calibrate and clean the events. We selected events with grades 012 in pc mode and 02 in wt mode. An ancillary response file was created with a PSF correction using the xrtmkarf task, and the data were rebinned with the grppha task to ensure a minimum of 10 photons in every newly defined channel. We fit the spectra with the spectral analysis tool xspec using a power-law model with minimum value and fixing the hydrogen column density () according to the measurements of Dickey & Lockman (1990). We used Cash statistics along with Monte Carlo spectral simulations to estimate the goodness of fit at a confidence level of 90 per cent. If the parameters failed a goodness of fit test, we rebinned the data with a minimum of 20 photons in each spectral channel and repeated the model-fit procedure. If the new model still did not satisfy a goodness of the fit test, we rejected the data; this occurred only in 2 cases.
3 Results
3.1 Colour Evolution
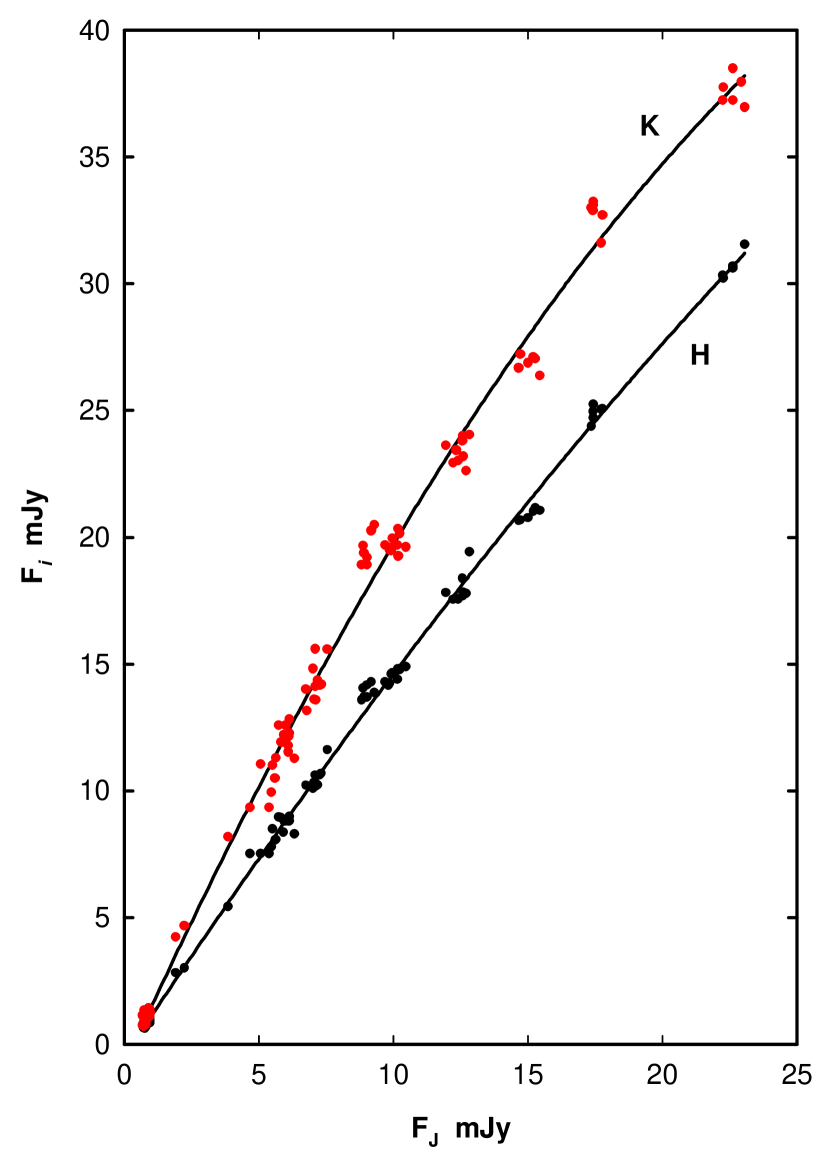
The question of whether a blazar’s radiation becomes redder or bluer when it brightens is a topic of numerous papers. It is commonly agreed that the relative contributions of the big blue bump (BBB) and Doppler-boosted synchrotron radiation from the jet are different between quiescence and outbursts, and that this leads to variability of the spectral energy distribution (SED). The situation is even more complicated in cases like CTA 102, where broad emission lines contaminate the wide photometric bands (e.g., the Mg ii Å line is redshifted to Å). A straightforward way to isolate the contribution of the component of radiation that is variable on the shortest time-scales (presumably, synchrotron radiation) has been suggested by Hagen-Thorn (see, e.g., Hagen-Thorn et al., 2008, and references therein). The method is based on plots of (quasi)simultaneous flux densities in different colour bands and the construction of the relative continuum spectrum based on the slopes of the sets of flux-flux relations thus obtained.
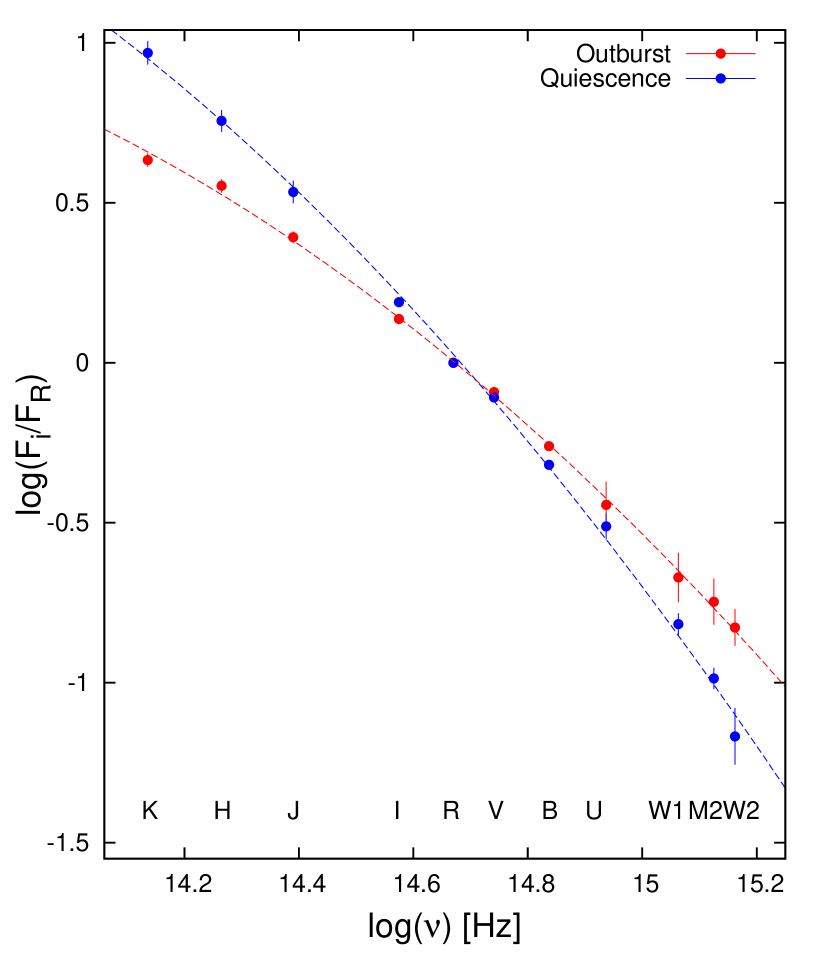
An example of such an approach is given in Fig. 4, where the flux densities in and bands are plotted against the -band flux density. The lack of linearity between variations in corresponding bands means that the low- and high-flux behaviours could reflect variability of different sources of radiation (e.g., the ambient jet in low states and a shock in high states). Alternatively, if the same component is responsible for all of the variability patterns, the parameters of this component change significantly in a manner that depends on the brightness of the source. In Fig. 5 we plot relative SEDs of the variable component in CTA 102 in quiescence and during the 2012 outburst from Swift UV to NIR bands, showing marked hardening of the SED during the high state, together with substantial curvature (convexity) of the spectrum. Since the logarithmic spectral shapes are far from linear, we are not able to determine a single power-law slope (in the sense ) for the entire optical–NIR range. As a value that characterises these slopes, we select the tangent to the spectrum at the central -band frequency. For the quiescent stage, we obtain , and for the outburst . We emphasize that these values refer to the variable component only, not to the entire flux. Meanwhile, if we look at the evolution of the total-flux optical SED, we see the opposite: during quiescence and for the outburst. The closeness of the latter value to that obtained for the variable source is caused by the fact that, during the outburst state, the relative contribution of intrinsically blue underlying components (BBB+ Mg ii line emission) becomes small compared to the synchrotron radiation of the variable source.
Simultaneous spectral hardening in the -ray region during the outburst is also apparent in Fig. 6. Notice that in this figure we plot total flux densities, in contrast to Fig. 5.
We hypothesize, as suggested in Larionov et al. (2010) for the case of BL Lac, that this spectral hardening of the variable optical and -ray components is mostly caused by a change of the viewing angle of the emitting zone, which shifts in frequency the synchrotron spectrum due to increased Doppler boosting. Some (or all) of the hardening could also result from the population of emitting electrons becoming enriched with a high-energy extension during the outburst compared to the quiescent state.
3.2 -ray – Optical Correlations
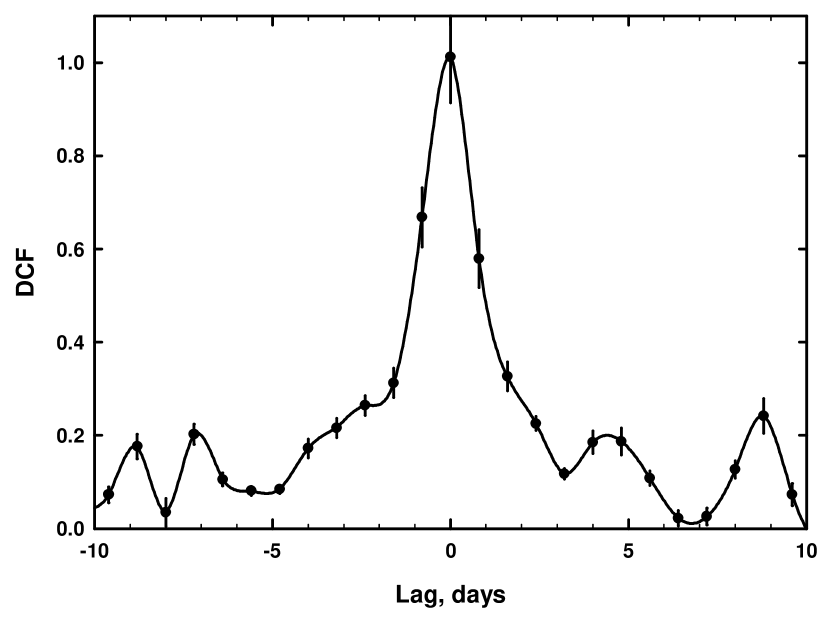
We have calculated the discrete correlation function (DCF) (Edelson & Krolik, 1988; Hufnagel & Bregman, 1992) between the optical and -ray flux variations of CTA 102 during 2012. The results, given in Fig. 7, clearly demonstrate that there is no time delay between the variations in the two energy bands within the accuracy of the DCF method. The value of the lag between optical and -ray variations, based on the DCF centroid position, is . One may note that there are secondary ‘humps’ at days and days. We surmise that these are caused by recurring optical and -ray sub-flares during the 2012 outburst (see § 4.1 and Fig. 14 below).
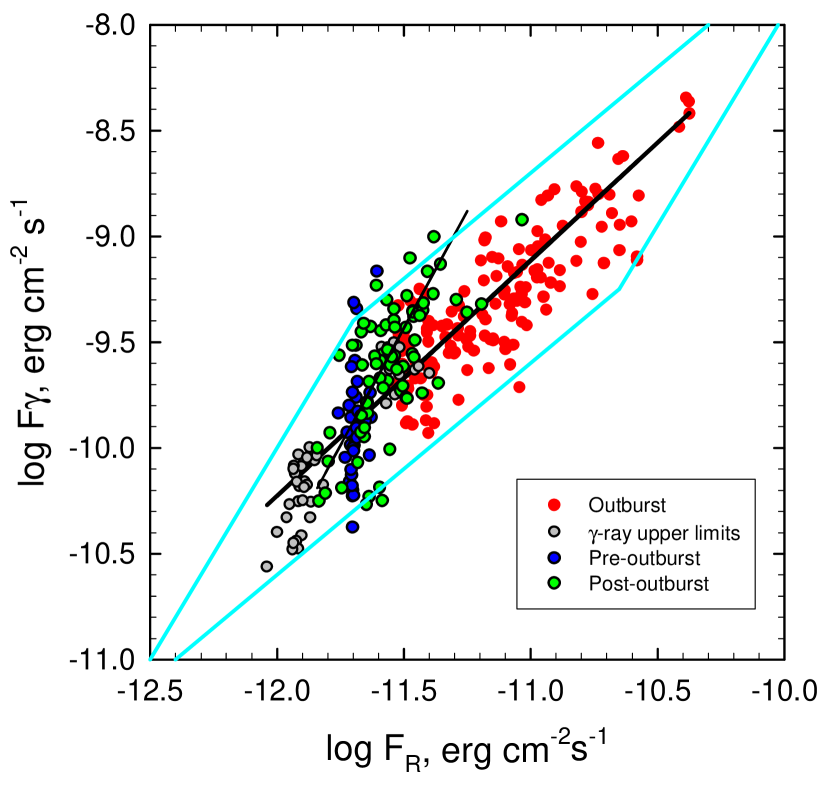
This lack of delay allows us to compare directly the optical and -ray flux densities. To do this, we (1) bin the -band optical data so that the mid-point and size of each optical bin corresponds to the mid-point and size of the respective -ray bin, and (2) subtract from the binned optical data a tentative value of the flux of (quasi-)permanent emission components (BBB + QSO-like emission with a prominent Mg ii line). Combined, this amounts to in band, which is similar to the value obtained for CTA 102 in Raiteri et al. (2014), corresponding to as much as 50 percent of the total quiescent flux. Figure 8 demonstrates clear differences during the various stages of CTA 102 activity. The onset of -ray activity (TJD 5700–5943, blue circles in Fig. 8) corresponds to a rather stable optical level. During the outburst stage (TJD 6069–6678, red circles), we see a relation between -ray and optical fluxes of the form , while in the post-outburst stage, TJD 6776–7231 (green circles), .
We assume that the variable optical emission is mostly synchrotron radiation from the jet, while the -ray emission is from inverse Compton scattering (IC) of optical/IR photons by the jet’s relativistic electrons. The origin of the seed photons may be external to the jet, e.g., hot dust continuum or broad line emission (external Compton, or EC model), or synchrotron photons from the jet (synchrotron self-Compton, or SSC model). In the EC model we expect the respective fluxes to vary as , since only the relativistic electron population is in common, while in the SSC model , since both the relativistic electrons and emission radiated by them are involved in the high-energy photon production. Here, is the flux of the synchrotron radiation and is that of the IC emission. These dependences will be altered slightly by the different optical and -ray K corrections at times when the optical and -ray spectral indices are not the same.
A competing explanation of the near-unity slope between optical and -ray fluxes, besides the EC model, is that their variability is mostly caused by variations of Doppler factor resulting from changes in the viewing angle. This can occur if the entire jet changes its direction (wobbles or precesses), or if different parts of the jet cross-section with various velocity vectors relative to the mean become periodically or sporadically bright as time passes. Under this scenario, the post-outburst stage with presumably small variations in viewing angle produces SSC-like variability that was hidden during the height of the outburst under higher-amplitude Doppler-boosted variations of geometrical origin.
Thus, the data distribution in Fig. 8 can be explained as due to two concurrent effects, with slopes of (Doppler factor variations) and (intrinsic SSC dependence), so that the data mostly lie inside a circumscribed parallelogram with sides having the above slopes. The relative lengths of these sides depend on the relative dominance of the two effects, and the best-fit slope of the entire distribution can vary from to 2. The best fit slope of 1.12 during the outburst would indicate almost complete dominance of the Doppler factor variations, while the best fit found for the post-outburst stage implies an essentially constant, enhanced Doppler factor during that period. Another advantage of this model is that it can explain the polarimetric variability in CTA 102 (see § 4.1).
3.3 Optical Spectra
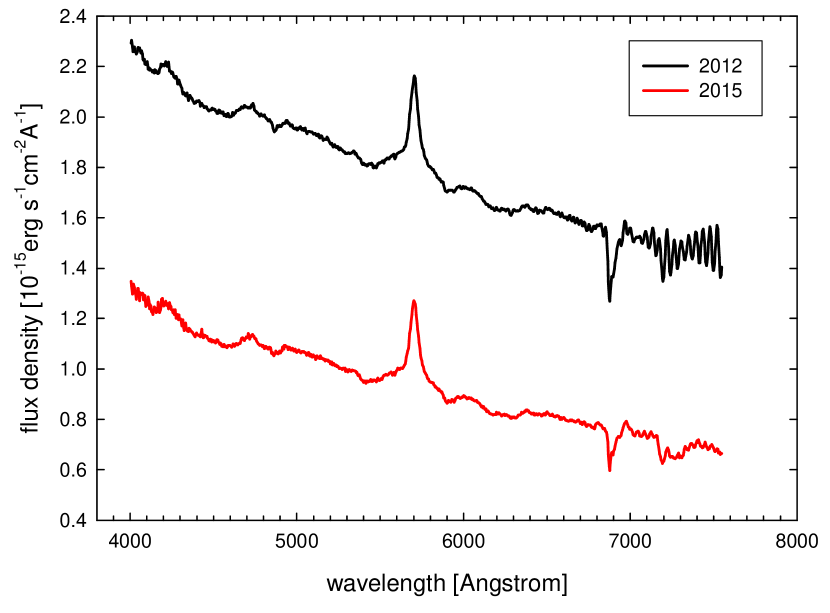
We analyse the optical spectroscopic behaviour of CTA 102 using the data taken at Steward Observatory of the University of Arizona for the ‘Ground-based Observational Support of the Fermi Gamma-ray Space Telescope’ program444http://james.as.arizona.edu/~psmith/Fermi/ at the 2.3 m Bok telescope and 1.54 m Kuiper telescope from 2008 to 2015. All of these spectra contain a prominent Mg ii Å broad emission line redshifted to Å. Figure 9 displays averaged spectra for the 2012 and 2015 observing seasons. We use 133 spectra spread over the time interval 2009–2015 to check whether there is any correlation between continuum (mostly synchrotron) flux density variations and changes in the Mg ii line flux.
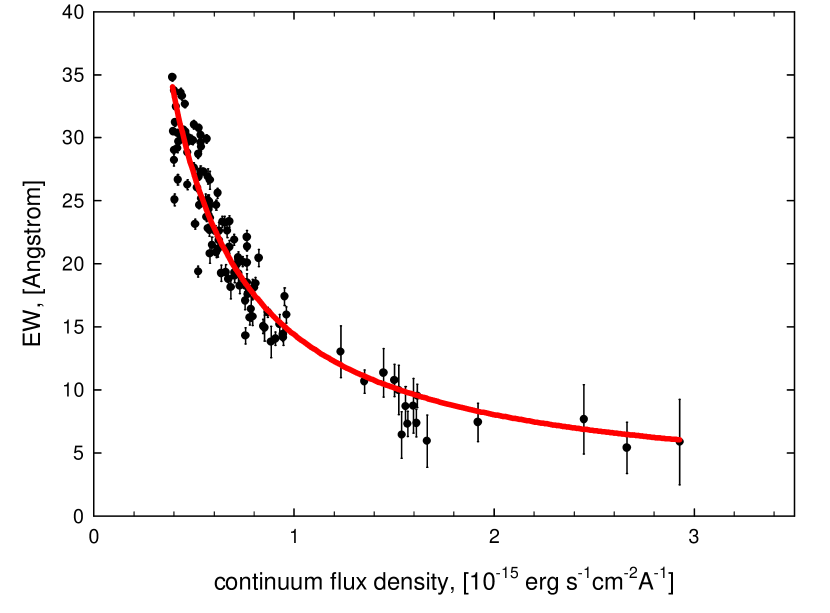
We evaluate the line parameters (the equivalent width, EW, and the line full width at half-maximum, FWHM), fitting the line profile with a single Gaussian function superposed on a featureless continuum. The results are presented in Fig. 10, where EW is plotted against the continuum flux density; the inverse proportionality of these two quantities indicates that the line flux is stable. The red curve corresponds to the expected EW if the line flux remains constant. These results imply that enhanced activity of the jet has little or no effect on the broad-line region (BLR), where one expects most or all of the Mg ii emission to originate.
We note that similar results have been obtained for other blazars, e.g., 3C 454.3 (Raiteri et al., 2008) and OJ 248 (Carnerero et al., 2015). However, some cases of correlated broad-line flux variability connected to -ray variability have indeed been reported by León-Tavares et al. (2013), Isler et al. (2013), and Isler et al. (2015).
We measure the Mg ii line FWHM, from which one can derive the velocity of the gas clouds in the BLR, and obtain . This value is a lower limit to the actual velocity range of the broad-line clouds, since it depends on the geometry and orientation of the BLR (see, e.g., Wills & Brotherton, 1995). In fact, because the line of sight to a blazar is probably nearly perpendicular to the accretion disk, the de-projected velocity range is likely to be a factor higher than the FWHM given above.
4 Discussion
4.1 Polarimetric Behaviour and Helical Jet Model
Our polarimetric data obtained during 2008-2015 allow one to see remarkable changes in the behaviour of CTA 102 that were probably triggered by (or, at least, coincided with) the prominent outburst of 2012. Figure 11 shows histograms of the polarization degree (PD) before, during, and after the flare. This highlights the increased range of PD variations already seen in Fig. 2. A natural reason for this change is a decrease in the viewing angle of the jet, as already suggested by Casadio et al. (2015) based on analysis of the superluminal apparent motion of knots in VLBA images. However, if we consider the range of values of viewing angles found in that paper (from before the 2012 outburst to after it) and compare the values of PD expected within the moving shock model for polarization variations (see, e.g., Fig. 12 and also Larionov et al. (2013b); Raiteri et al. (2013)), we find that we would expect to see the opposite: a decrease in PD during the outburst. A positive correlation between the photometric flux and PD may be obtained if the bulk Lorentz factor of the emitting plasma is much higher, e.g., (dashed line in Fig. 12). In this case, a decrease in viewing angle would increase PD (see also Eq. (1)-(3) in Larionov et al., 2013b). However, such a high value is difficult to reconcile with that found by Casadio et al. (2015), .
Yet another possible reason for this apparent contradiction could be the difference in sizes between the parts of jet responsible for the flaring optical radiation and the centroid of the radio ‘core’. In this case, the source of the polarized optical flux could have a mean velocity vector that is less well aligned with the line of sight than that of the radio emission region. This explanation is supported by very different time scales of variability in optical (few days) and radio (months) wavelengths and, correspondingly, different sizes of the emission regions (see also Casadio et al., 2015).
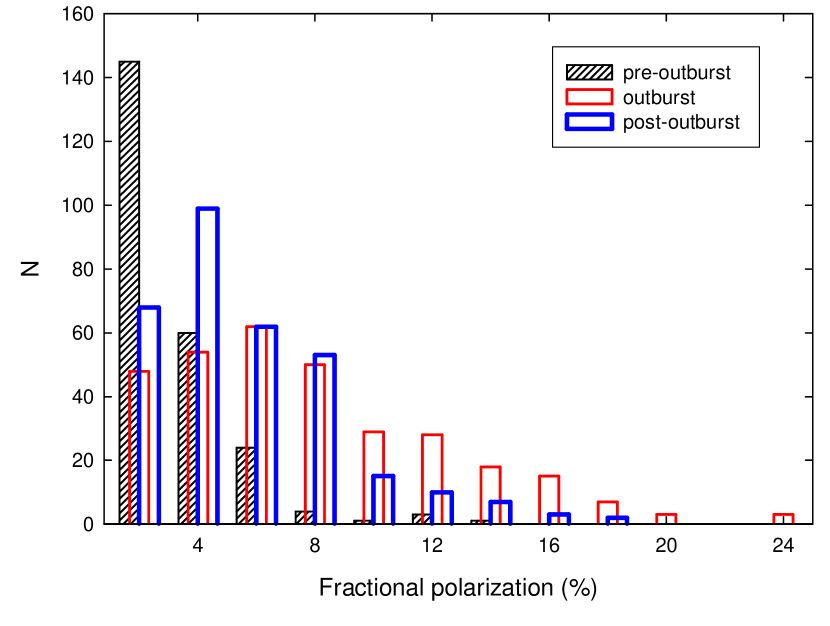
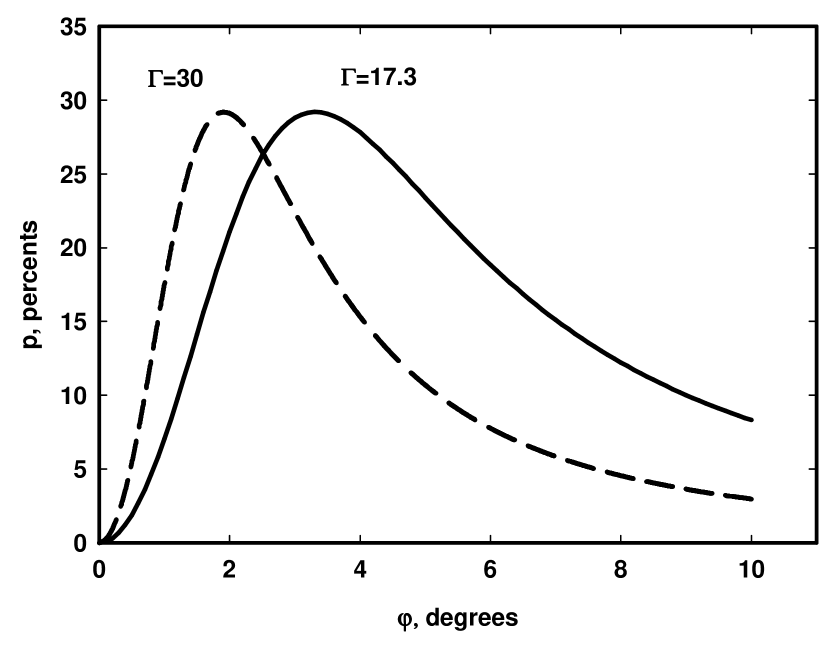
Figure 13 shows the distribution of the absolute Stokes parameters of CTA 102 during both quiescence and different stages of the 2012 activity. We notice that the cluster of points obtained before and after the outburst (more than 300 data points, marked as black circles) is located near the origin of the coordinates. All of the data points are tightly packed around this location, which corresponds to a very low level of polarized flux during quiescence (see also Figs. 2 and 11). The onset of the outburst was accompanied by a definite loop-like rotation in the plane of the Stokes parameters, while the fading stage of the outburst included less ordered drifts, misplaced relative to the pre-outburst position. This latter feature may reflect the change in orientation of the jet itself, while the clockwise rotation could arise from spiral movement of the radiating blob through the jet.
As in the case of S5 0716+71 (Larionov et al., 2013b), we propose a model of a relativistic shock moving down a helical jet, or along helical magnetic field lines, to explain these rotations. The main parameters that determine the visible behaviour of the outburst are: (1) jet viewing angle ; (2) pitch angle of the spiral motion and helical field; (3) parameters of polarization of the undisturbed jet; (4) bulk Lorentz factor of the shocked plasma; (5) scaling factor of the exponential rise of the outburst ; (6) factor , responsible for different time-scales of the rise and decline of the outburst; (7) period of the shock’s spiral revolution in the observer’s frame ; (8) the same period in the source frame; (9) radius of spiral; (10) shocked plasma compression = ratio of post-shock to pre-shock density; and (11) spectral index of the emitting plasma .
Some of these parameters can be obtained, or at least constrained, directly from observations. For example, the Lorentz factor during the 2012 outburst is close to 17, according to Casadio et al. (2015); the average level of polarization during quiescence is of order 1 per cent (see Fig. 11); the value of is obtained from repeating optical (and -ray) sub-flares during the outburst; the mean value of the slope of the synchrotron spectrum , which we obtain from our photometric data (see § 5 and Fig. 5).
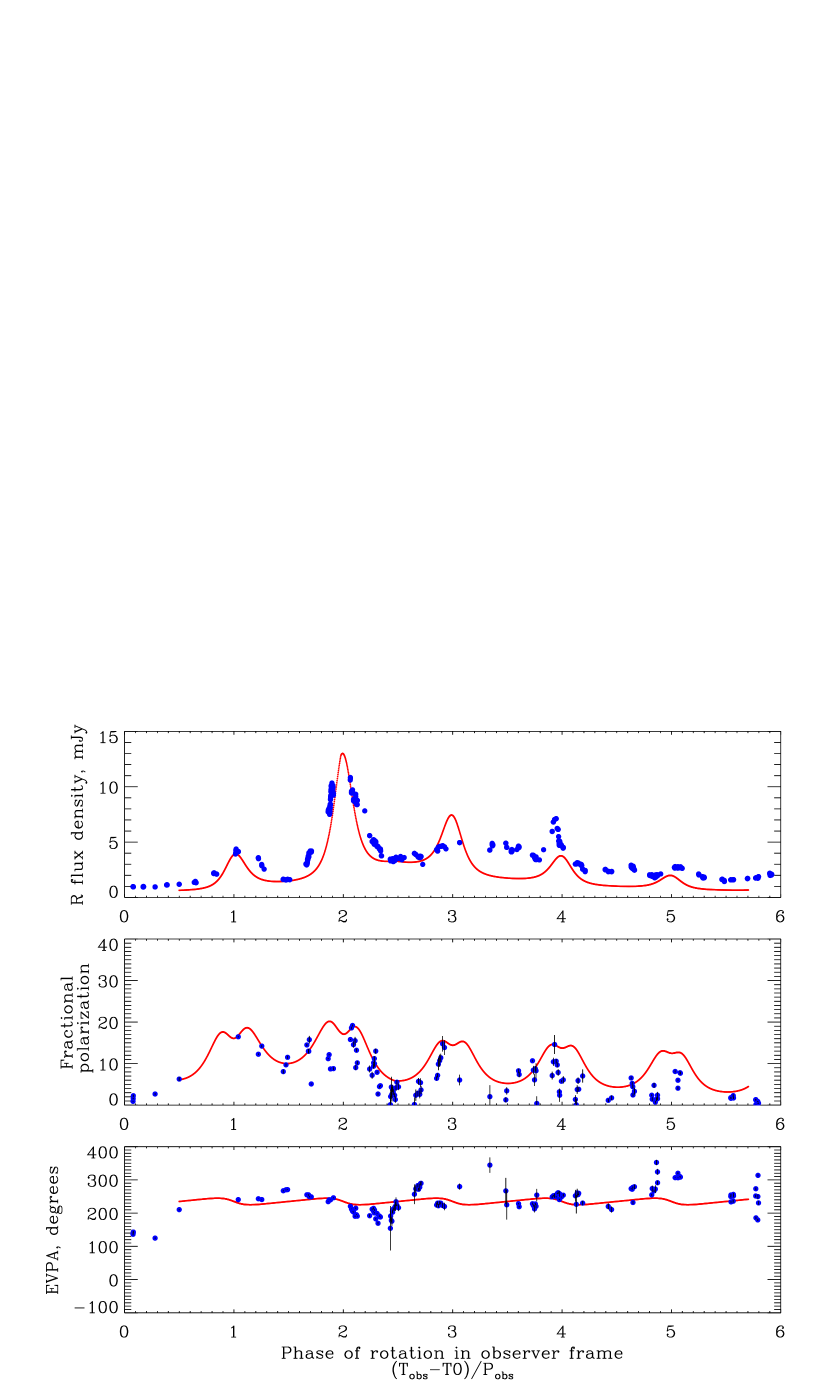
Using relations (1)-(9) from Larionov et al. (2013b), we obtain the values of the model parameters that are given in Table 2. To confront the model with observational results, we plot both together in Figs. 13 and 14. Since our model only takes into account smooth variability caused by a radiating blob moving along a helical path in the jet and neglects the effects caused by turbulence that is probably present, we are able to reproduce only the basic variability pattern. In particular, we see a series of decaying flares after the main outburst (and the precursor preceding it). Nevertheless, the agreement of the model with the vs. evolution in Fig. 13 is quite good. The model evolution of the degree of polarization corresponds to an upper envelope to the observational data. This is as expected, since turbulence adds superposed polarization vectors at random position angles, which often partially cancel the polarization from the ordered component of the magnetic field.
| (1) | (2) | (3) | (4) | (5) | (6) | (7) | (8) | (9) | (10) | (11) |
| 2.65 | 0.9 | 1 | 18.2 | 0.75 | 1.83 | 4.7 | 2.35 | 0.0018 | 1.35 | 1.50 |
We note that our finding of clockwise rotation of the polarization vector is supported by the detection of negative circular polarization in the 15 GHz radio emission of CTA 102 by Gabuzda et al. (2008), who used the observation as evidence for a helical magnetic field. In addition, inspection of the EVPA behaviour in Fig. 2 allows one to see at least 3 episodes of clockwise rotation with amplitude exceeding 700°(TJD 5500, 6500, 7250) and no cases of counter-clockwise rotations of similar length. Thus, this appears to be a persistent feature of the blazar, in agreement with an ordered, helical component of the magnetic field.
4.2 Weakness of Spectral Variations
The Mg ii emission line flux is, at most, weakly variable over the course of our observations despite marked changes in the optical synchrotron flux. We consider this to be a consequence of two factors: (1) the part of jet where the outburst occurred, is located parsecs outside of the BLR (see Casadio et al., 2015), and (2) the ultra-high amplitude of the 2012 outburst might have been determined to major extent by a change in the viewing angle. The number of ionizing photons traversing the BLR would not significantly change during such a re-orientation of the jet.
4.3 Implication of Variable Doppler Factor
We have used our photometric and polarimetric data centred on the 2012 outburst to assess the main geometric parameters that govern the overall pattern of Stokes parameter variations within a model of a radiating blob or shock wave that moves along a helical path down the jet. The changes in the viewing angle caused by helical motion imply strong changes in the Doppler factor, from , when the emission region is closest to our line of sight, to when it is farthest. The larger value is similar to obtained by Casadio et al. (2015) based on VLBA data.
Our long-term study of the polarimetric behaviour of CTA 102 allows us to identify at least 3 episodes of sustained clockwise rotations and no similar episodes of counter-clockwise rotation. This repeated behaviour suggests that the cause of the rotations is geometrical rather than the result of random walks related to a disordered magnetic field (although some shorter, apparently random rotations, occur as well) (Kiehlmann et al., 2016).
As is shown in Figs. 2, 11, the mean level of polarization of CTA 102 substantially increased shortly before the onset of the 2012 outburst, and did not revert to the pre-outburst level until fall 2015. This supports the hypothesis that secular variations of the viewing angle of the jet led to both enhanced photometric activity and corresponding changes in the linear polarization. We can expect that flaring activity in this blazar will be more pronounced than in previous years as long as the jet remains closely aligned with our line of sight. Indeed, as reported by Carrasco et al. (2016), Balonek (2016), and Becerra et al. (2016), at the end of 2016 January a new high-amplitude outburst occurred at -ray, optical, and near-infrared bands (see also http://vo.astro.spbu.ru/sites/default/files/optic/cta102R.png). Unfortunately, this happened when the object was difficult to observe owing to proximity to the sun in the sky, so this expected effect cannot yet be verified in detail.
5 Conclusions
During the GASP/WEBT campaign we obtained densely sampled optical photometric and polarimetric data around the period of unprecedented optical and -ray activity of CTA 102, and combined optical data with contemporaneous observations throughout the -ray to near-infrared frequency range. We find detailed correspondence of optical and -ray events, which confirms co-spatiality of the synchrotron and inverse Compton emission sites. The relation between optical and -ray flux during the height of the outburst is roughly linear. This is as expected from either the external Compton process for the high-energy emission or from variable Doppler boosting acting as the main factor controlling the overall pattern of variability at both energy ranges. However, the Doppler boosting caused by changed viewing angle of the emission region is a preferred explanation for the variability of the total flux and polarization parameters. In contrast, during the decay the relation between the fluxes is, within the uncertainties, consistent with the law expected from the SSC mechanism. Presumably, any changes in viewing angle during the decline were too minor to have a dominant effect on the variations in flux.
We have determined the SED of the variable component of synchrotron emission during both quiescence and the stages of outburst, and found appreciable hardening of the SED during the outburst. This hardening could be explained by convexity of the UV–NIR spectrum (see Fig. 5) that moved to higher frequencies owing to an increased Doppler shift as the viewing angle decreased. This effect could have been amplified by an increase in the number of high-energy electrons. The same spectral hardening is apparent in the -ray part of the spectrum.
As we can judge from our data, the change of viewing angle that led to enhanced activity in CTA 102 starting in 2012 may have resulted in a higher duty cycle of activity. When the viewing angle is smaller, the Doppler factor is more sensitive to changes in that angle, hence variations caused by a non-constant viewing angle will be more pronounced and occur over shorter time intervals.
Acknowledgements
The St. Petersburg University team acknowledges support from Russian RFBR grant 15-02-00949 and St. Petersburg University research grants 6.38.335.2015, 6.42.1113.2016. The research at Boston University was funded in part by NASA Fermi Guest Investigator grants NNX08AV65G, NNX10AO59G, NNX10AU15G, NNX11AO37G, NNX11AQ03G, and NNX14AQ58G. The research at Steward Observatory was funded in part by NASA Fermi Guest Investigator grants NNX09AU10G and NNX12AO93G. Acquisition of the MAPCAT data at Calar Alto is performed at the IAA-CSIC and is supported by the Spanish Ministry of Economy and Competitiveness (MINECO) grant AYA2013- 40825-P. I.A. acknowledges support by a Ramón y Cajal grant of the MINECO. AZT-24 observations are made within an agreement between Pulkovo, Rome and Teramo observatories. The PRISM camera at Lowell Observatory was developed by K. Janes et al. at BU and Lowell Observatory, with funding from the NSF, BU, and Lowell Observatory. This research was conducted in part using the Mimir instrument, jointly developed at Boston University and Lowell Observatory and supported by NASA, NSF, and the W. M. Keck Foundation. Calar Alto Observatory is jointly operated by the Max-Planck-Institut für Astronomie and the Instituto de Astrofísica de Andalucía-CSIC. This research was partially supported by the Scientific Research Fund of the Bulgarian Ministry of Education and Sciences under grant DO 02-137 (BIn-13/09). The Maidanak Observatory team acknowledges support from Uzbekistan Academy of Sciences grant F2-FA-F027. Skinakas Observatory is a collaborative project of the University of Crete, the Foundation for Research and Technology – Hellas, and the Max-Planck-Institut für Extraterrestrische Physik. This article is partly based on observations made with the IAC80 and TCS telescopes operated by the Instituto de Astrofisica de Canarias in the Spanish Observatorio del Teide on the island of Tenerife.
References
- Ackermann et al. (2012) Ackermann M., et al., 2012, ApJS, 203, 4
- Agudo et al. (2011) Agudo I., et al., 2011, ApJ, 726, L13
- Angel & Stockman (1980) Angel J. R. P., Stockman H. S., 1980, ARA&A, 18, 321
- Atwood et al. (2009) Atwood W. B., et al., 2009, ApJ, 697, 1071
- Balonek (2016) Balonek T., 2016, The Astronomer’s Telegram, 8598
- Becerra et al. (2016) Becerra J., Carpenter B., Cutini S., 2016, The Astronomer’s Telegram, 8722
- Blom et al. (1995) Blom J. J., et al., 1995, A&A, 295, 330
- Breeveld et al. (2011) Breeveld A. A., Landsman W., Holland S. T., Roming P., Kuin N. P. M., Page M. J., 2011, in McEnery J. E., Racusin J. L., Gehrels N., eds, American Institute of Physics Conference Series Vol. 1358, American Institute of Physics Conference Series. pp 373–376 (arXiv:1102.4717), doi:10.1063/1.3621807
- Cardelli et al. (1989) Cardelli J. A., Clayton G. C., Mathis J. S., 1989, ApJ, 345, 245
- Carnerero et al. (2015) Carnerero M. I., et al., 2015, MNRAS, 450, 2677
- Carrasco et al. (2016) Carrasco L., Recillas E., Miramon J., Porras A., Chavushyan V., Carraminana A., 2016, The Astronomer’s Telegram, 8590
- Casadio et al. (2015) Casadio C., et al., 2015, ApJ, 813, 51
- Dickey & Lockman (1990) Dickey J. M., Lockman F. J., 1990, ARA&A, 28, 215
- Edelson & Krolik (1988) Edelson R. A., Krolik J. H., 1988, ApJ, 333, 646
- Gabuzda et al. (2008) Gabuzda D. C., Vitrishchak V. M., Mahmud M., O’Sullivan S. P., 2008, MNRAS, 384, 1003
- Hagen-Thorn et al. (2008) Hagen-Thorn V. A., Larionov V. M., Jorstad S. G., Arkharov A. A., Hagen-Thorn E. I., Efimova N. V., Larionova L. V., Marscher A. P., 2008, ApJ, 672, 40
- Hufnagel & Bregman (1992) Hufnagel B. R., Bregman J. N., 1992, ApJ, 386, 473
- Isler et al. (2013) Isler J. C., et al., 2013, ApJ, 779, 100
- Isler et al. (2015) Isler J. C., et al., 2015, ApJ, 804, 7
- Itoh et al. (2013) Itoh R., et al., 2013, ApJ, 768, L24
- Katajainen et al. (2000) Katajainen S., et al., 2000, A&AS, 143, 357
- Kiehlmann et al. (2016) Kiehlmann S., et al., 2016, A&A, 590, A10
- Larionov et al. (2010) Larionov V. M., Villata M., Raiteri C. M., 2010, A&A, 510, A93
- Larionov et al. (2012) Larionov V., Blinov D., Jorstad S., 2012, The Astronomer’s Telegram, 4397
- Larionov et al. (2013a) Larionov V. M., et al., 2013a, in European Physical Journal Web of Conferences. p. 04019, doi:10.1051/epjconf/20136104019
- Larionov et al. (2013b) Larionov V. M., et al., 2013b, ApJ, 768, 40
- León-Tavares et al. (2013) León-Tavares J., et al., 2013, ApJ, 763, L36
- Marscher & Jorstad (2010) Marscher A. P., Jorstad S. G., 2010, in Savolainen T., Ros E., Porcas R. W., Zensus J. A., eds, Fermi meets Jansky - AGN in Radio and Gamma Rays. Proceedings of a Workshop held 21-23 June, 2010 at the Max-Planck-Institut f. Radioastronomie, Bonn, Germany. Edited by Tuomas Savolainen, Eduardo Ros, Richard W. Porcas and J. Anton Zensus. Bonn: Max-Planck-Institut f. Radioastronomie, 2010.. p. 171 (arXiv:1005.5551)
- Marscher et al. (2010) Marscher A. P., et al., 2010, ApJ, 710, L126
- Mead et al. (1990) Mead A. R. G., Ballard K. R., Brand P. W. J. L., Hough J. H., Brindle C., Bailey J. A., 1990, A&AS, 83, 183
- Moore & Stockman (1981) Moore R. L., Stockman H. S., 1981, ApJ, 243, 60
- Nolan et al. (1993) Nolan P. L., et al., 1993, ApJ, 414, 82
- Nolan et al. (2012) Nolan P. L., et al., 2012, ApJS, 199, 31
- Osterman Meyer et al. (2009) Osterman Meyer A., Miller H. R., Marshall K., Ryle W. T., Aller H., Aller M., Balonek T., 2009, AJ, 138, 1902
- Pica et al. (1988) Pica A. J., Smith A. G., Webb J. R., Leacock R. J., Clements S., Gombola P. P., 1988, AJ, 96, 1215
- Raiteri et al. (1998) Raiteri C. M., Villata M., Lanteri L., Cavallone M., Sobrito G., 1998, A&AS, 130, 495
- Raiteri et al. (2008) Raiteri C. M., et al., 2008, A&A, 491, 755
- Raiteri et al. (2010) Raiteri C. M., et al., 2010, A&A, 524, A43
- Raiteri et al. (2012) Raiteri C. M., et al., 2012, A&A, 545, A48
- Raiteri et al. (2013) Raiteri C. M., et al., 2013, MNRAS, 436, 1530
- Raiteri et al. (2014) Raiteri C. M., et al., 2014, MNRAS, 442, 629
- Sandage & Wyndham (1965) Sandage A., Wyndham J. D., 1965, ApJ, 141, 328
- Schlafly & Finkbeiner (2011) Schlafly E. F., Finkbeiner D. P., 2011, ApJ, 737, 103
- Villata et al. (2001) Villata M., Raiteri C. M., Sobrito G., de Francesco G., Lanteri L., Cavallone M., 2001, Astrophysical Letters and Communications, 40, 123
- Villata et al. (2008) Villata M., et al., 2008, A&A, 481, L79
- Villata et al. (2009) Villata M., et al., 2009, A&A, 504, L9
- Wardle & Kronberg (1974) Wardle J. F. C., Kronberg P. P., 1974, ApJ, 194, 249
- Wills & Brotherton (1995) Wills B. J., Brotherton M. S., 1995, ApJ, 448, L81