Analyzing the Behavior of Visual Question Answering Models
Abstract
Recently, a number of deep-learning based models have been proposed for the task of Visual Question Answering (VQA). The performance of most models is clustered around 60-70%. In this paper we propose systematic methods to analyze the behavior of these models as a first step towards recognizing their strengths and weaknesses, and identifying the most fruitful directions for progress. We analyze two models, one each from two major classes of VQA models – with-attention and without-attention and show the similarities and differences in the behavior of these models. We also analyze the winning entry of the VQA Challenge 2016.
Our behavior analysis reveals that despite recent progress, today’s VQA models are “myopic” (tend to fail on sufficiently novel instances), often “jump to conclusions” (converge on a predicted answer after ‘listening’ to just half the question), and are “stubborn” (do not change their answers across images).
1 Introduction
Visual Question Answering (VQA) is a recently-introduced [Antol et al., 2015, Geman et al., 2014, Malinowski and Fritz, 2014] problem where given an image and a natural language question (e.g., “What kind of store is this?”, “How many people are waiting in the queue?”), the task is to automatically produce an accurate natural language answer (“bakery”, “5”). A flurry of recent deep-learning based models have been proposed for VQA [Antol et al., 2015, Chen et al., 2015, Yang et al., 2016, Xu and Saenko, 2016, Jiang et al., 2015, Andreas et al., 2016a, Wang et al., 2015, Kafle and Kanan, 2016, Lu et al., 2016, Andreas et al., 2016b, Shih et al., 2016, Kim et al., 2016, Fukui et al., 2016, Noh and Han, 2016, Ilievski et al., 2016, Wu et al., 2016, Xiong et al., 2016, Zhou et al., 2015, Saito et al., 2016]. Curiously, the performance of most methods is clustered around 60-70% (compared to human performance of 83% on open-ended task and 91% on multiple-choice task) with a mere 5% gap between the top-9 entries on the VQA Challenge 2016.111http://www.visualqa.org/challenge.html It seems clear that as a first step to understand these models, to meaningfully compare strengths and weaknesses of different models, to develop insights into their failure modes, and to identify the most fruitful directions for progress, it is crucial to develop techniques to understand the behavior of VQA models.
In this paper, we develop novel techniques to characterize the behavior of VQA models. As concrete instantiations, we analyze two VQA models [Lu et al., 2015, Lu et al., 2016], one each from two major classes of VQA models – with-attention and without-attention. We also analyze the winning entry [Fukui et al., 2016] of the VQA Challenge 2016.
2 Related Work
Our work is inspired by previous works that diagnose the failure modes of models for different tasks. [Karpathy et al., 2016] constructed a series of oracles to measure the performance of a character level language model. [Hoiem et al., 2012] provided analysis tools to facilitate detailed and meaningful investigation of object detector performance. This paper aims to perform behavior analyses as a first step towards diagnosing errors for VQA.
[Yang et al., 2016] categorize the errors made by their VQA model into four categories – model focuses attention on incorrect regions, model focuses attention on appropriate regions but predicts incorrect answers, predicted answers are different from labels but might be acceptable, labels are wrong. While these are coarse but useful failure modes, we are interested in understanding the behavior of VQA models along specific dimensions – whether they generalize to novel instances, whether they listen to the entire question, whether they look at the image.
3 Behavior Analyses
We analyze the behavior of VQA models along the following three dimensions –
Generalization to novel instances: We investigate whether the test instances that are incorrectly answered are the ones that are “novel” i.e., not similar to training instances. The novelty of the test instances may be in two ways – 1) the test question-image (QI) pair is “novel”, i.e., too different from training QI pairs; and 2) the test QI pair is “familiar”, but the answer required at test time is “novel”, i.e., answers seen during training are different from what needs to be produced for the test QI pairs.
Complete question understanding: To investigate whether a VQA model is understanding the input question or not, we analyze if the model ‘listens’ to only first few words of the question or the entire question, if it ‘listens’ to only question (wh) words and nouns or all the words in the question.
Complete image understanding: The absence of a large gap between performance of language-alone and language + vision VQA models [Antol et al., 2015] provides evidence that current VQA models seem to be heavily reliant on the language model, perhaps not really understanding the image. In order to analyze this behavior, we investigate whether the predictions of the model change across images for a given question.
We present our behavioral analyses on the VQA dataset [Antol et al., 2015]. VQA is a large-scale free-form natural-language dataset containing 0.25M images, 0.76M questions, and 10M answers, with open-ended and multiple-choice modalities for answering the visual questions. All the experimental results are reported on the VQA validation set using the following models trained on the VQA training set for the open-ended task –
CNN + LSTM based model without-attention (CNN+LSTM): We use the best performing model of [Antol et al., 2015] (code provided by [Lu et al., 2015]), which achieves an accuracy of 54.13% on the VQA validation set. It is a two channel model – one channel processes the image (using Convolutional Neural Network (CNN) to extract image features) and the other channel processes the question (using Long Short-Term Memory (LSTM) recurrent neural network to obtain question embedding). The image and question features obtained from the two channels are combined and passed through a fully connected (FC) layer to obtain a softmax distribution over the space of answers.
CNN + LSTM based model with-attention (ATT): We use the top-entry on the VQA challenge leaderboard (as of June 03, 2016) [Lu et al., 2016], which achieves an accuracy of 57.02% on the VQA validation set.222Code available at https://github.com/jiasenlu/HieCoAttenVQA This model jointly reasons about image and question attention, in a hierarchical fashion. The attended image and question features obtained from different levels of the hierarchy are combined and passed through a FC layer to obtain a softmax distribution over the space of answers.
VQA Challenge 2016 winning entry (MCB): This is the multimodal compact bilinear (mcb) pooling model from [Fukui et al., 2016] which won the real image track of the VQA Challenge 2016. This model achieves an accuracy of 60.36% on the VQA validation set.333Code available at https://github.com/akirafukui/vqa-mcb In this model, multimodal compact bilinear pooling is used to predict attention over image features and also to combine the attended image features with the question features. These combined features are passed through a FC layer to obtain a softmax distribution over the space of answers.
3.1 Generalization to novel instances
Do VQA models make mistakes because test instances are too different from training ones? To analyze the first type of novelty (the test QI pair is novel), we measure the correlation between test accuracy and distance of test QI pairs from its k nearest neighbor (k-NN) training QI pairs. For each test QI pair we find its k-NNs in the training set and compute the average distance between the test QI pair and its k-NNs. The k-NNs are computed in the space of combined image + question embedding (just before passing through FC layer) for all the three models (using euclidean distance metric for the CNN+LSTM model and cosine distance metric for the ATT and MCB models).
The correlation between accuracy and average distance is significant (-0.41 at k=50444k=50 leads to highest correlation for the CNN+LSTM model and -0.42 at k=15555k=15 leads to highest correlation for the ATT model). A high negative correlation value tells that the model is less likely to predict correct answers for test QI pairs which are not very similar to training QI pairs, suggesting that the model is not very good at generalizing to novel test QI pairs. The correlation between accuracy and average distance is not significant for the MCB model (-0.14 at k=1666k=1 leads to highest correlation) suggesting that MCB is better at generalizing to novel test QI pairs.
We also found that 67.5% of mistakes made by the CNN+LSTM model can be successfully predicted by checking distance of test QI pair from its k-NN training QI pairs (66.7% for the ATT model, 55.08% for the MCB model). Thus, this analysis not only exposes a reason for mistakes made by VQA models, but also allows us to build human-like models that can predict their own oncoming failures, and potentially refuse to answer questions that are ‘too different’ from ones seen in past.
To analyze the second type of novelty (the answer required at test time is not familiar), we compute the correlation between test accuracy and the average distance of the test ground truth (GT) answer with GT answers of its k-NN training QI pairs. The distance between answers is computed in the space of average Word2Vec [Mikolov et al., 2013] vectors of answers. This correlation turns out to be quite high (-0.62) for both CNN+LSTM and ATT models and significant (-0.47) for the MCB model. A high negative correlation value tells that the model tends to regurgitate answers seen during training.
These distance features are also good at predicting failures – 74.19% of failures can be predicted by checking distance of test GT answer with GT answers of its k-NN training QI pairs for CNN+LSTM model (75.41% for the ATT model, 70.17% for the MCB model). Note that unlike the previous analysis, this analysis only explains failures but cannot be used to predict failures (since it uses GT labels). See Fig. 1 for qualitative examples.
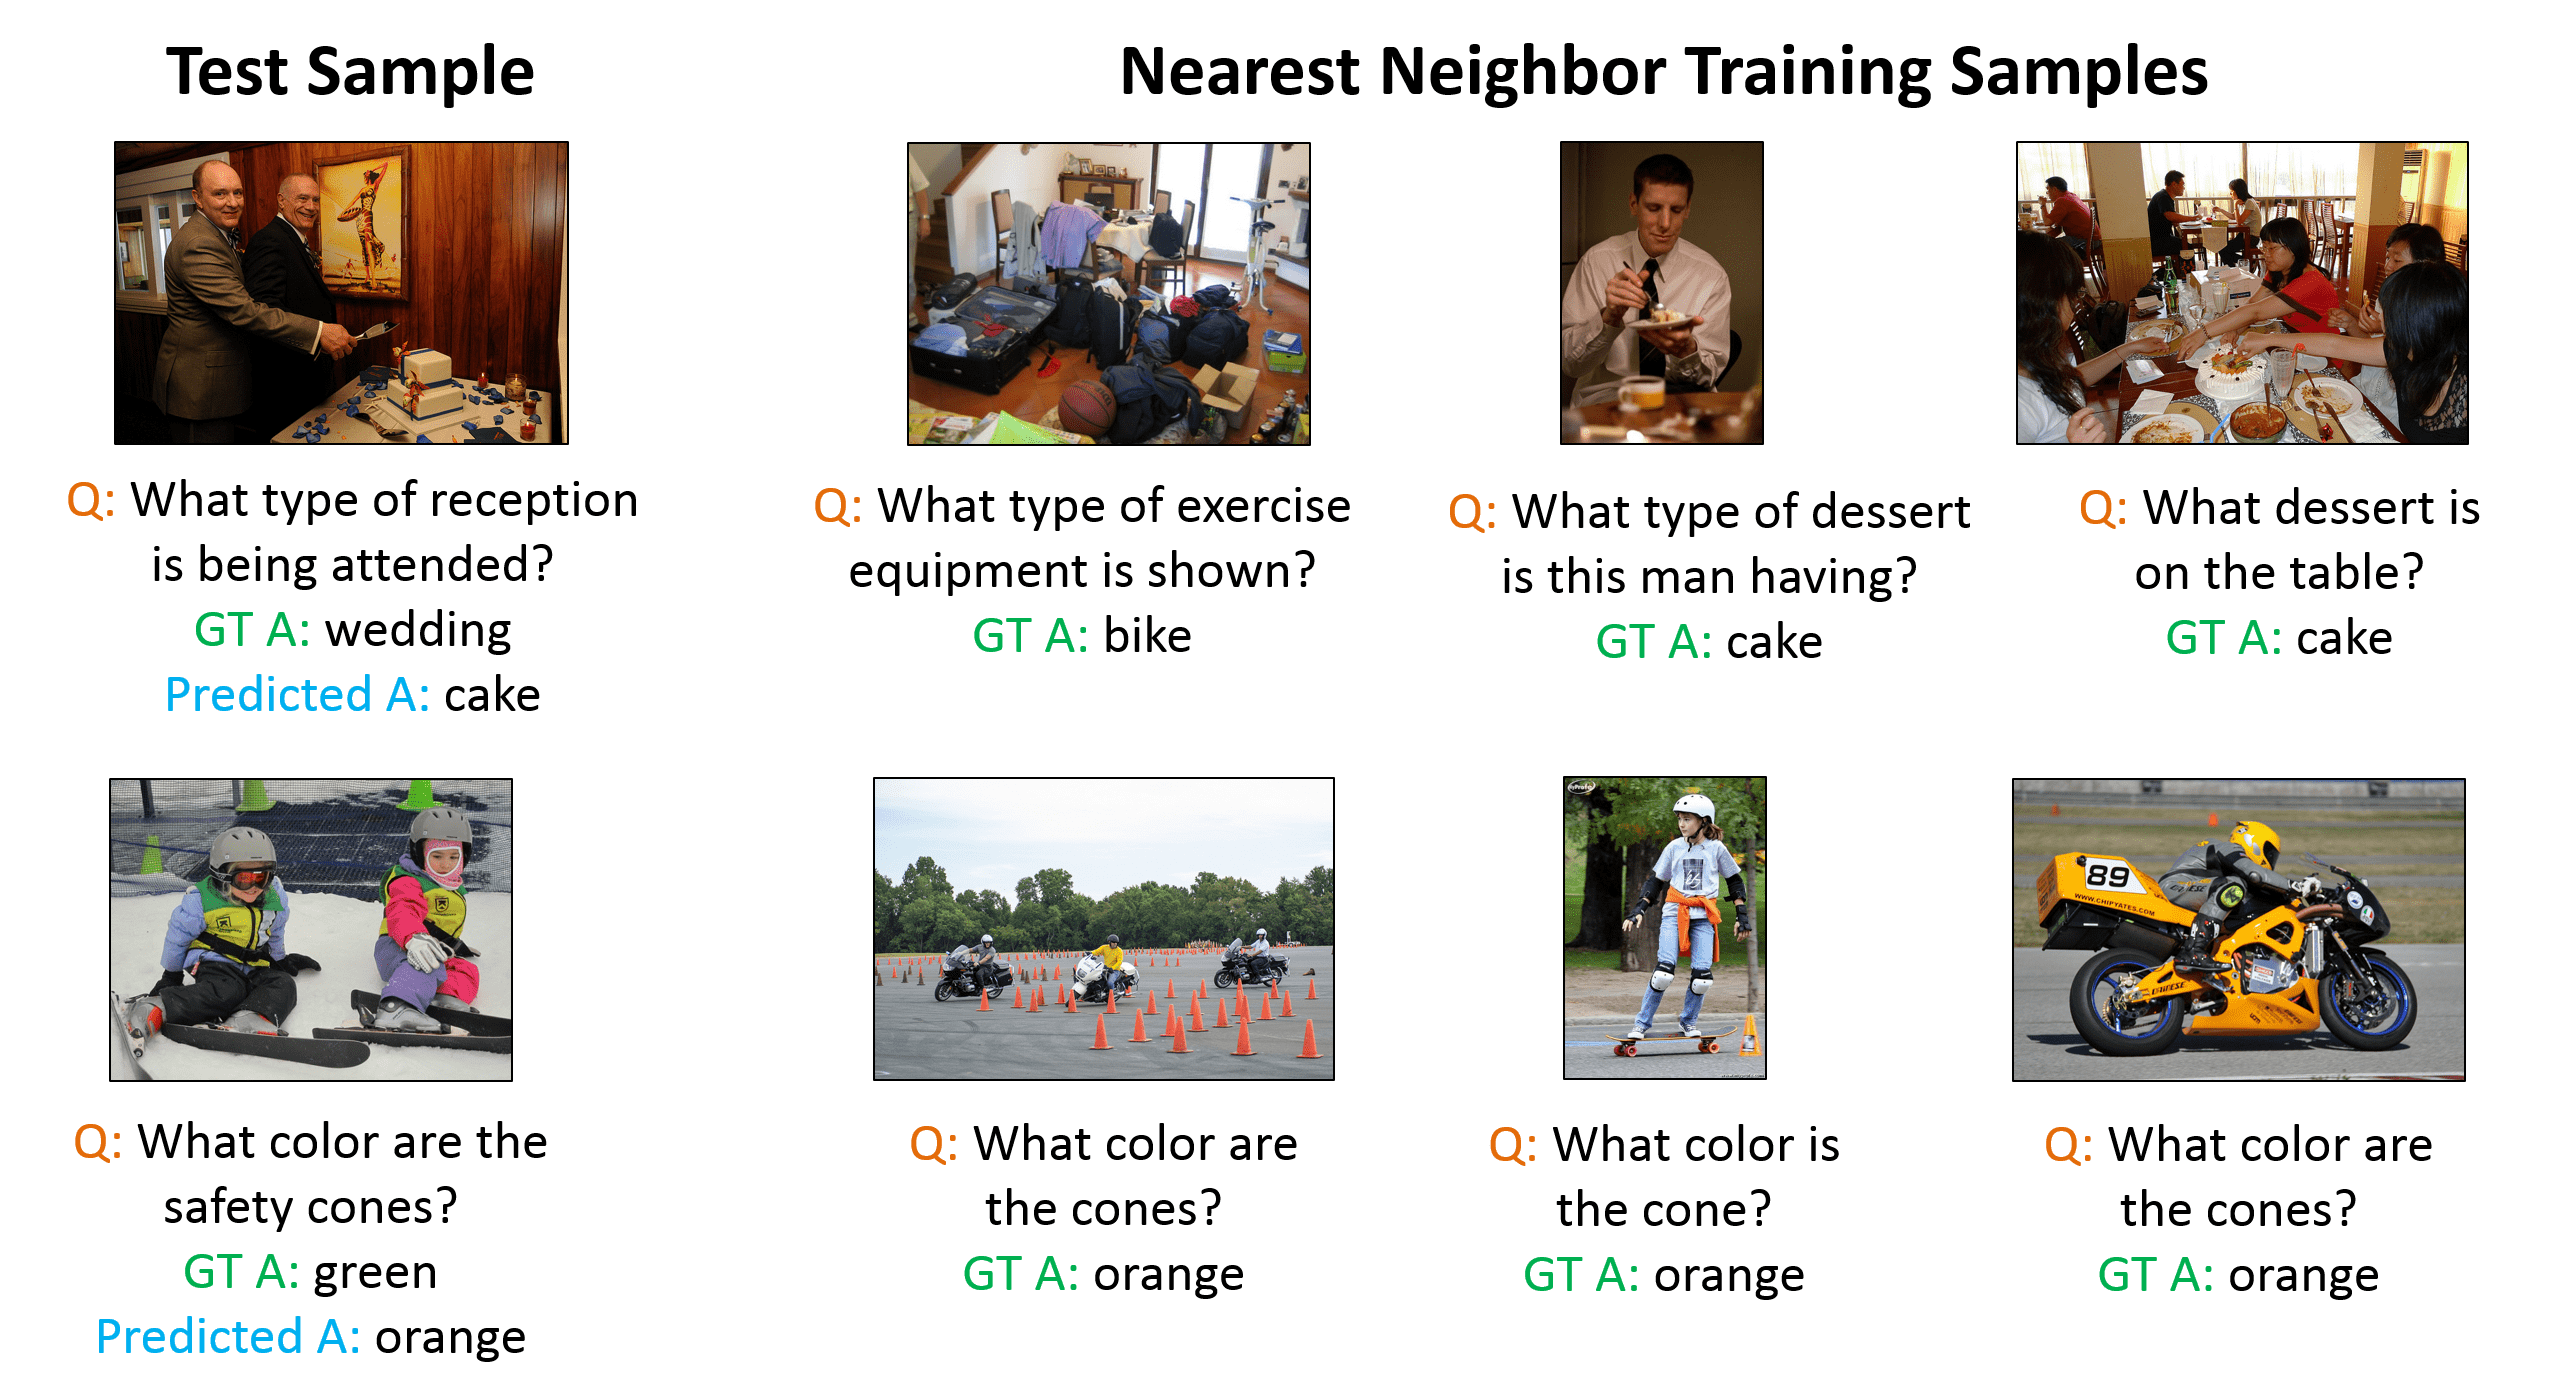
From Fig. 1 (row1) we can see that the test QI pair is semantically quite different from its k-NN training QI pairs ({1st, 2nd, 3rd}-NN distances are {15.05, 15.13, 15.17}, which are higher than the corresponding distances averaged across all success cases: {8.74, 9.23, 9.50.}), explaining the mistake. Row2 shows an example where the model has seen the same question in the training set (test QI pair is semantically similar to training QI pairs) but, since it has not seen “green cone” for training instances (answers seen during training are different from what needs to be produced for the test QI pair), it is unable to answer the test QI pair correctly. This shows that current models lack compositionality: the ability to combine the concepts of “cone” and “green” (both of which have been seen in training set) to answer “green cone” for the test QI pair. This compositionality is desirable and central to intelligence.
3.2 Complete question understanding
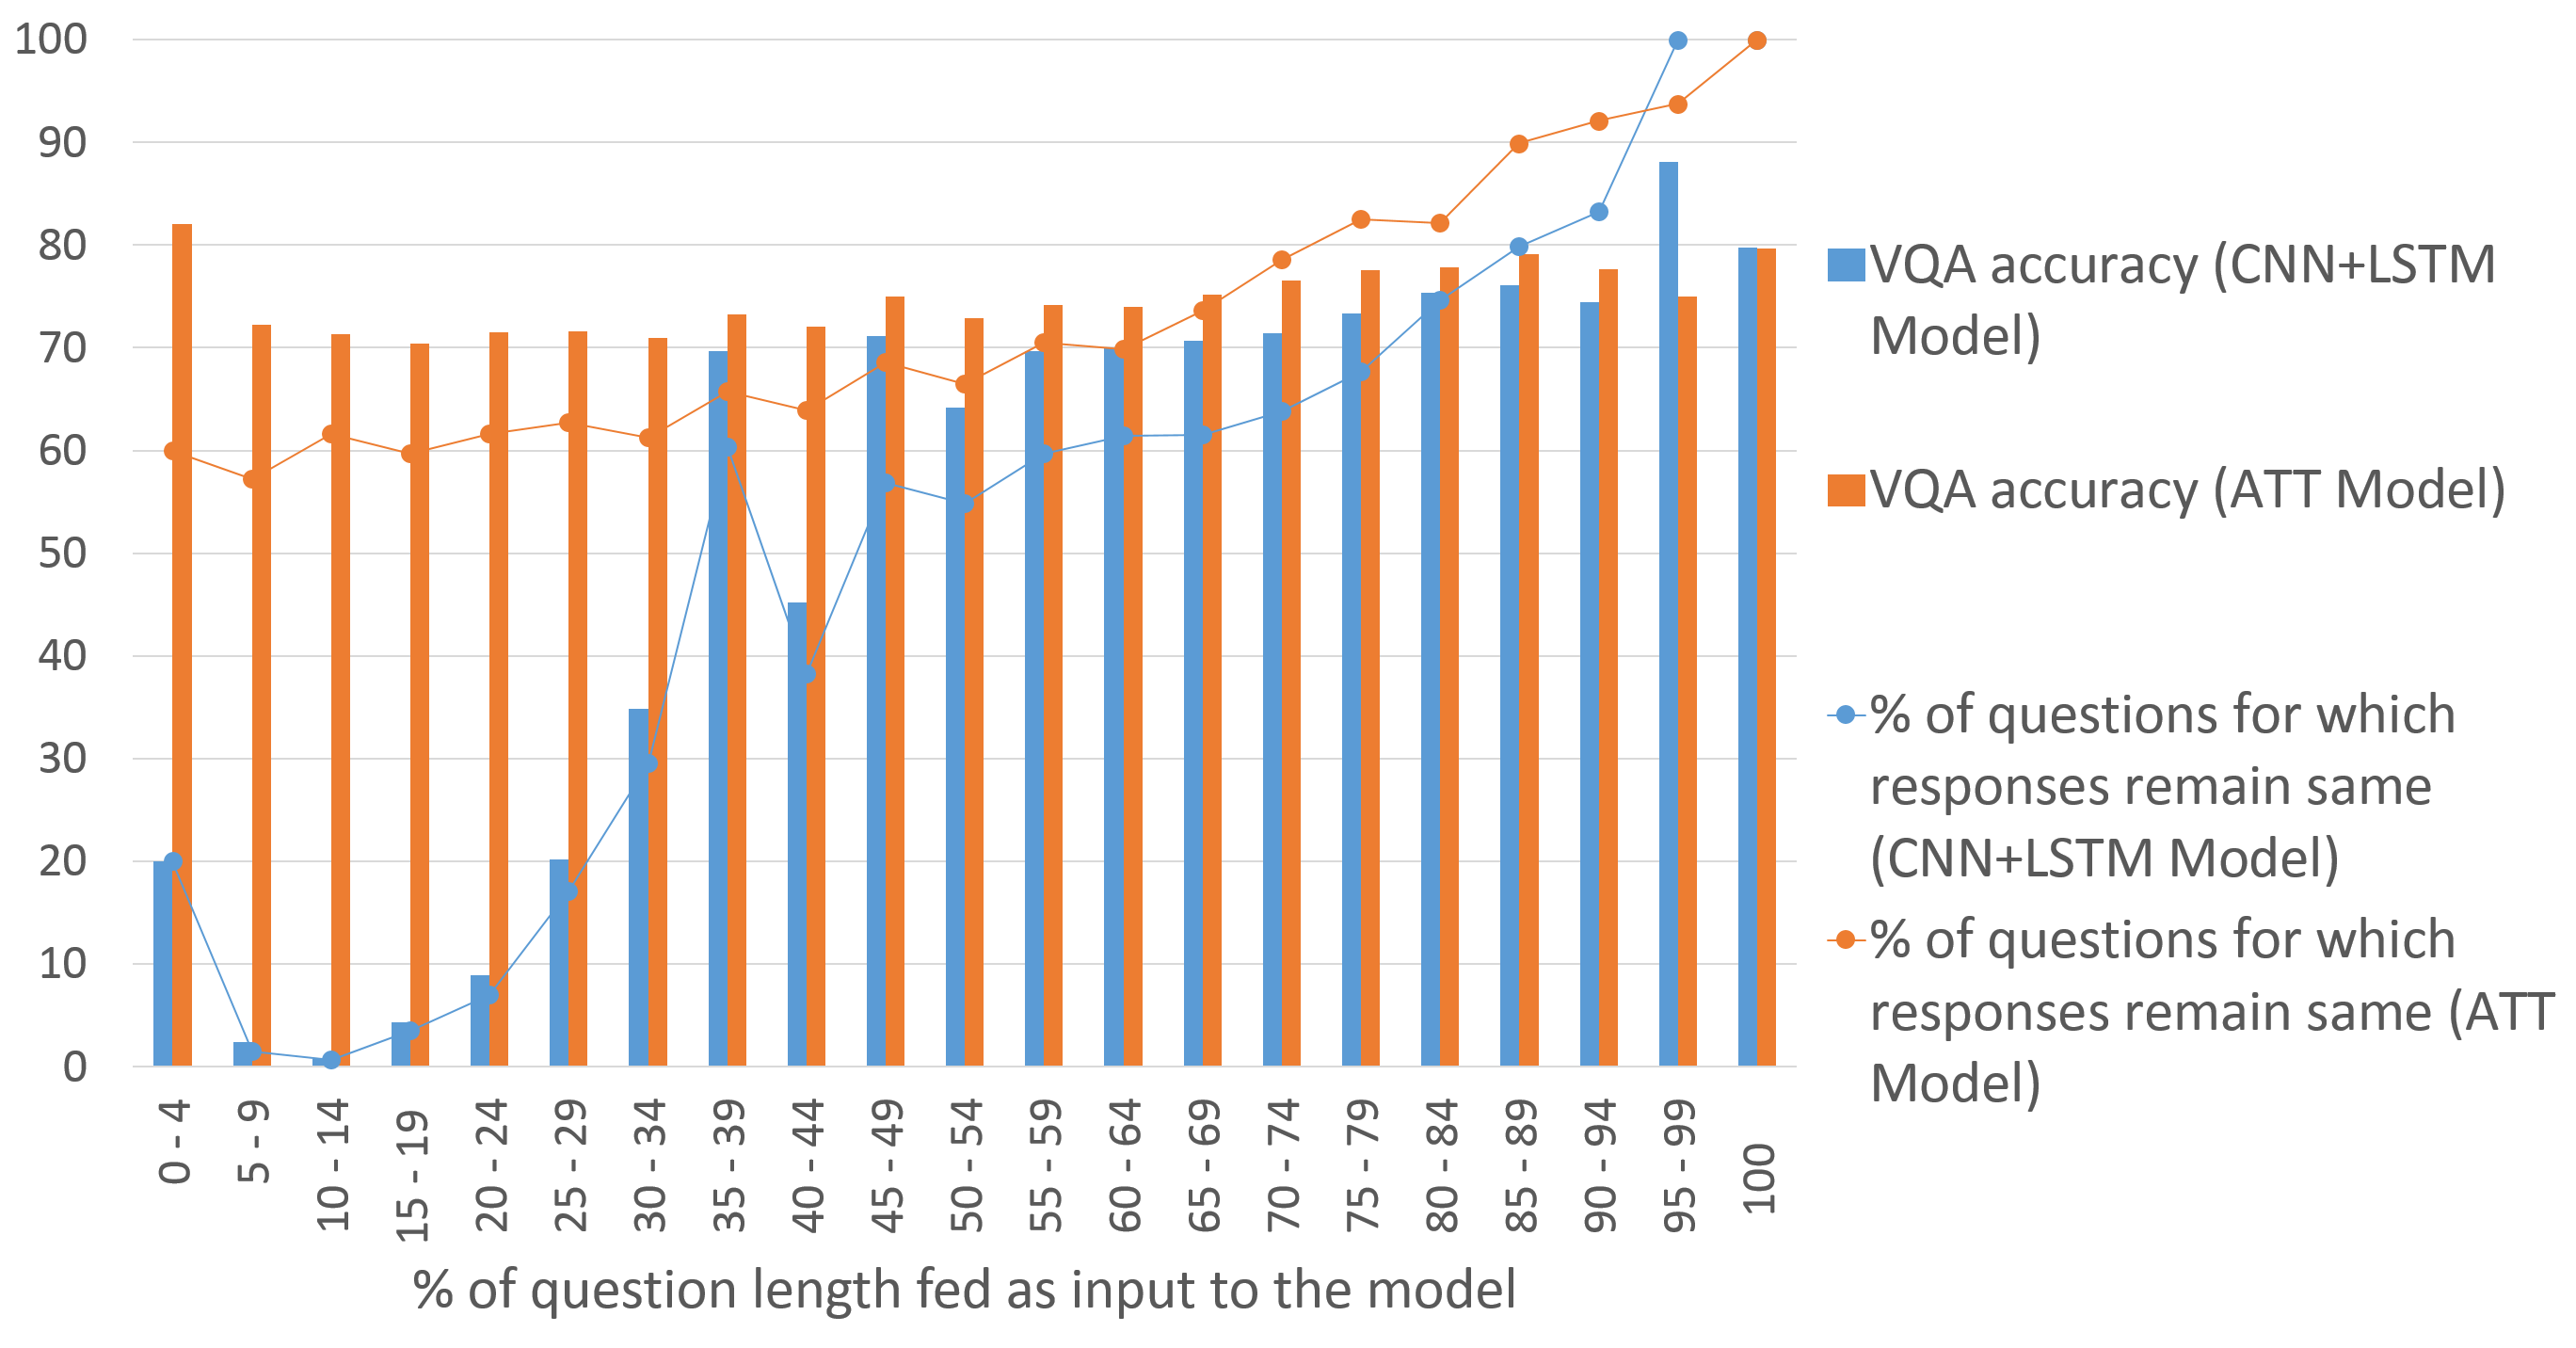
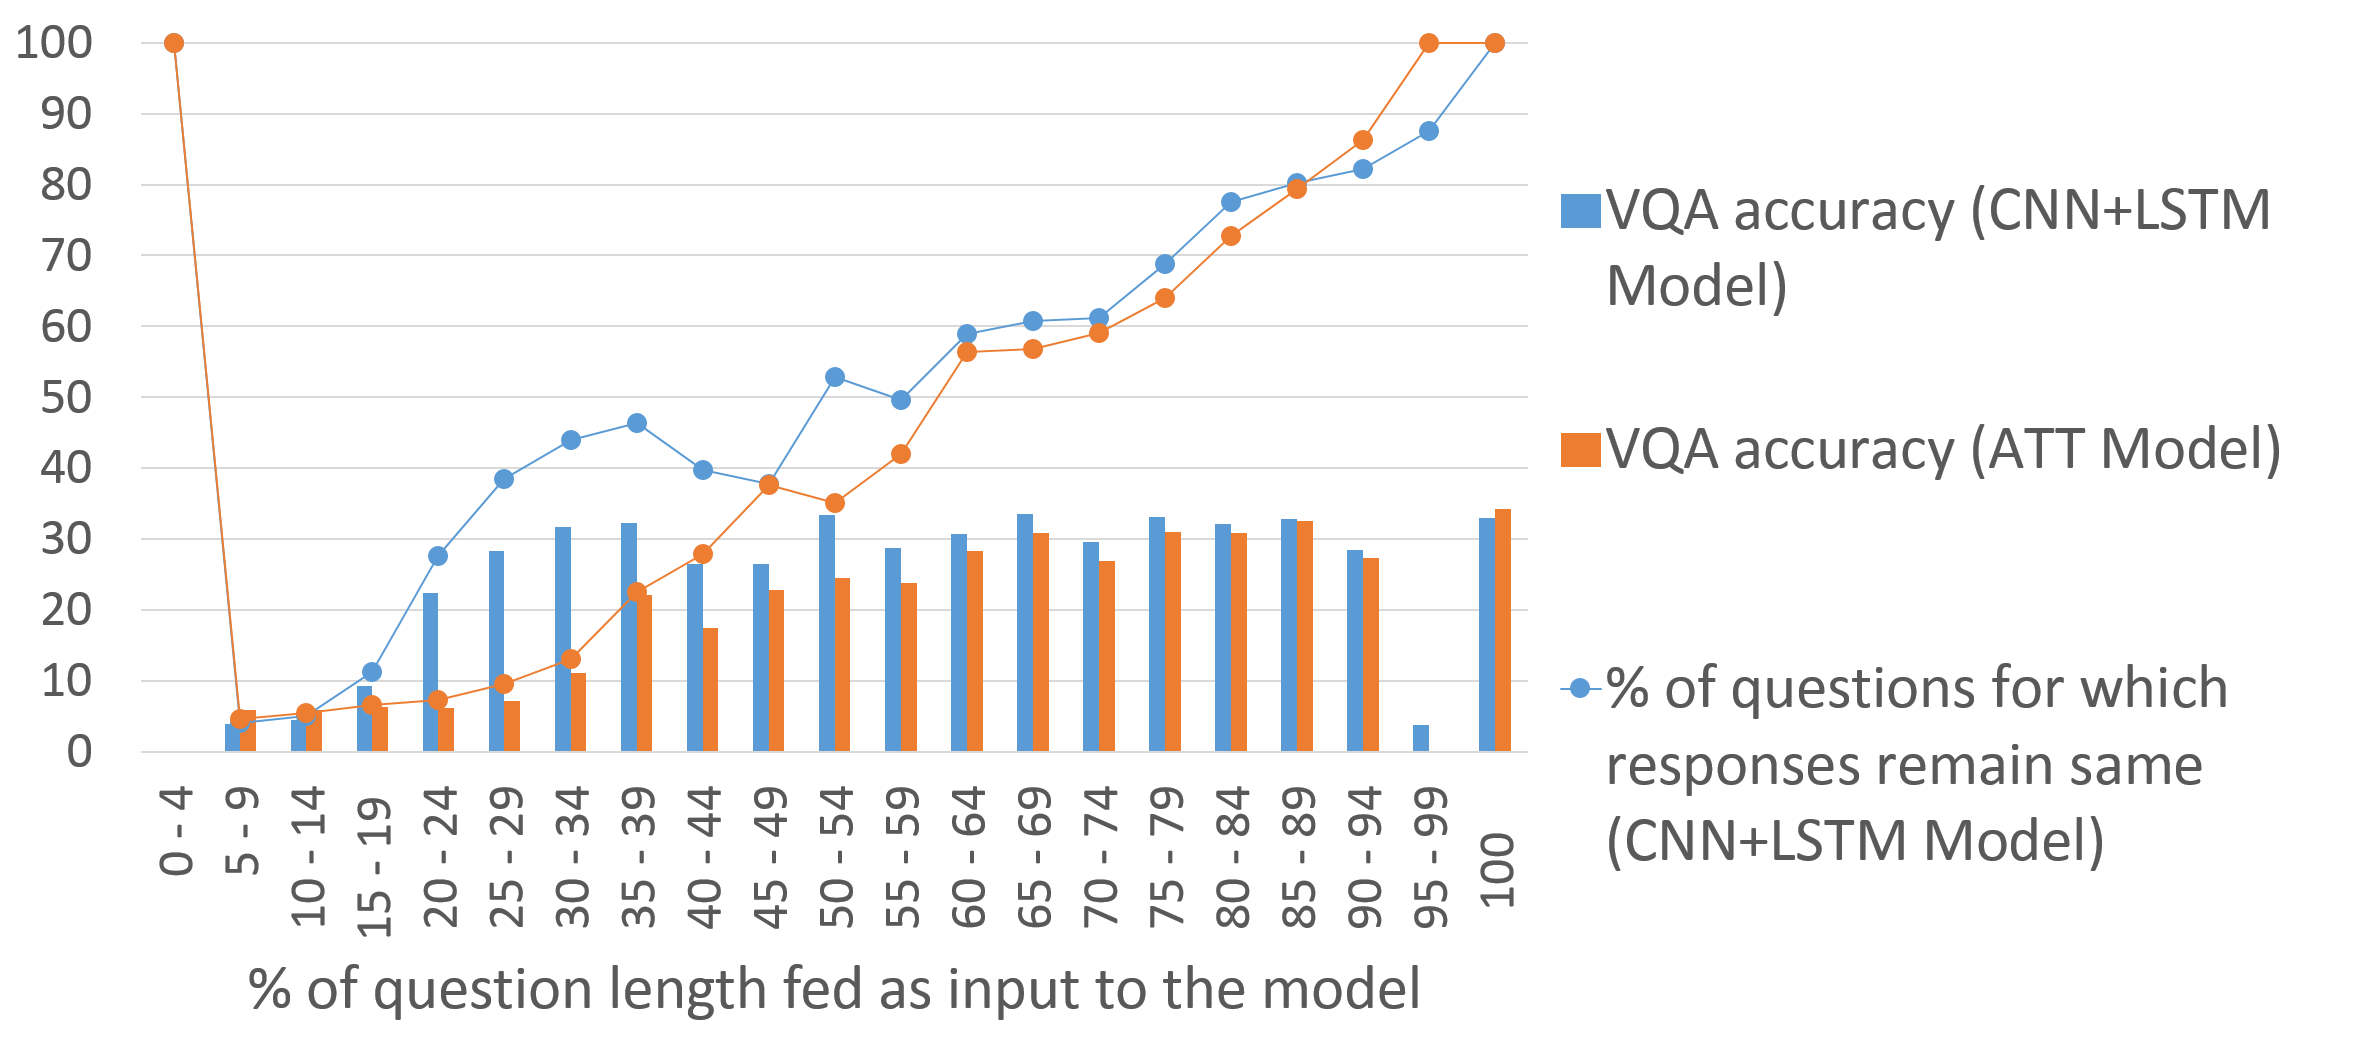
We feed partial questions of increasing lengths (from 0-100% of question from left to right). We then compute what percentage of responses do not change when more and more words are fed.

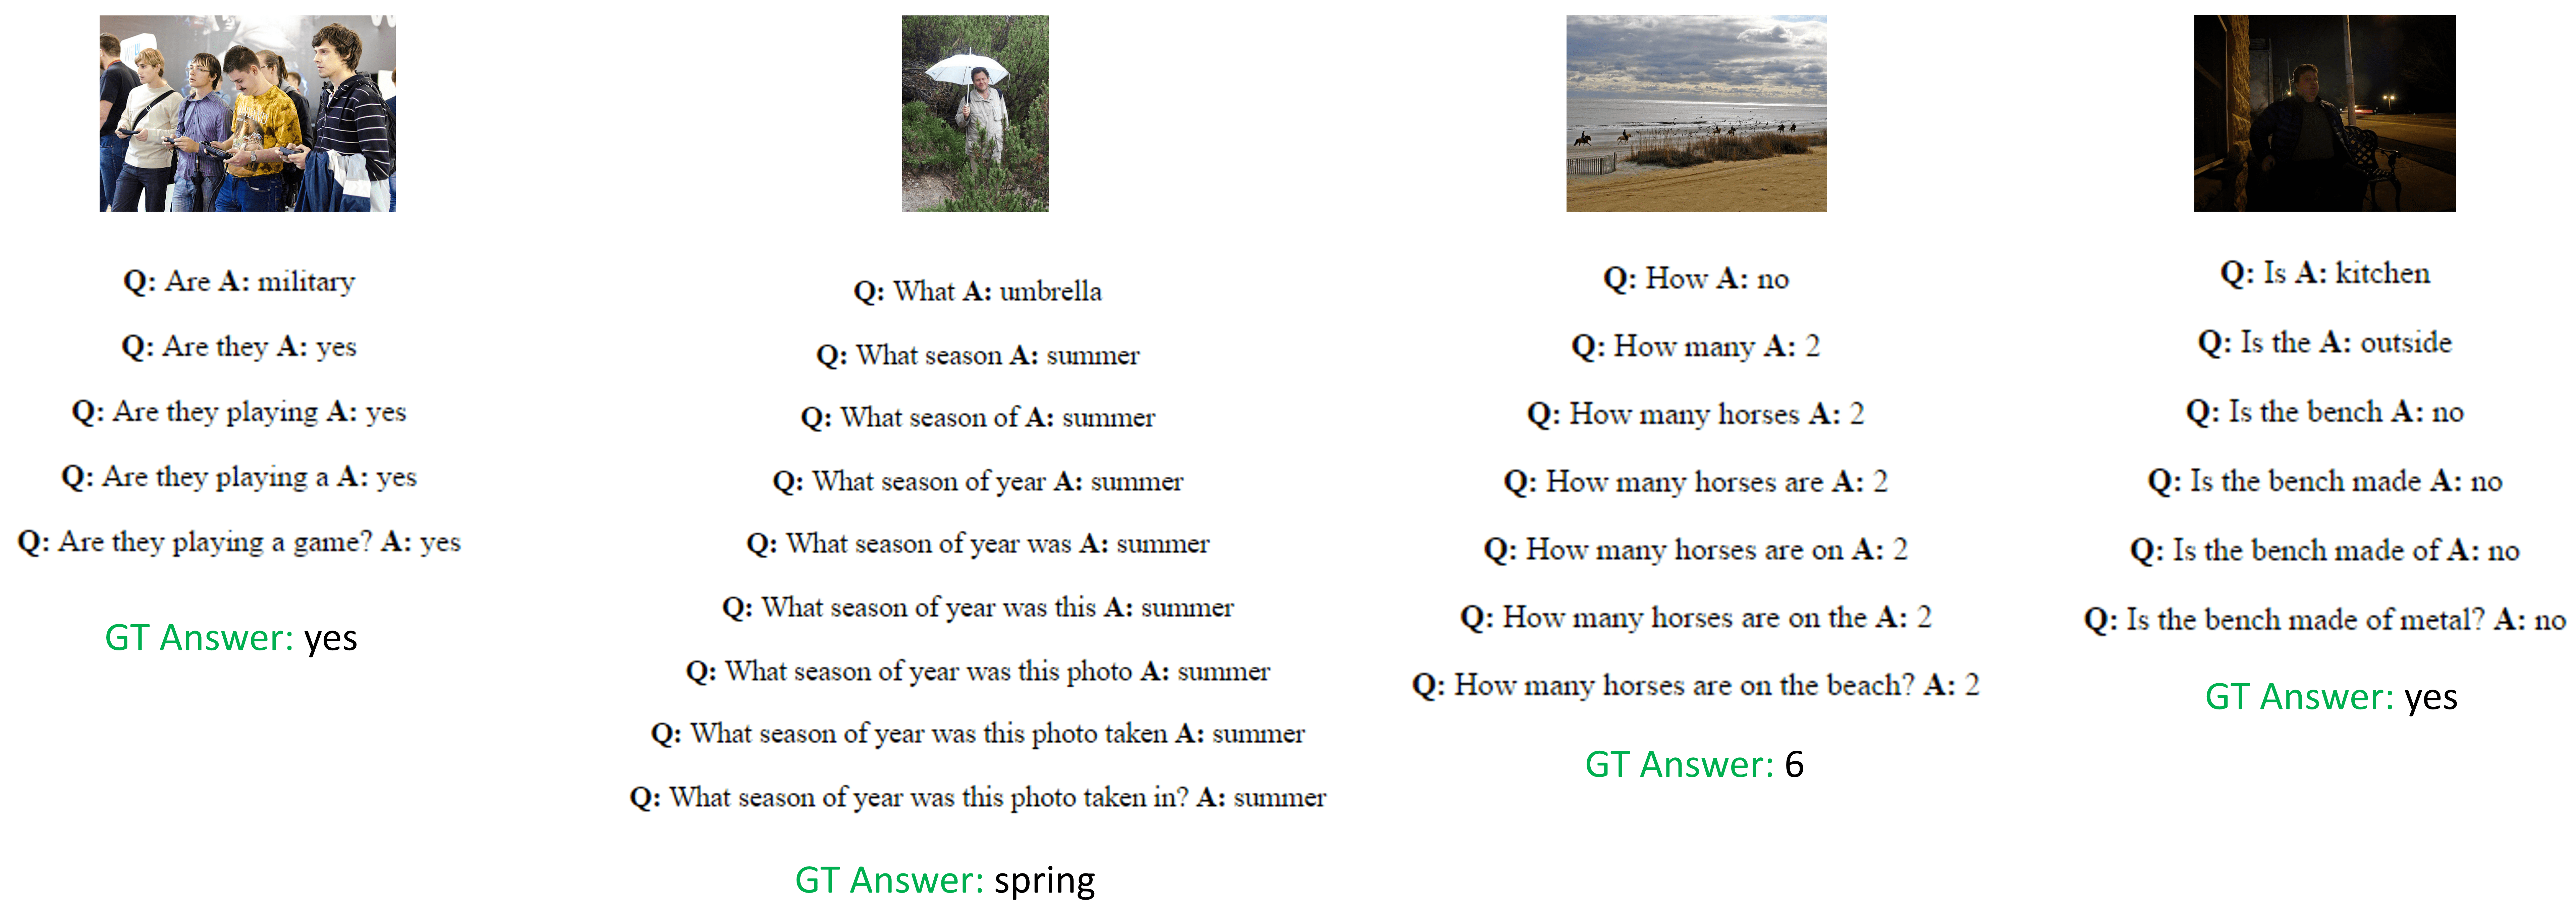
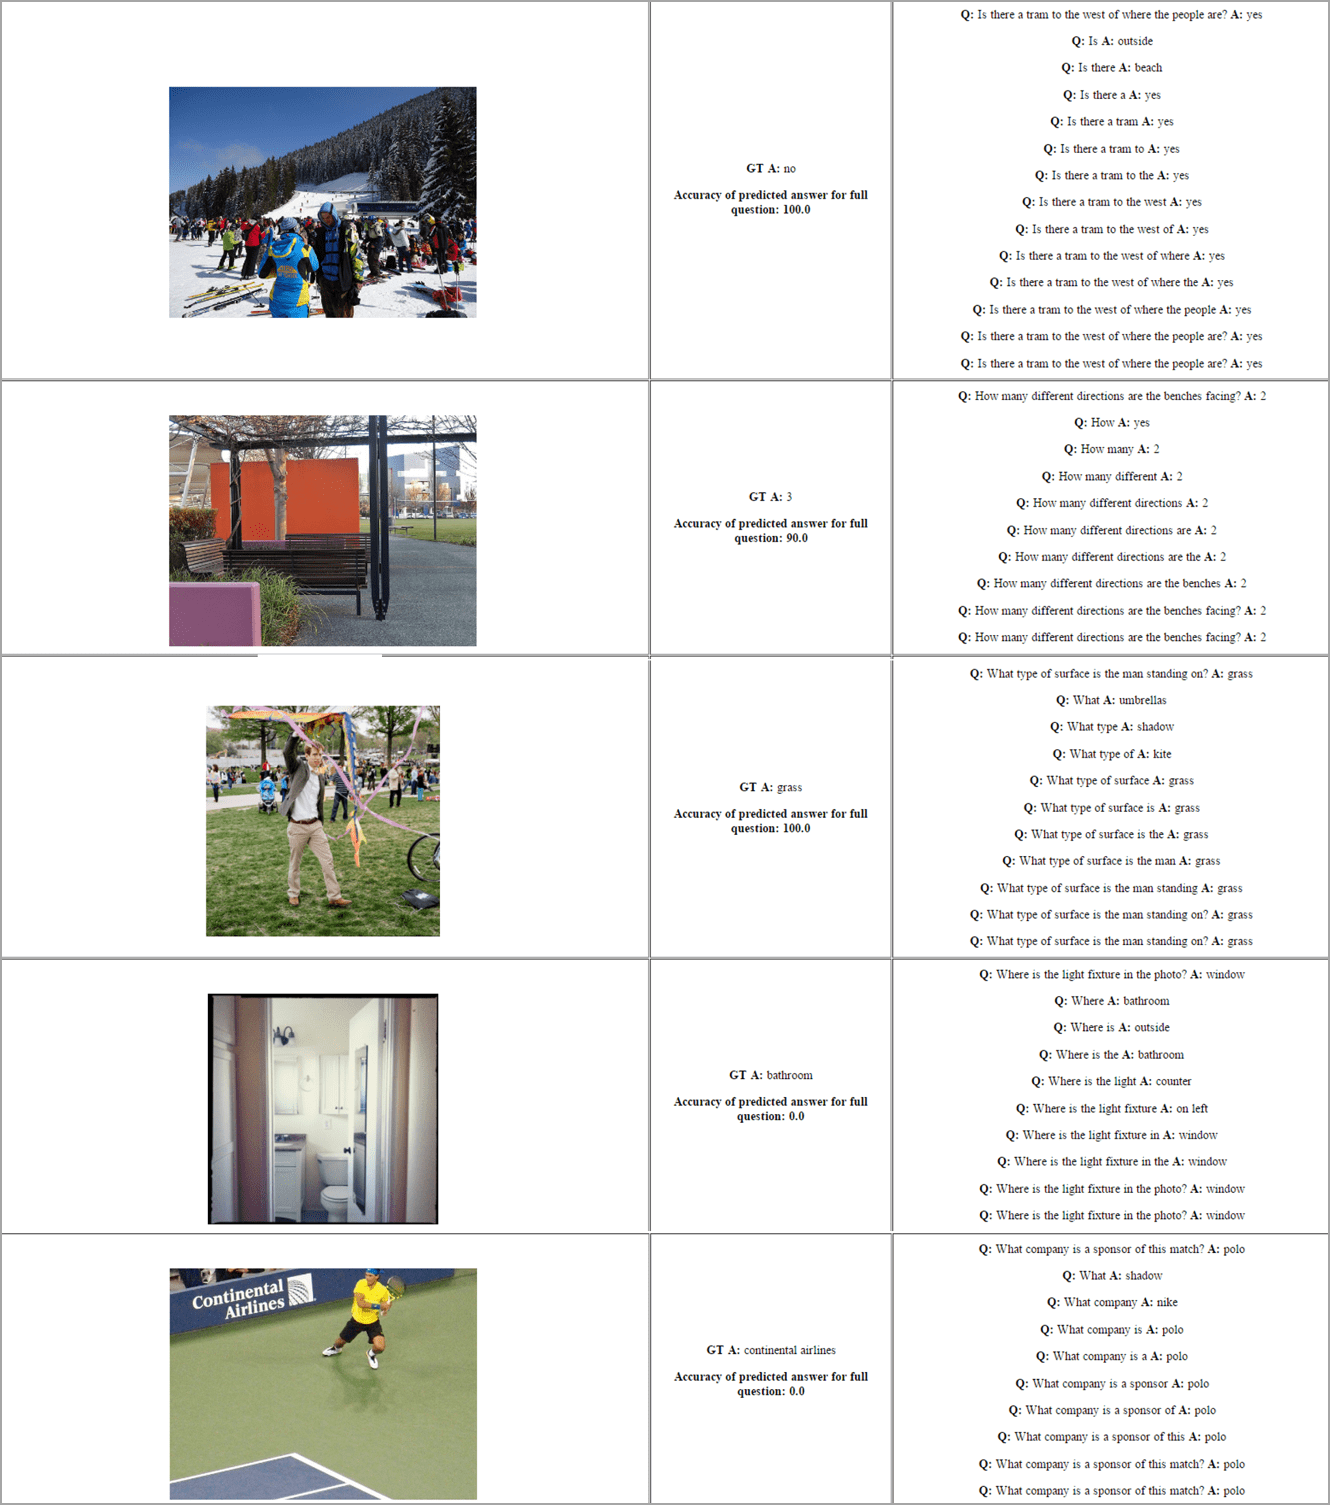
Fig. 2 shows the test accuracy and percentage of questions for which responses remain same (compared to entire question) as a function of partial question length. We can see that for 40% of the questions, the CNN+LSTM model seems to have converged on a predicted answer after ‘listening’ to just half the question. This shows that the model is listening to first few words of the question more than the words towards the end. Also, the model has 68% of the final accuracy (54%) when making predictions based on half the original question. When making predictions just based on the image, the accuracy of the model is 24%. The ATT model seems to have converged on a predicted answer after listening to just half the question more often (49% of the time), achieving 74% of the final accuracy (57%). The MCB model converges on a predicted answer after listening to just half the question 45% of the time, achieving 67% of the final accuracy (60%). See Fig. 3 for qualitative examples.
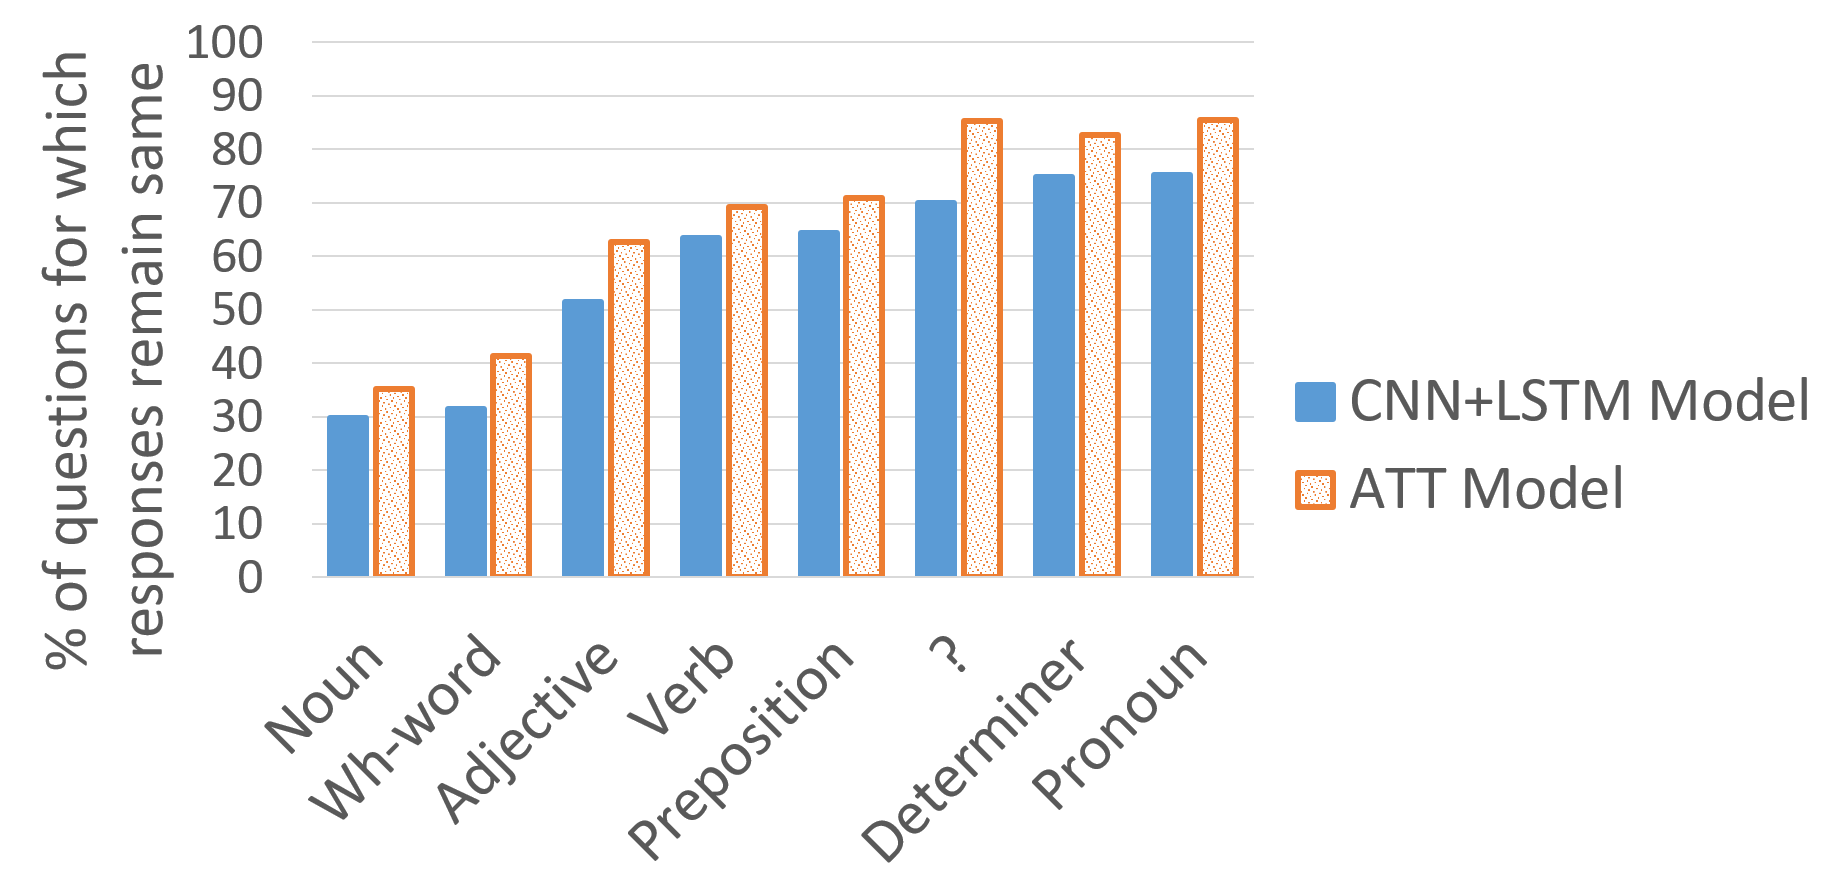
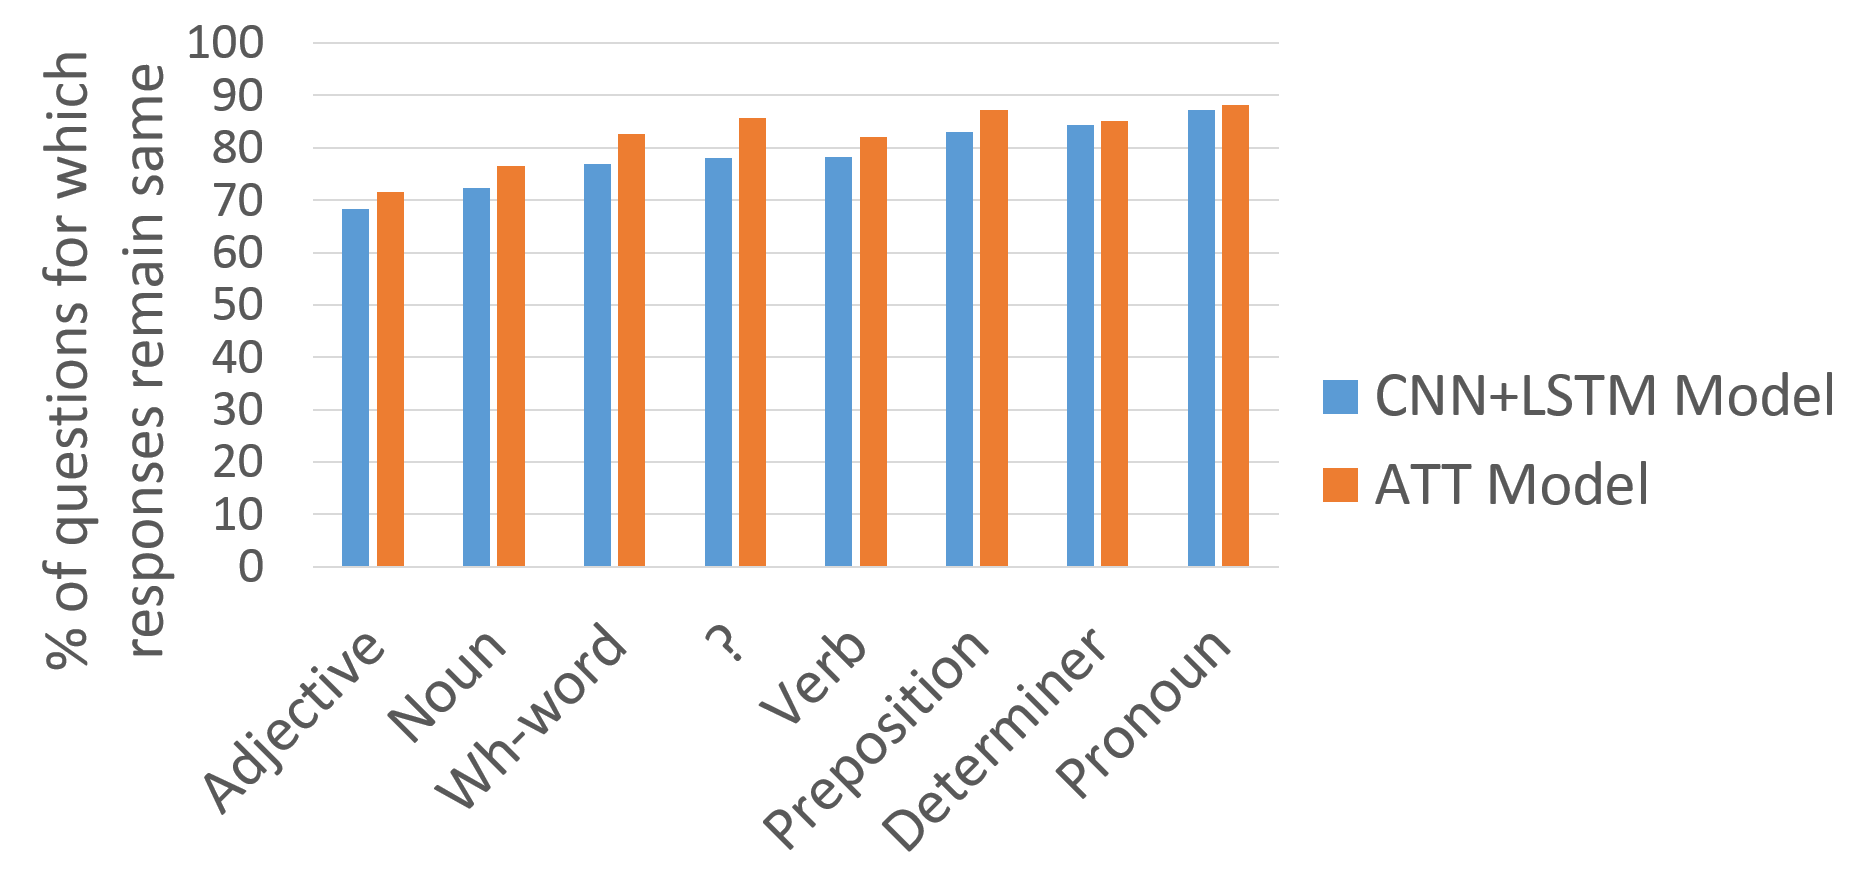
We also analyze the change in responses of the model’s predictions (see Fig. 4), when words of a particular part-of-the-speech (POS) tag are dropped from the question. The experimental results indicate that wh-words effect the model’s decisions the most (most of the responses get changed on dropping these words from the question), and that pronouns effect the model’s decisions the least.
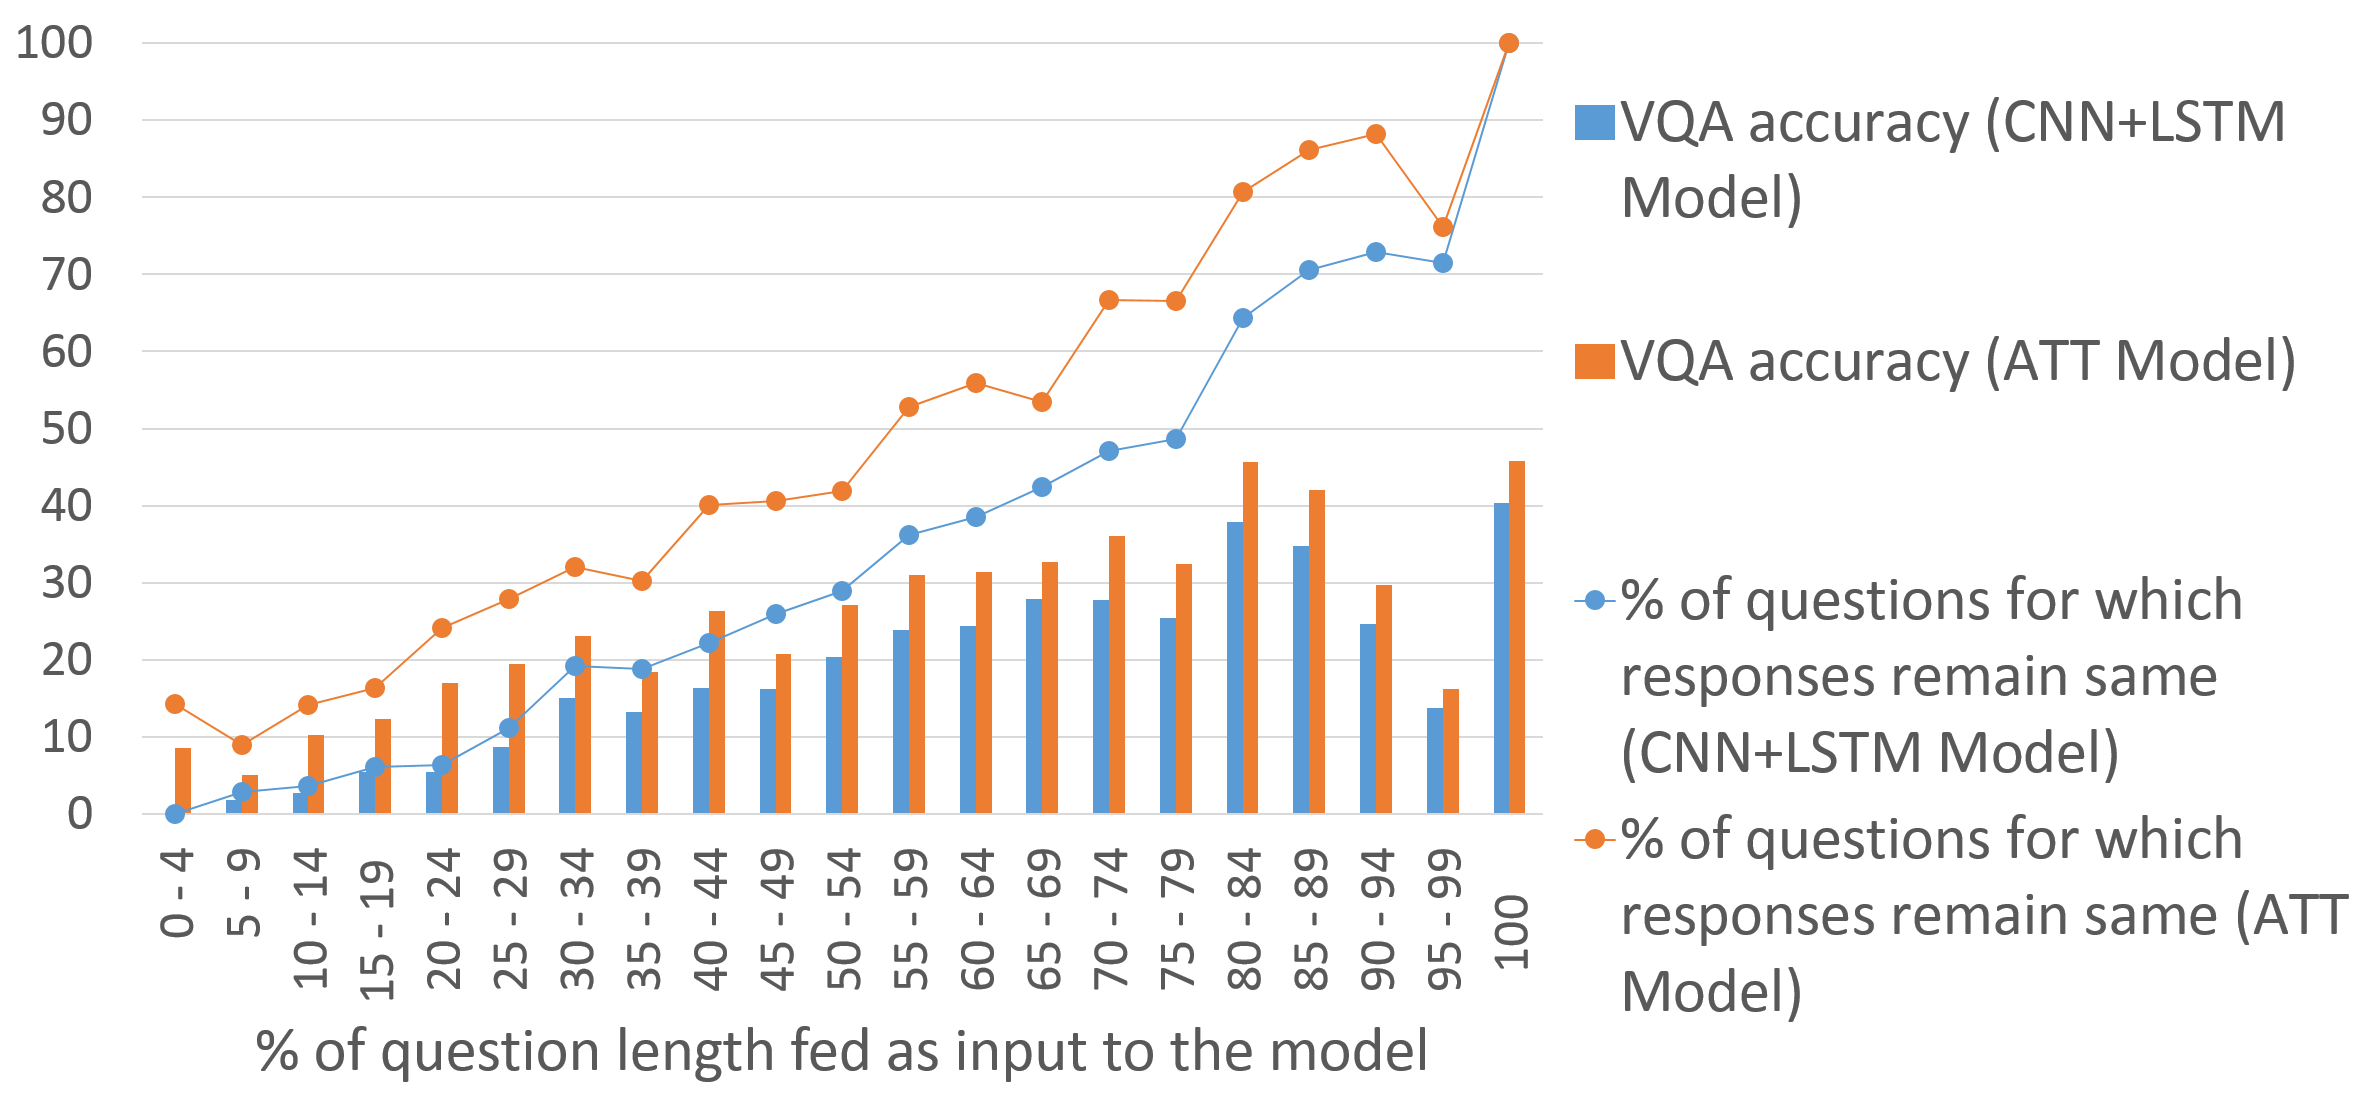
3.3 Complete image understanding
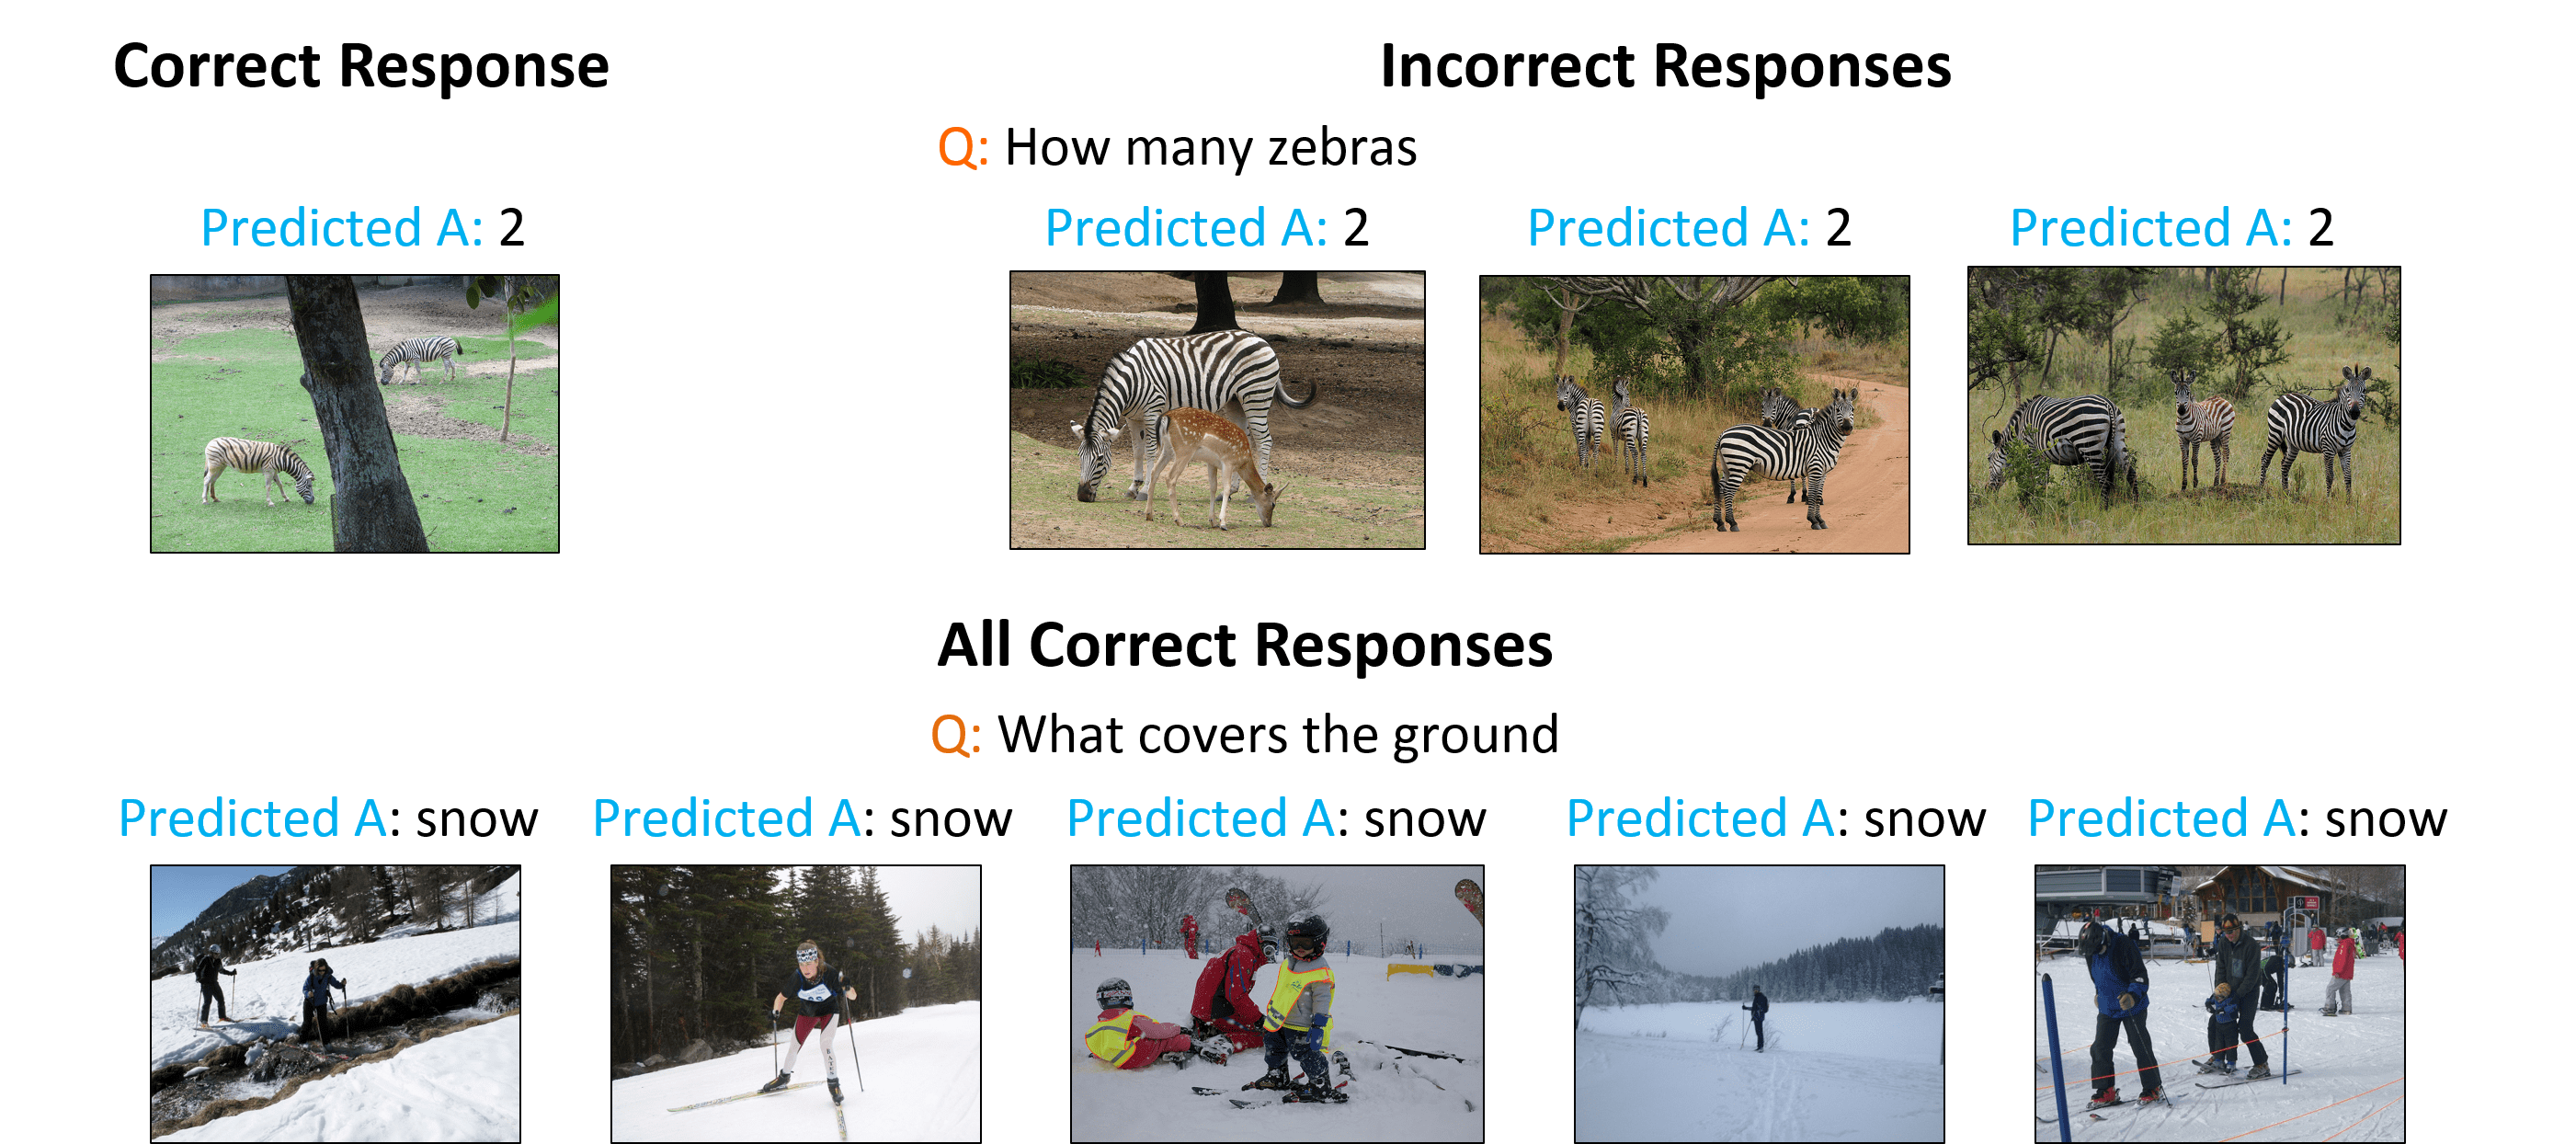
Does a VQA model really ‘look’ at the image? To analyze this, we compute the percentage of the time (say ) the response does not change across images (e.g.,, answer for all images is “2”) for a given question (e.g., “How many zebras?”) and plot histogram of across questions (see Fig. 5). We do this analysis for questions occurring for atleast 25 images in the VQA validation set, resulting in total 263 questions. The cumulative plot indicates that for 56% questions, the CNN+LSTM model outputs the same answer for at least half the images. This is fairly high, suggesting that the model is picking the same answer no matter what the image is. Promisingly, the ATT and MCB models (that do not work with a holistic entire-image representation and purportedly pay attention to specific spatial regions in an image) produce the same response for at least half the images for fewer questions (42% for the ATT model, 40% for the MCB model).
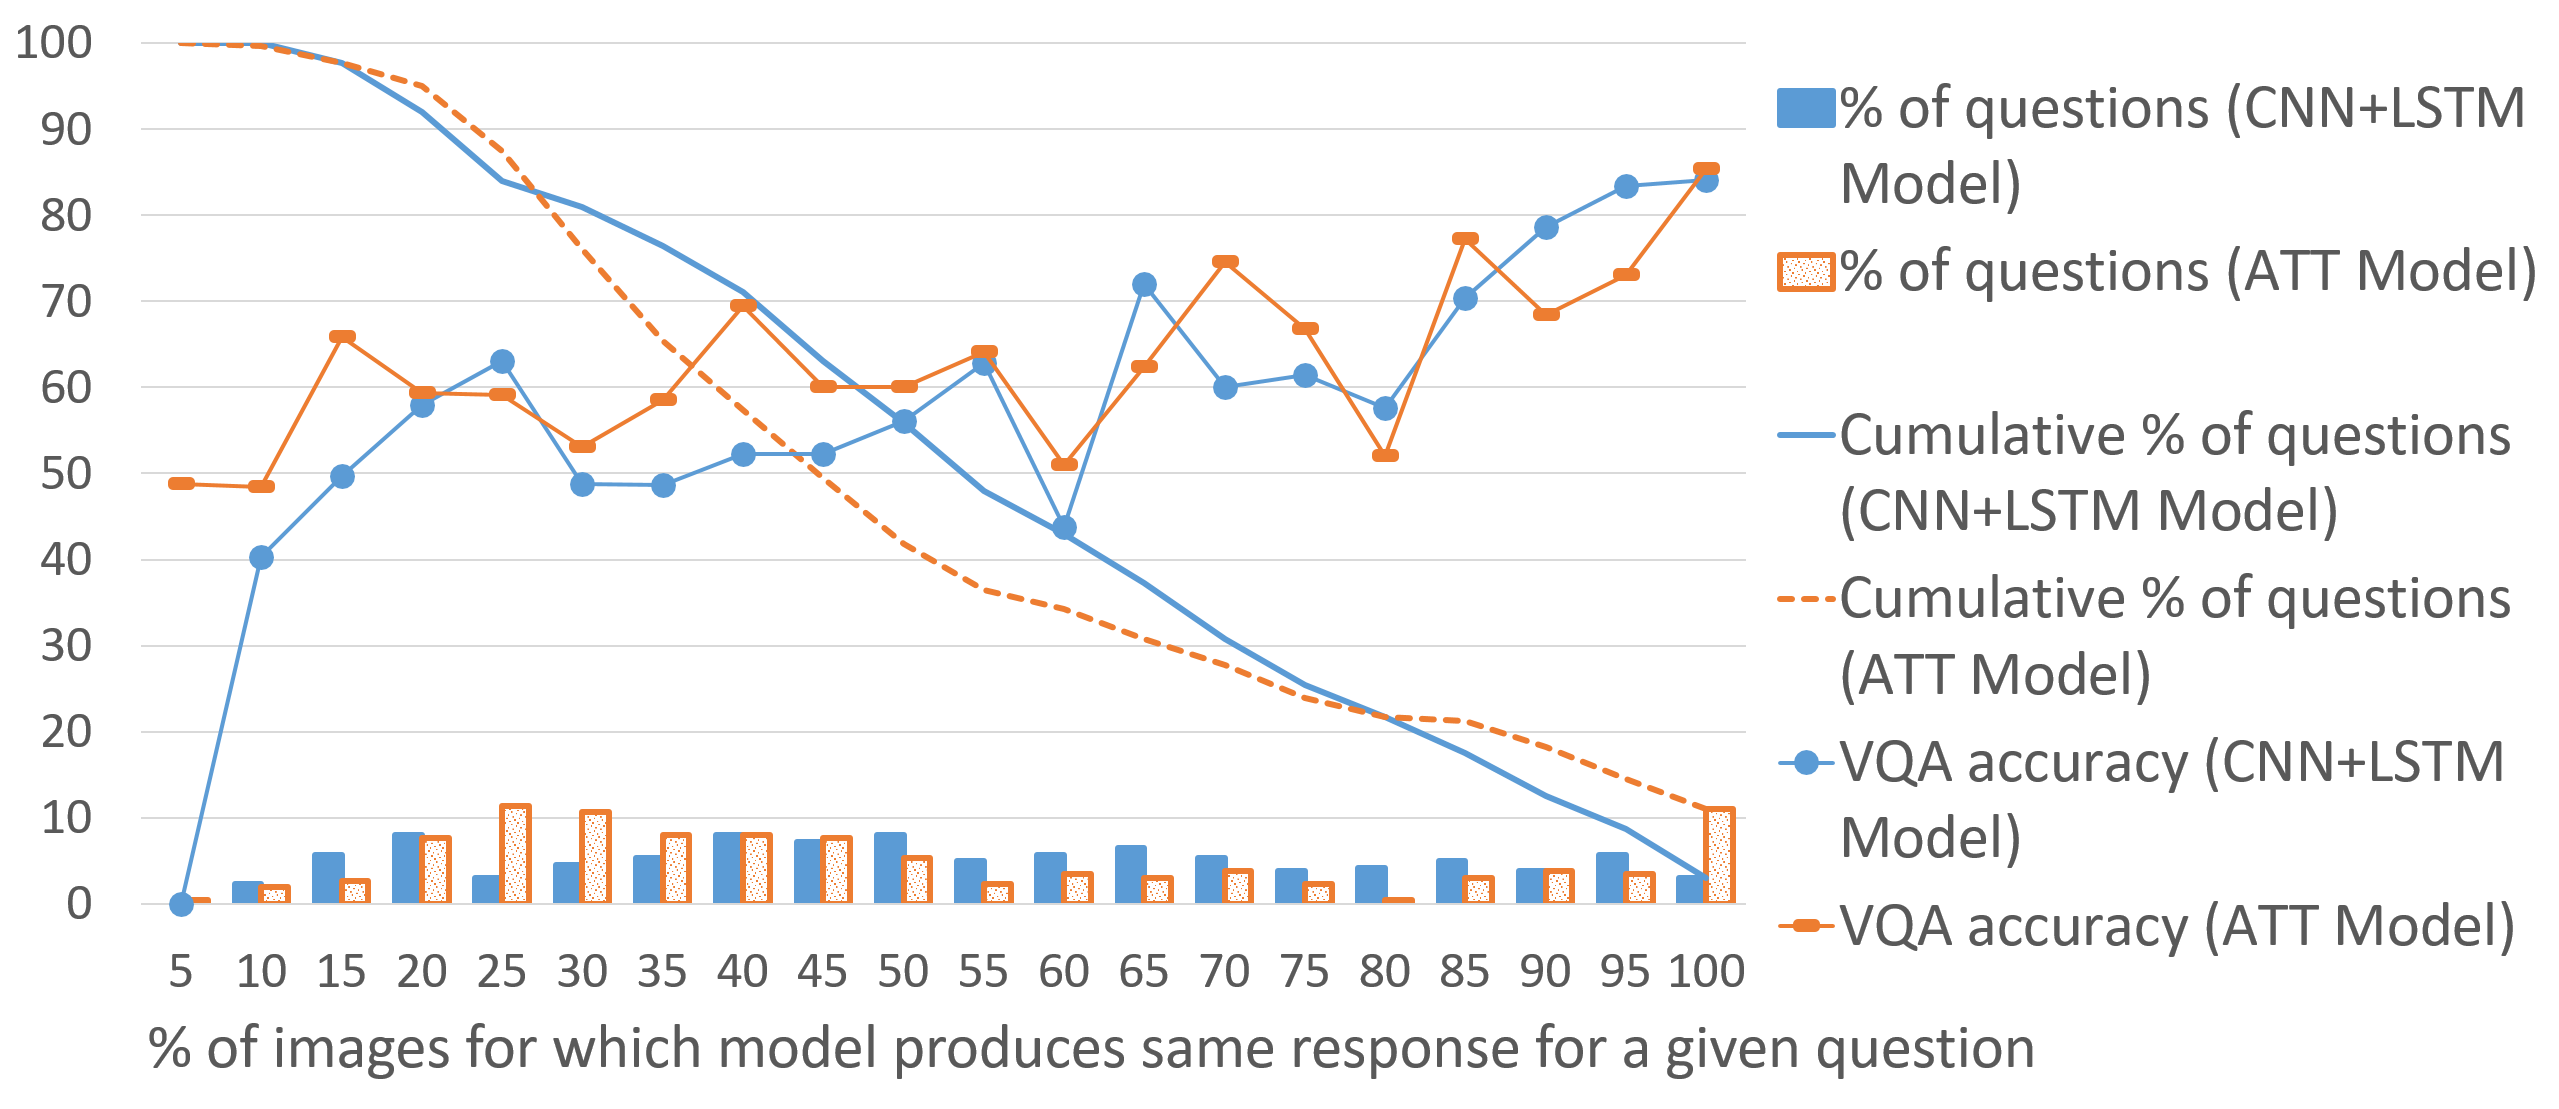
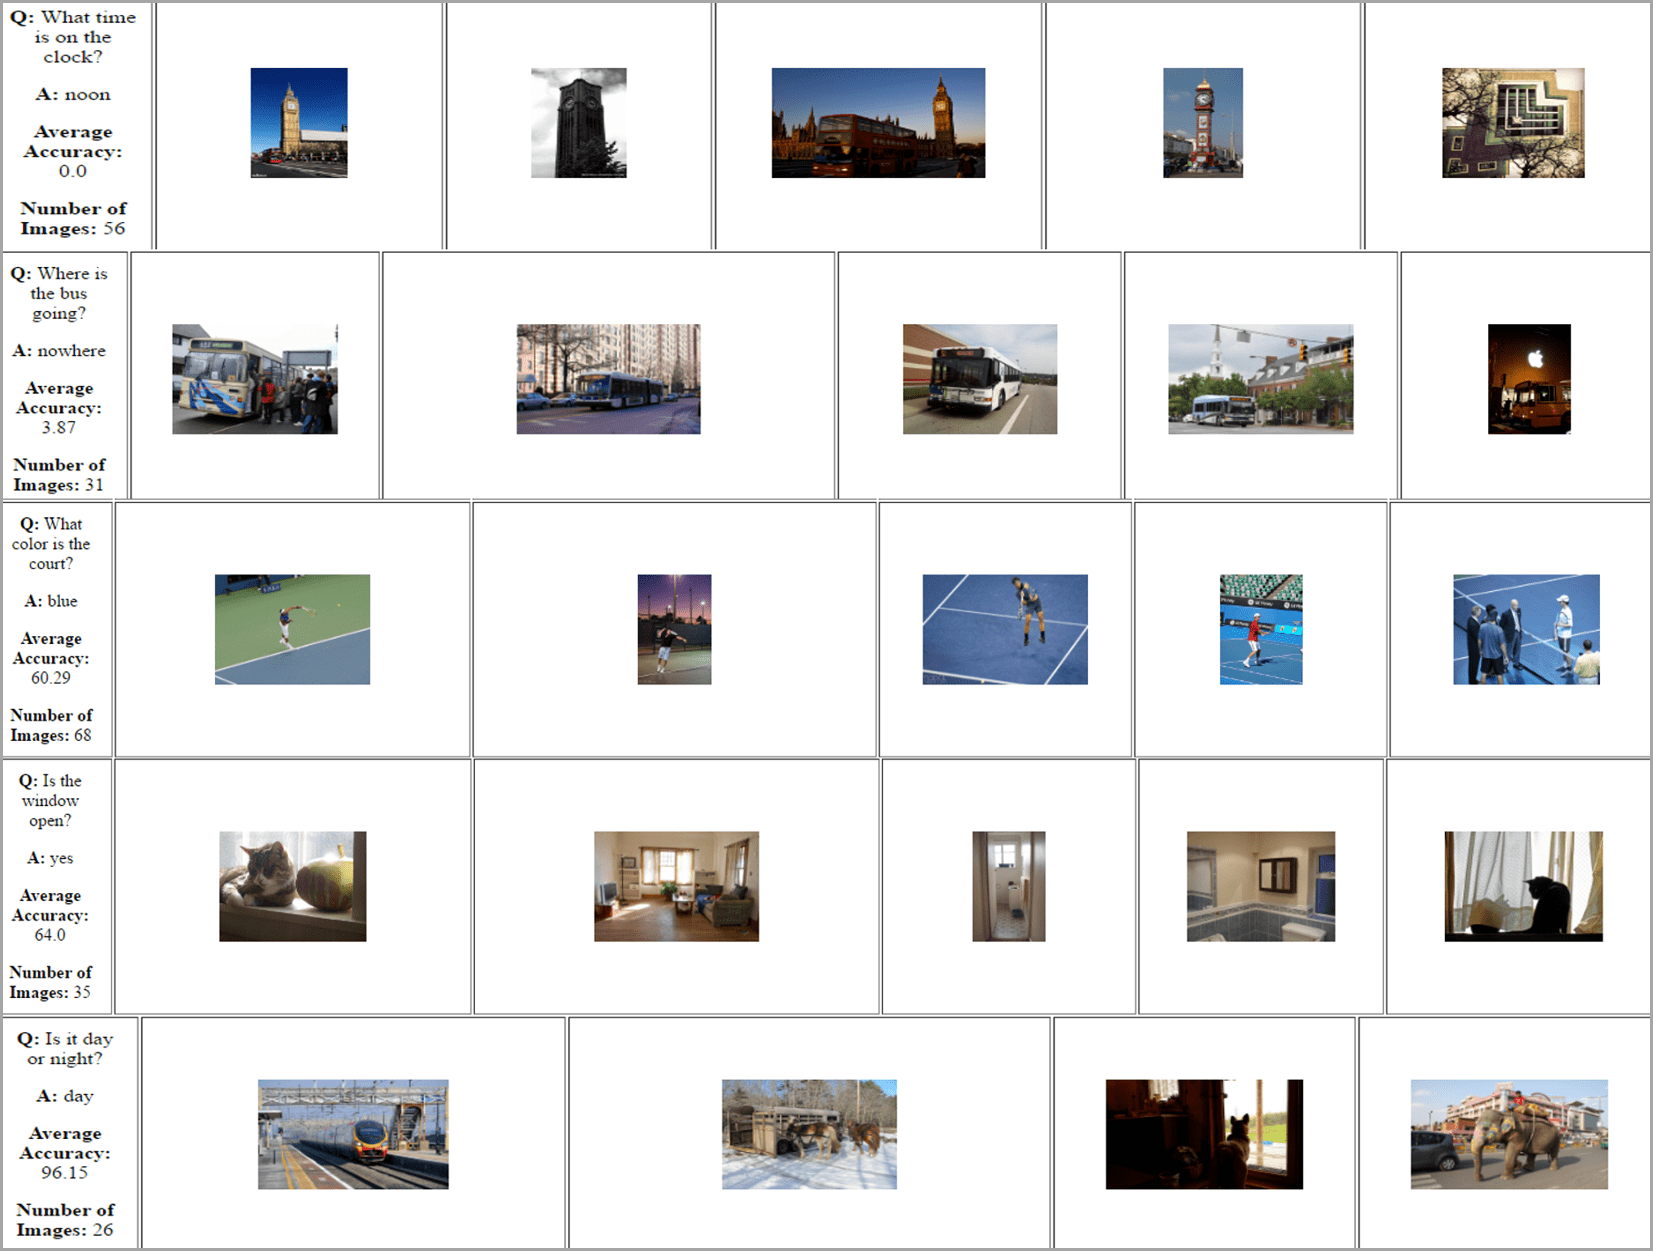
Interestingly, the average accuracy (see the VQA accuracy plots in Fig. 5) for questions for which the models produce same response for 50% and 55% of the images is 56% for the CNN+LSTM model (60% for the ATT model, 73% for the MCB model) which is more than the respective average accuracy on the entire VQA validation set (54.13% for the CNN+LSTM model, 57.02% for the ATT model, 60.36% for the MCB model). Thus, producing the same response across images seems to be statistically favorable. Fig. 6 shows examples where the CNN+LSTM model predicts the same response across images for a given question. The first row shows examples where the model makes errors on several images by predicting the same answer for all images. The second row shows examples where the model is always correct even if it predicts the same answer across images. This is so because questions such as “What covers the ground?” are asked for an image in the VQA dataset only when ground is covered with snow (because subjects were looking at the image while asking questions about it). Thus, this analysis exposes label biases in the dataset. Label biases (in particular, for “yes/no” questions) have also been reported in [Zhang et al., 2016].
4 Conclusion
We develop novel techniques to characterize the behavior of VQA models, as a first step towards understanding these models, meaningfully comparing the strengths and weaknesses of different models, developing insights into their failure modes, and identifying the most fruitful directions for progress. Our behavior analysis reveals that despite recent progress, today’s VQA models are “myopic” (tend to fail on sufficiently novel instances), often “jump to conclusions” (converge on a predicted answer after ‘listening’ to just half the question), and are “stubborn” (do not change their answers across images), with attention based models being less “stubborn” than non-attention based models.
As a final thought, we note that the somewhat pathological behaviors exposed in the paper are in some sense “correct” given the model architectures and the dataset being trained on. Ignoring optimization error, the maximum-likelihood training objective is clearly intended to capture statistics of the dataset. Our motive is simply to better understand current generation models via their behaviors, and use these observations to guide future choices – do we need novel model classes? or dataset with different biases? etc. Finally, it should be clear that our use of anthropomorphic adjectives such as “stubborn”, “myopic” etc. is purely for pedagogical reasons – to easily communicate our observations to our readers. No claims are being made about today’s VQA models being human-like.
Acknowledgements. We would like to thank the EMNLP reviewers for their valuable feedback and Yash Goyal for sharing his code. This work was supported in part by: NSF CAREER awards, Army Research Office YIP awards, ICTAS Junior Faculty awards, Google Faculty Research awards, awarded to both DB and DP, ONR grant N00014-14-1-0679, AWS in Education Research grant, NVIDIA GPU donation, awarded to DB, Paul G. Allen Family Foundation Allen Distinguished Investigator award, ONR YIP and Alfred P. Sloan Fellowship, awarded to DP. The views and conclusions contained herein are those of the authors and should not be interpreted as necessarily representing the official policies or endorsements, either expressed or implied, of the U.S. Government or any sponsor.
Appendix Overview
In the appendix, we provide:
-
I
- Behavioral analysis for question-only and image-only VQA models (Appendix I).
-
II
- Scatter plot of average distance of test instances from nearest neighbor training instances w.r.t. VQA accuracy (Appendix II).
-
III
- Additional qualitative examples for “generalization to novel test instances” (Appendix III).
-
IV
- The analyses on “complete question understanding” for different question types (Appendix IV).
-
V
- Additional qualitative examples for “complete question understanding” (Appendix V).
-
VI
- The analyses on “complete image understanding” for different question types (Appendix VI).
-
VII
- Additional qualitative examples for “complete image understanding” (Appendix VII).
Appendix I: Behavioral analysis for question-only and image-only VQA models
We evaluated the performance of both CNN+LSTM and ATT models by just feeding in the question (and mean image embedding) and by just feeding in the image (and mean question embedding). We computed the percentage of responses that change on feeding the question as well, compared to only feeding in the image and the percentage of responses that change on feeding the image as well, compared to only feeding in the question. We found that that the responses changed much more (about 40% more) on addition of the question than they did on addition of the image. So this suggests that the VQA models are heavily driven by question rather than the image.
Appendix II: Scatter plot of average distance of test instances from nearest neighbor training instances w.r.t. VQA accuracy
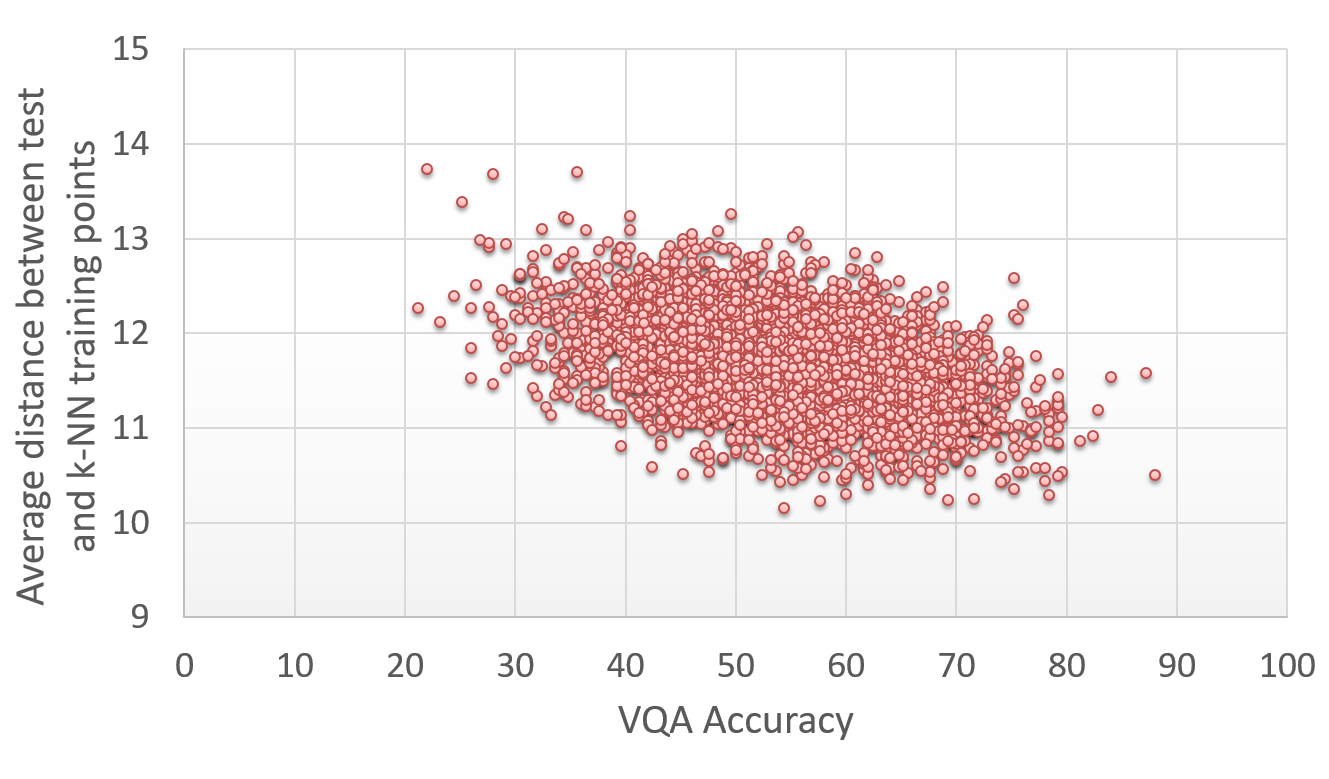
Fig. 7 shows the variation of accuracy of test point w.r.t their average distance from k-NN training points for the CNN+LSTM model. Each point in the plot represents average statistics (accuracy and average distance) for a random subset of 25 test points. We can see that for the test points with low accuracy, the average distance is higher compared to test points with high accuracy. The correlation between accuracy and average distance is significant (-0.41 at .777 leads to highest correlation)
Appendix III: Additional qualitative examples for “generalization to novel test instances”
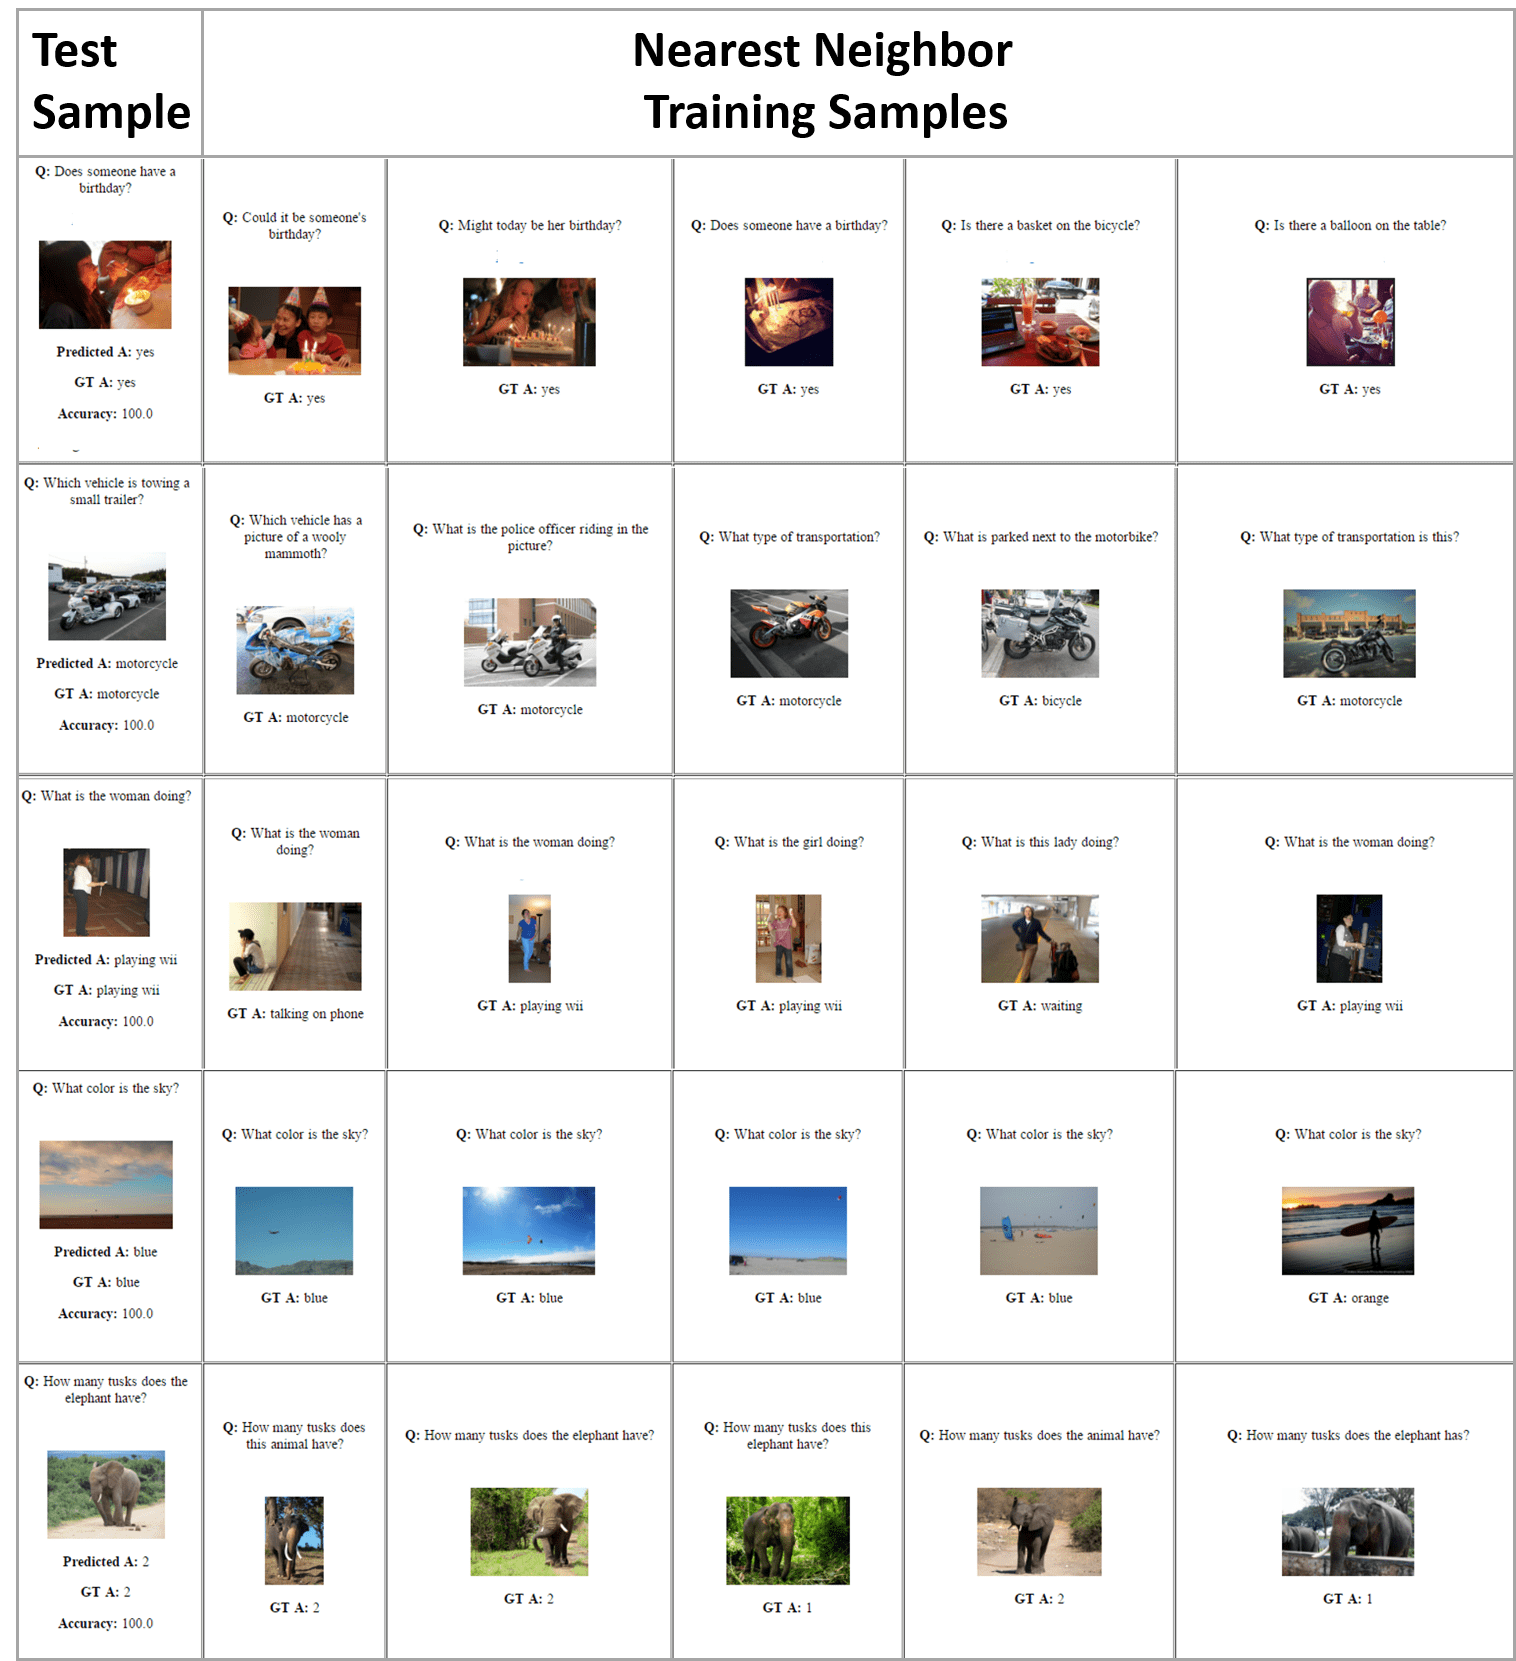
Fig. 8 shows test QI pairs for which the CNN+LSTM model produces the correct response and their nearest neighbor QI pairs from training set. It can be seen that the nearest neighbor QI pairs from the training set are similar to the test QI pair. In addition, the GT labels in the training set are similar to the test GT label.
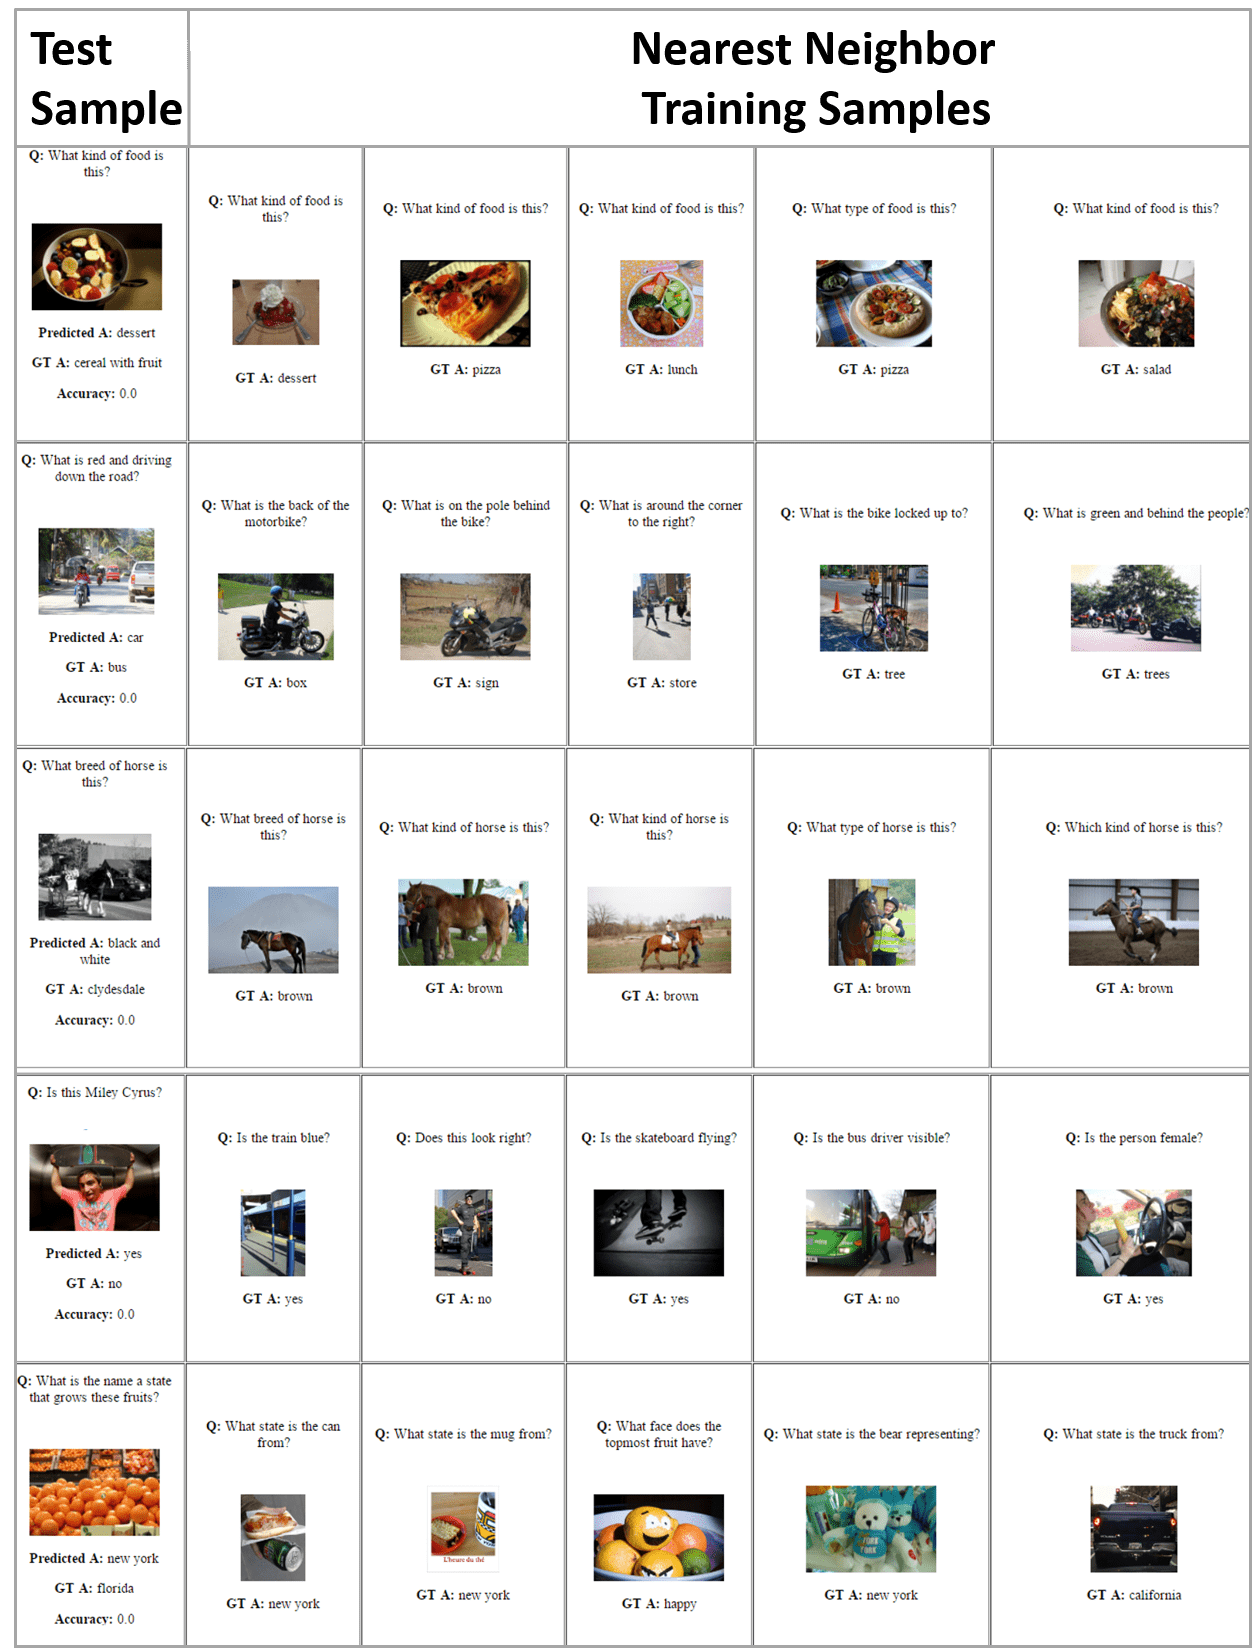
Fig. 9 shows test QI pairs for which the CNN+LSTM model produces incorrect response and their nearest neighbor QI pairs from training set. Some of the mistakes are probably because the test QI pair does not have similar QI pairs in the training set (rows 2, 4 and 5) while other mistakes are probably because the GT labels in the training set are not similar to the GT test label (rows 1 and 3).
Appendix IV: Analyses on “complete question understanding” for different question types
We show the breakdown of our analyses from the main paper – (i) whether the model ‘listens’ to the entire question; and (ii) which POS tags matter the most – over the three major categories of questions – “yes/no”, “number” and “other” as categorized in [Antol et al., 2015]. “yes/no” are questions whose answers are either “yes” or “no”, “number” are questions whose answers are numbers (e.g., “Q: How many zebras are there?”, “A: 2”), “other” are rest of the questions.
For “yes/no” questions, the ATT model seems particularly ‘jumpy’ – converging on a predicted answer listening to only the first few words of the question (see Fig. 10). Surprisingly, the accuracy is also as much as the final accuracy (after listening to entire question) when making predictions based on first few words of the question. In contrast, the CNN+LSTM model converges on a predicted answer later, after listening to atleast 35% of the question, achieving as much as the final accuracy after convergence. For “number” and “other” questions, both ATT and CNN+LSTM model show similar trends (see Fig. 11 for “number” and Fig. 12 for “other”).
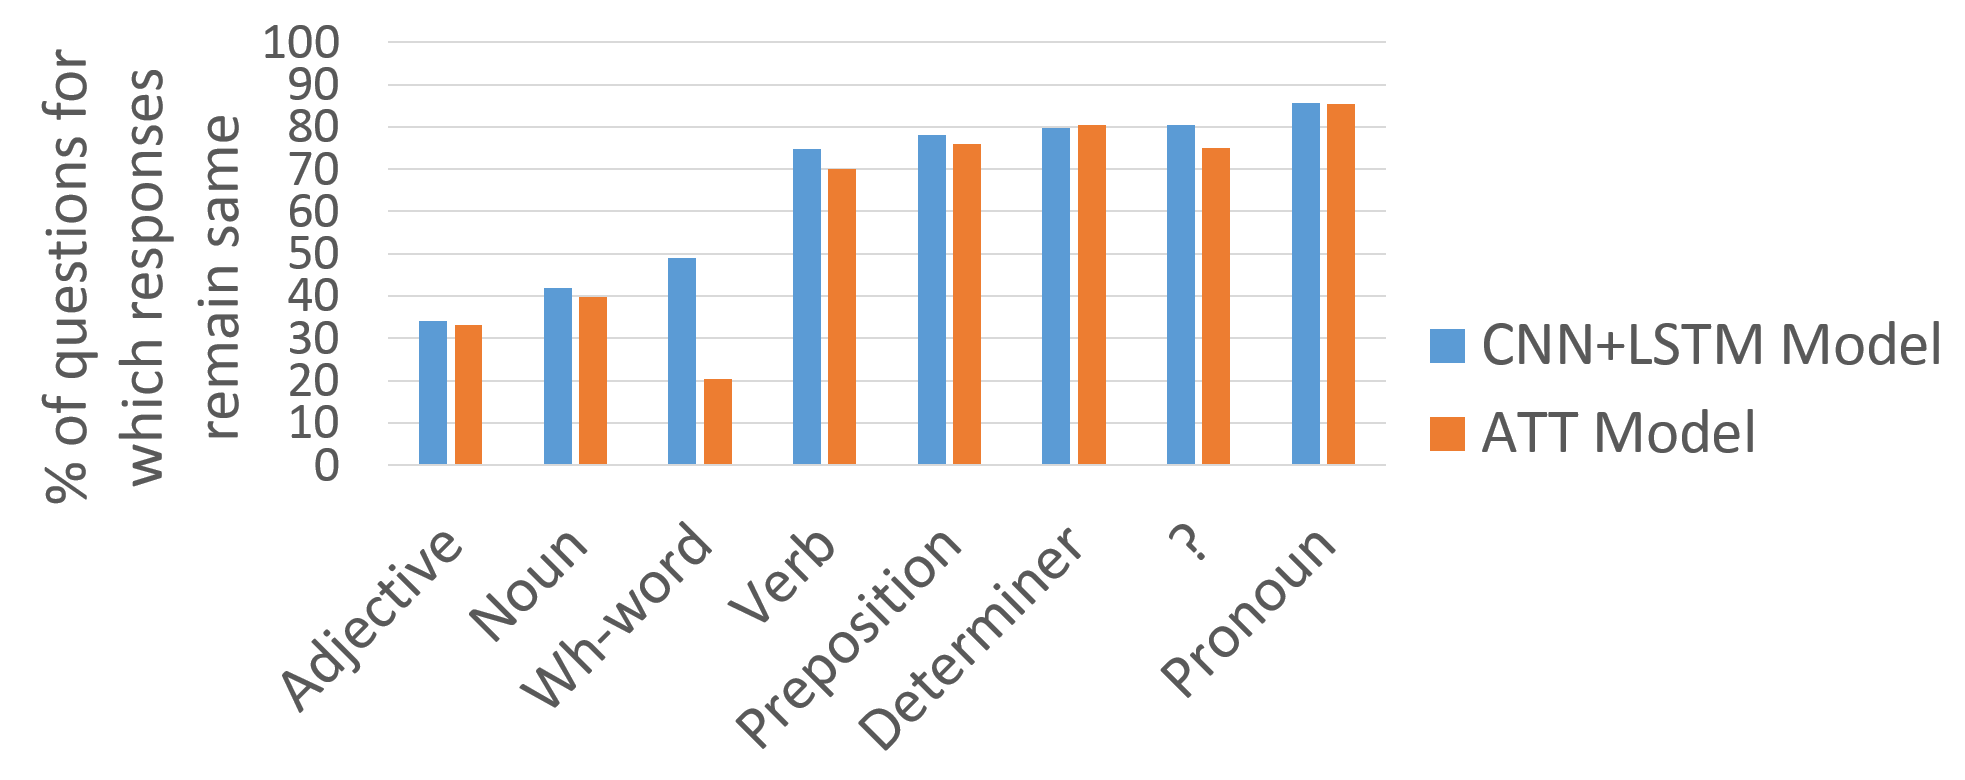
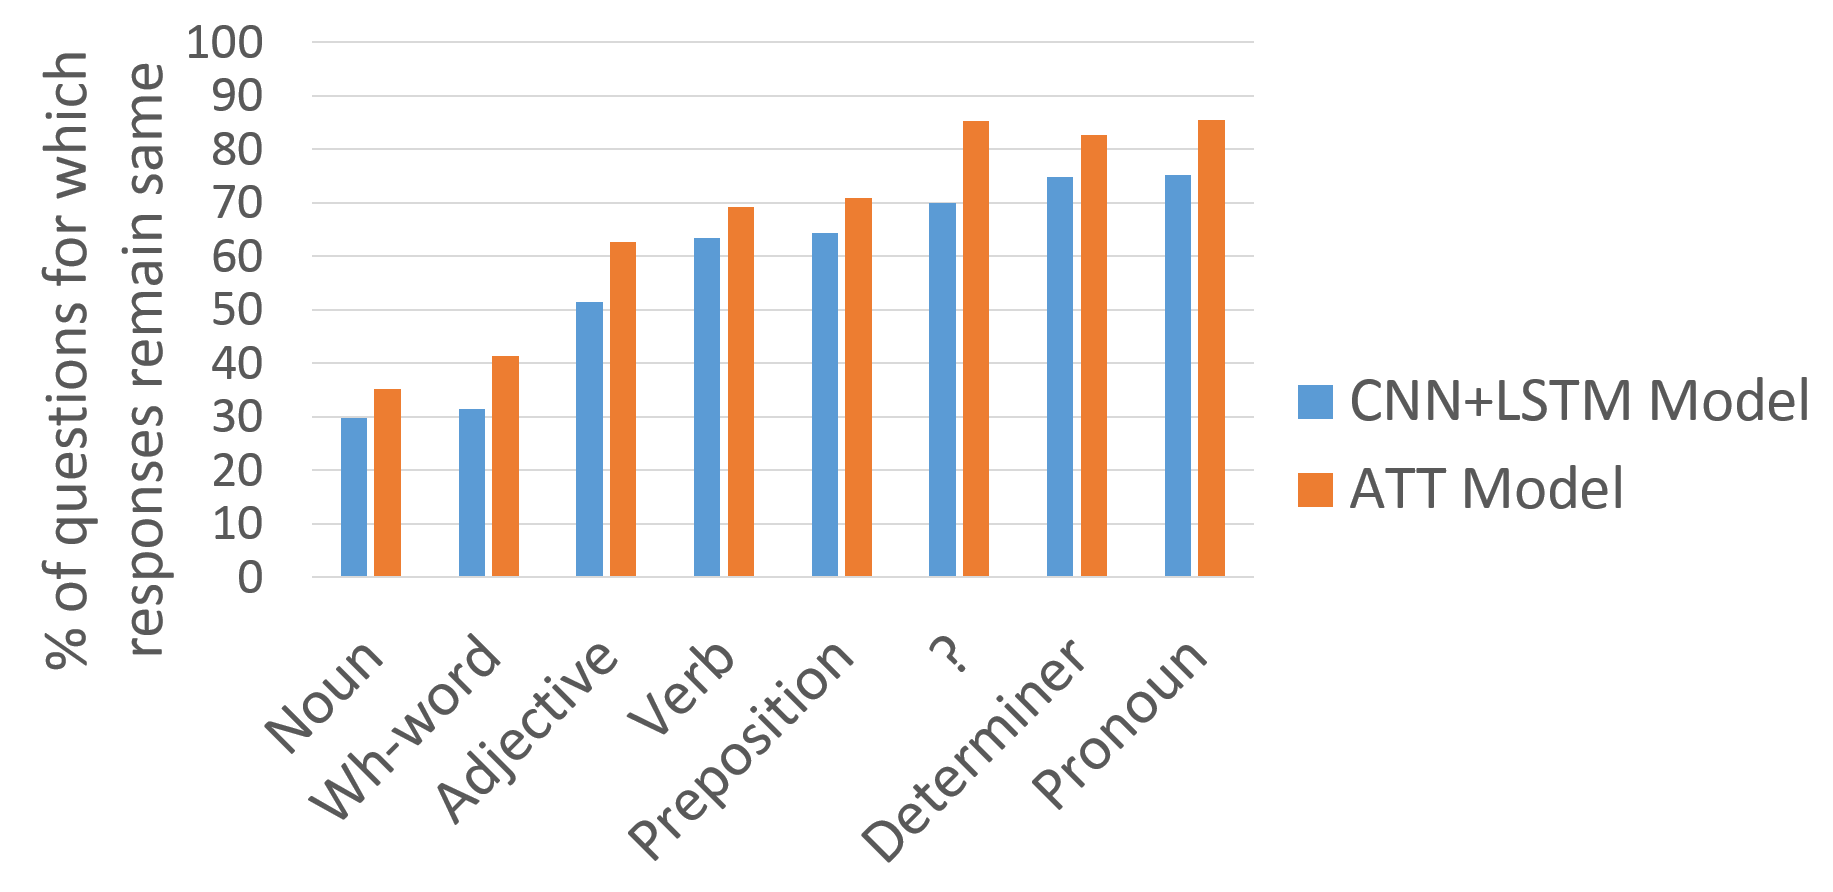
It is interesting to note that VQA models are most sensitive to adjectives for “yes/no” questions (compared to wh-words for all questions) (see Fig. 13). This is probably because often the “yes/no” questions are about attributes of objects (e.g., “Is the cup empty?”). For “number” questions, the CNN+LSTM model is most sensitive to adjectives whereas the ATT model is most sensitive to wh-words (see Fig. 14). For “other” questions, both the models are most sensitive to “nouns” (see Fig. 15).
Appendix V: Additional qualitative examples for “complete question understanding”
Fig. 16 shows examples where the CNN+LSTM model converges on a predicted answer without listening to the entire question. On doing so, the model gets the answer correct for some QI pairs (first three rows) and incorrect for others (last two rows).
Appendix VI: Analyses on “complete image understanding” for different question types
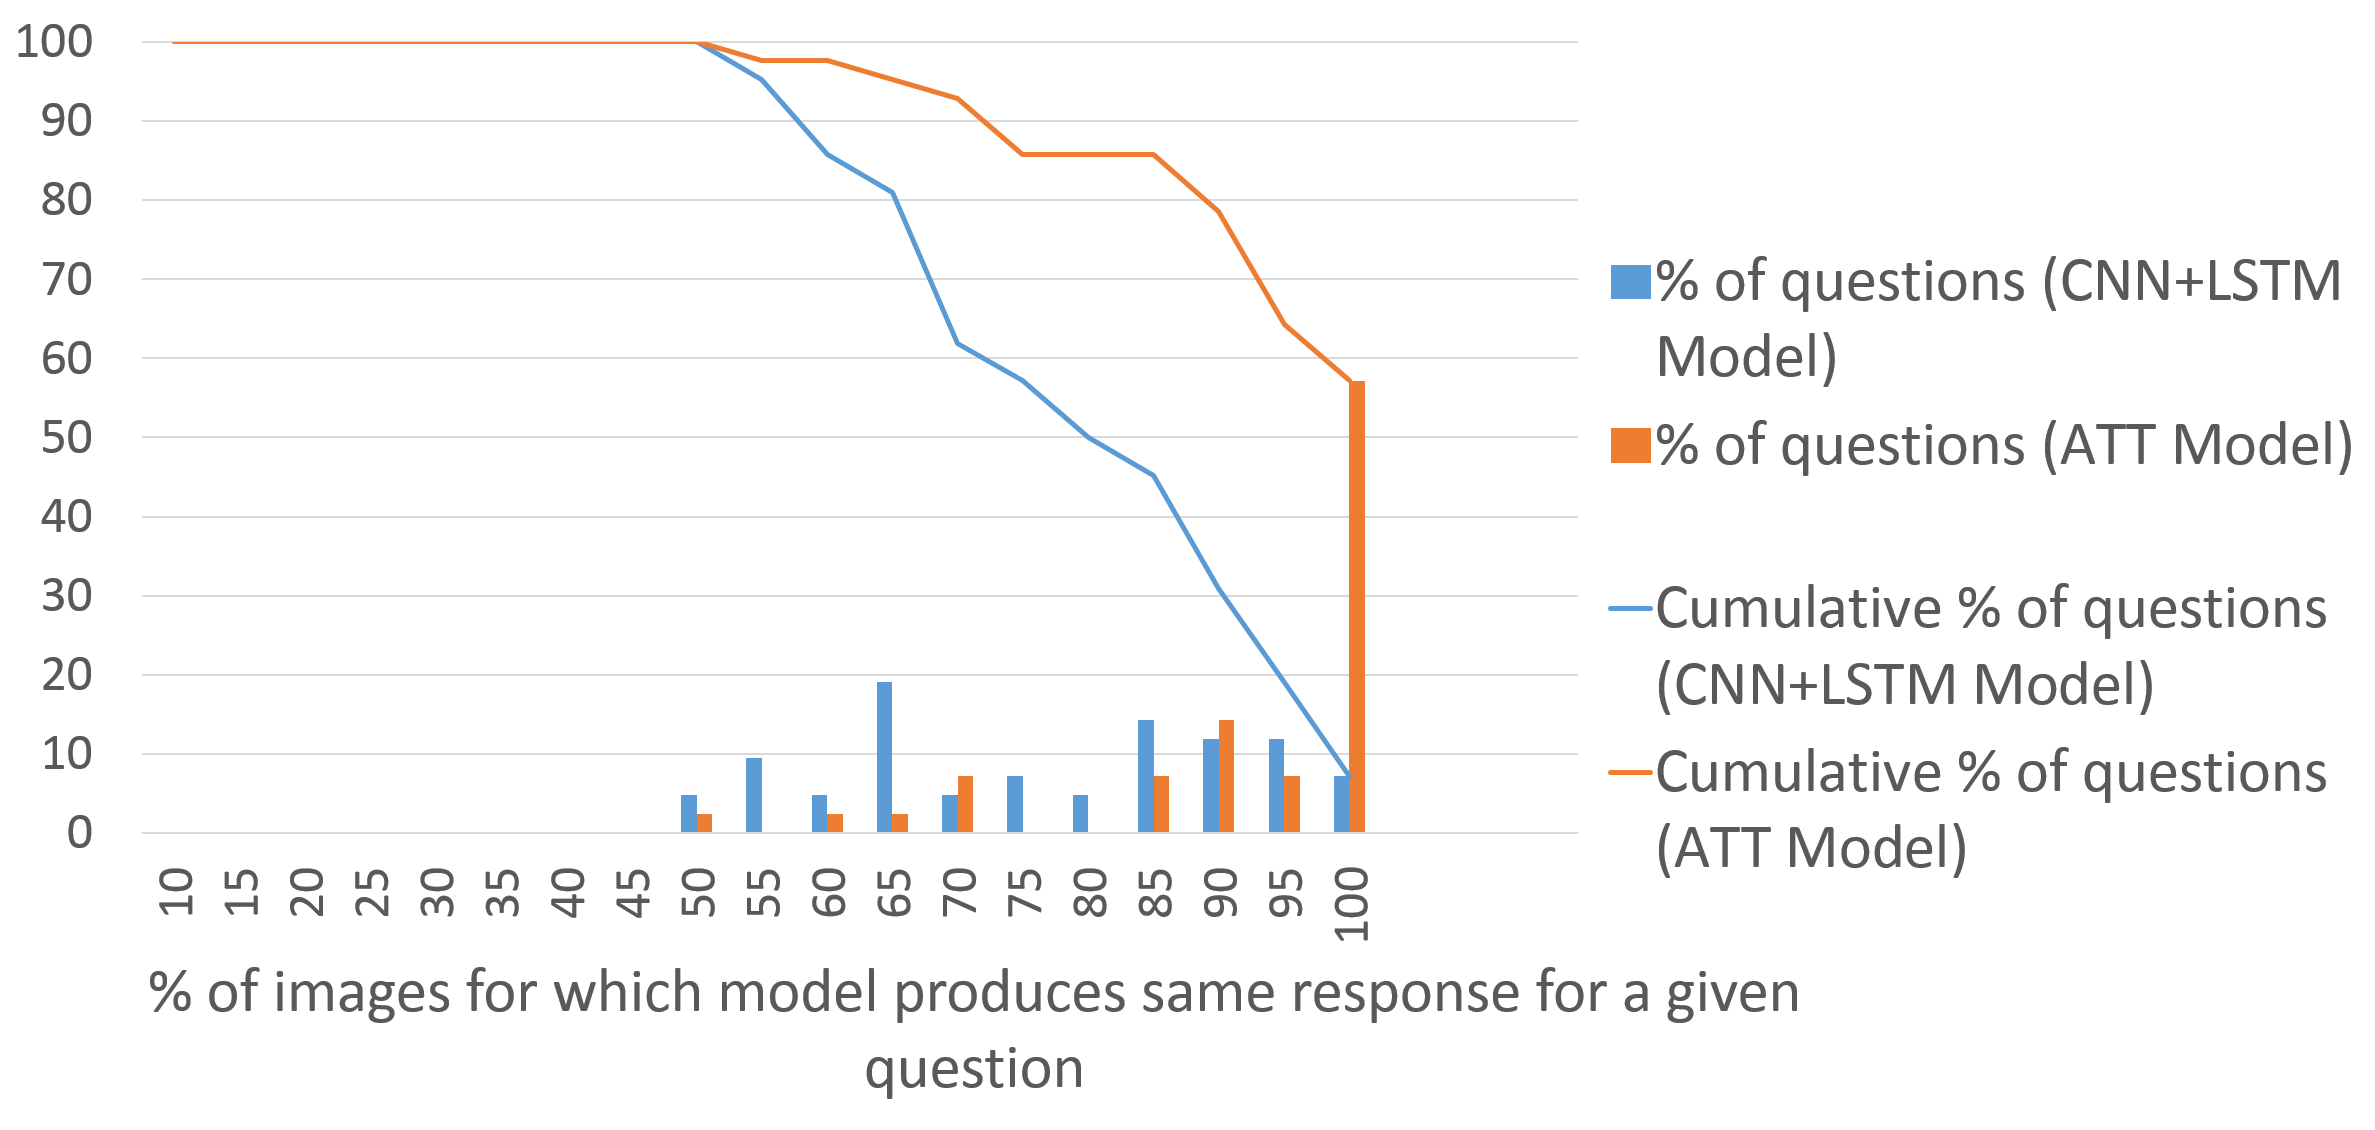
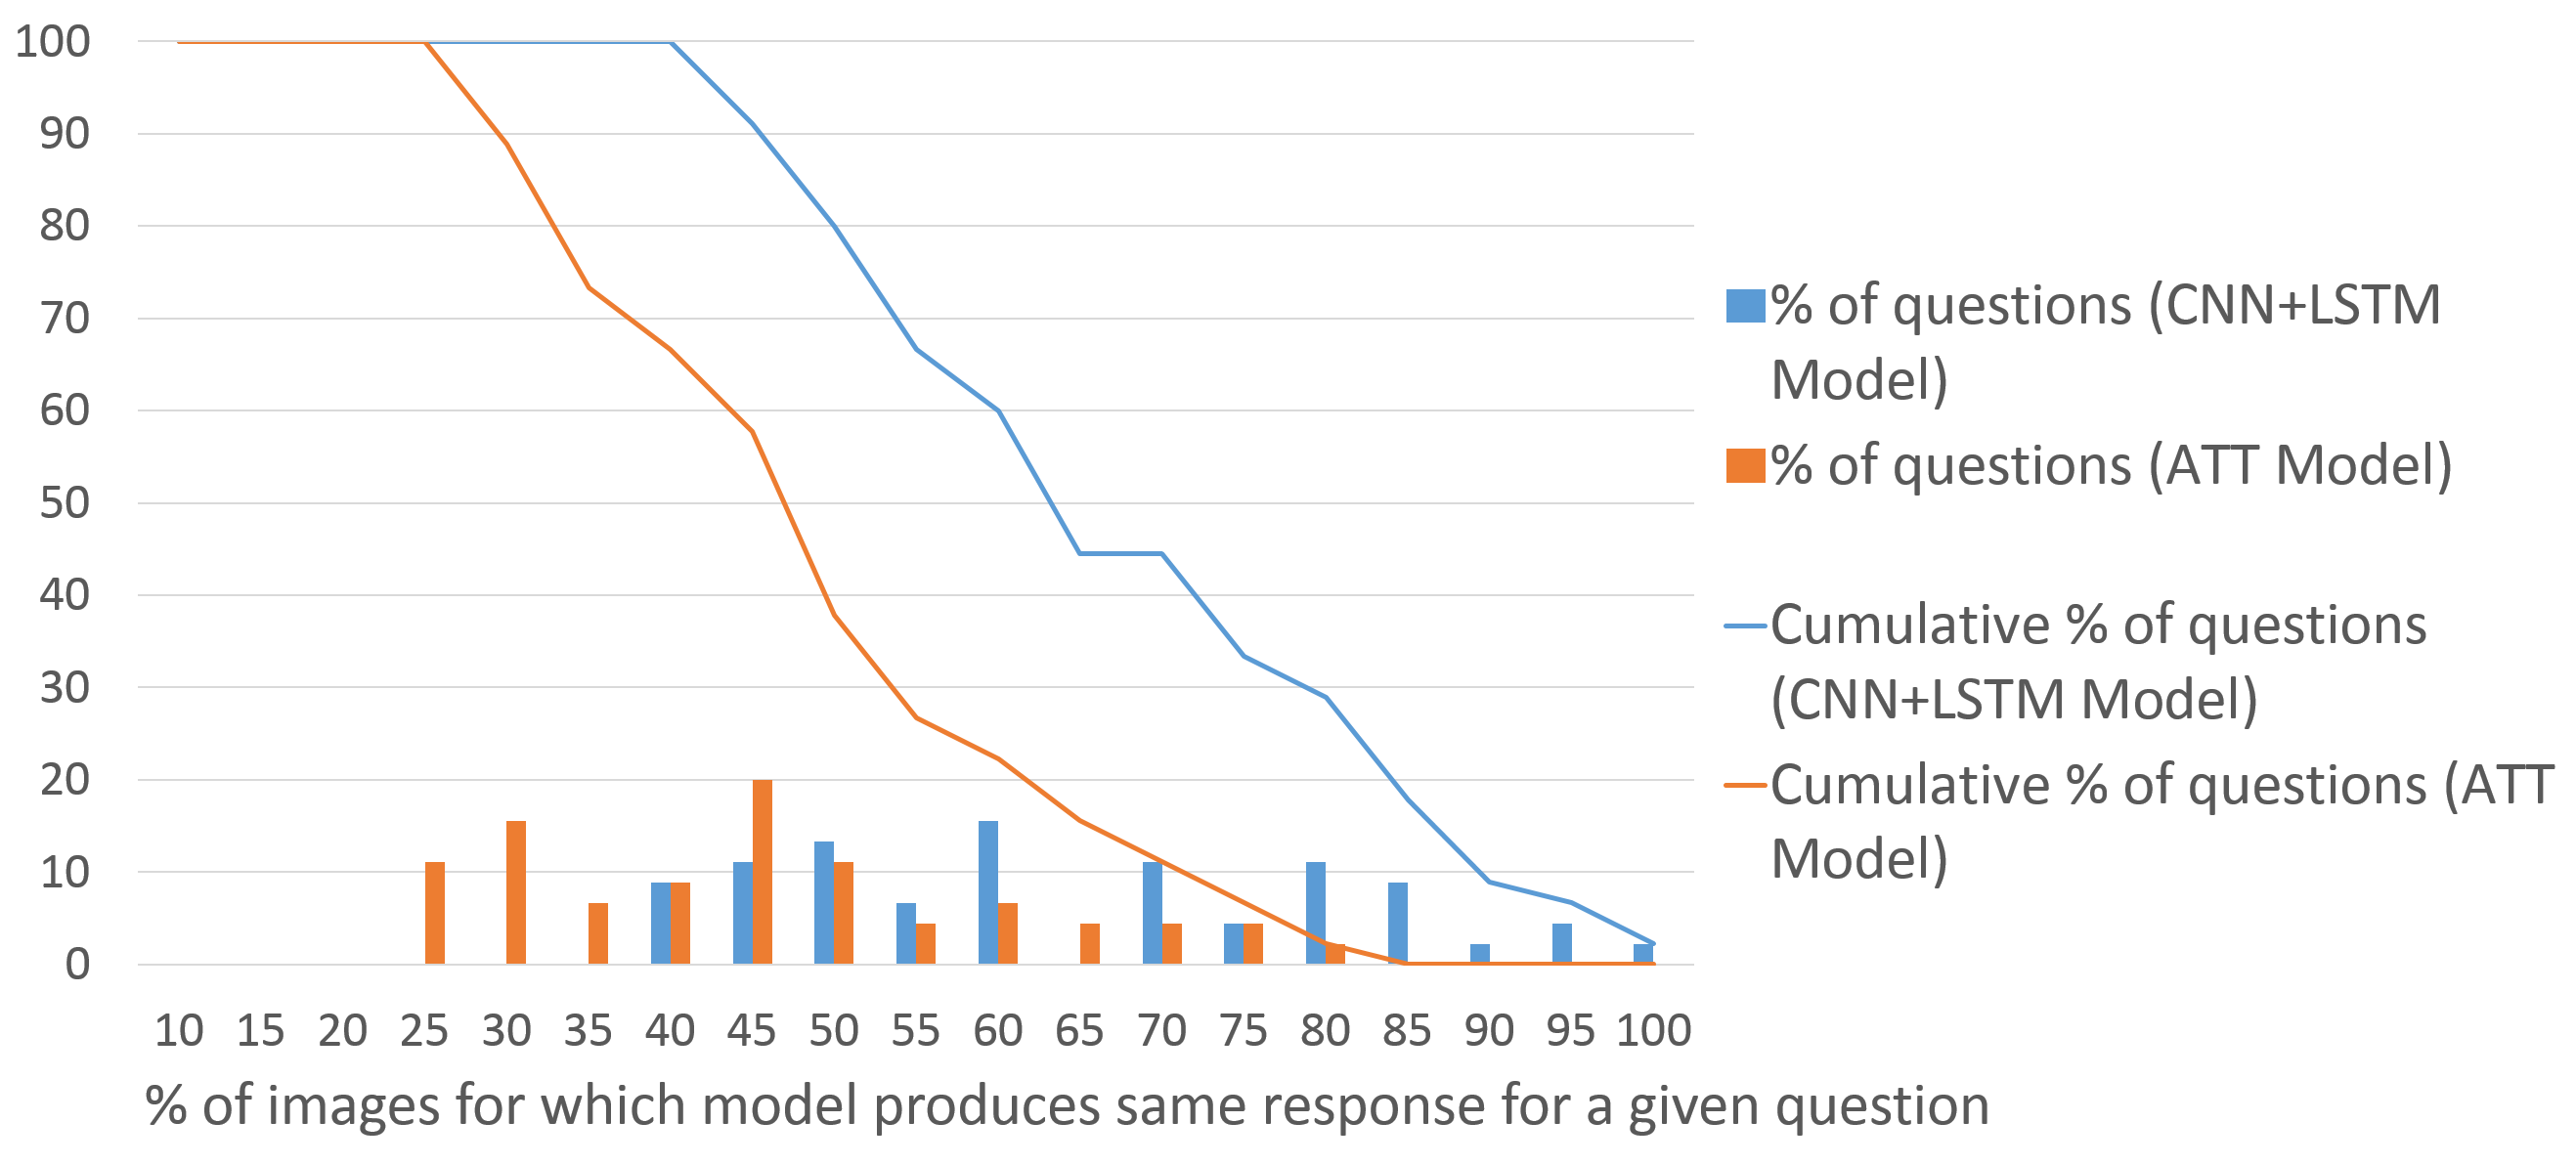

Fig. 17, Fig. 18 and Fig. 19 show the breakdown of percentage of questions for which the model produces same answer across images for “yes/no”, “number” and “other” respectively. The ATT model seems to be more “stubborn” (does not change its answers across images) for “yes/no” questions compared to the CNN+LSTM model, and less “stubborn” for “number” questions compared to the CNN+LSTM model.
Appendix VII: Additional qualitative examples for “complete image understanding”
Fig. 20 shows examples where the CNN+LSTM model produces the same answer for atleast half the images for a given question and the accuracy achieved by the model for such QI pairs.
References
- [Andreas et al., 2016a] Jacob Andreas, Marcus Rohrbach, Trevor Darrell, and Dan Klein. 2016a. Deep compositional question answering with neural module networks. In CVPR.
- [Andreas et al., 2016b] Jacob Andreas, Marcus Rohrbach, Trevor Darrell, and Dan Klein. 2016b. Learning to compose neural networks for question answering. In NAACL.
- [Antol et al., 2015] Stanislaw Antol, Aishwarya Agrawal, Jiasen Lu, Margaret Mitchell, Dhruv Batra, C. Lawrence Zitnick, and Devi Parikh. 2015. Vqa: Visual question answering. In ICCV.
- [Chen et al., 2015] Kan Chen, Jiang Wang, Liang-Chieh Chen, Haoyuan Gao, Wei Xu, and Ram Nevatia. 2015. ABC-CNN: an attention based convolutional neural network for visual question answering. CoRR, abs/1511.05960.
- [Fukui et al., 2016] Akira Fukui, Dong Huk Park, Daylen Yang, Anna Rohrbach, Trevor Darrell, and Marcus Rohrbach. 2016. Multimodal compact bilinear pooling for visual question answering and visual grounding. In EMNLP.
- [Geman et al., 2014] Donald Geman, Stuart Geman, Neil Hallonquist, and Laurent Younes. 2014. A Visual Turing Test for Computer Vision Systems. In PNAS.
- [Hoiem et al., 2012] Derek Hoiem, Yodsawalai Chodpathumwan, and Qieyun Dai. 2012. Diagnosing error in object detectors. In ECCV.
- [Ilievski et al., 2016] Ilija Ilievski, Shuicheng Yan, and Jiashi Feng. 2016. A focused dynamic attention model for visual question answering. CoRR, abs/1604.01485.
- [Jiang et al., 2015] Aiwen Jiang, Fang Wang, Fatih Porikli, and Yi Li. 2015. Compositional memory for visual question answering. CoRR, abs/1511.05676.
- [Kafle and Kanan, 2016] Kushal Kafle and Christopher Kanan. 2016. Answer-type prediction for visual question answering. In CVPR.
- [Karpathy et al., 2016] Andrej Karpathy, Justin Johnson, and Fei-Fei Li. 2016. Visualizing and understanding recurrent networks. In ICLR Workshop.
- [Kim et al., 2016] Jin-Hwa Kim, Sang-Woo Lee, Dong-Hyun Kwak, Min-Oh Heo, Jeonghee Kim, Jung-Woo Ha, and Byoung-Tak Zhang. 2016. Multimodal residual learning for visual QA. In NIPS.
- [Lu et al., 2015] Jiasen Lu, Xiao Lin, Dhruv Batra, and Devi Parikh. 2015. Deeper lstm and normalized cnn visual question answering model. https://github.com/VT-vision-lab/VQA_LSTM_CNN.
- [Lu et al., 2016] Jiasen Lu, Jianwei Yang, Dhruv Batra, and Devi Parikh. 2016. Hierarchical question-image co-attention for visual question answering. In NIPS.
- [Malinowski and Fritz, 2014] Mateusz Malinowski and Mario Fritz. 2014. A Multi-World Approach to Question Answering about Real-World Scenes based on Uncertain Input. In NIPS.
- [Mikolov et al., 2013] Tomas Mikolov, Kai Chen, Greg Corrado, and Jeffrey Dean. 2013. Efficient estimation of word representations in vector space. In ICLR.
- [Noh and Han, 2016] Hyeonwoo Noh and Bohyung Han. 2016. Training recurrent answering units with joint loss minimization for vqa. CoRR, abs/1606.03647.
- [Saito et al., 2016] Kuniaki Saito, Andrew Shin, Yoshitaka Ushiku, and Tatsuya Harada. 2016. Dualnet: Domain-invariant network for visual question answering. CoRR, abs/1606.06108.
- [Shih et al., 2016] Kevin J. Shih, Saurabh Singh, and Derek Hoiem. 2016. Where to look: Focus regions for visual question answering. In CVPR.
- [Wang et al., 2015] Peng Wang, Qi Wu, Chunhua Shen, Anton van den Hengel, and Anthony R. Dick. 2015. Explicit knowledge-based reasoning for visual question answering. CoRR, abs/1511.02570.
- [Wu et al., 2016] Qi Wu, Peng Wang, Chunhua Shen, Anton van den Hengel, and Anthony R. Dick. 2016. Ask me anything: Free-form visual question answering based on knowledge from external sources. In CVPR.
- [Xiong et al., 2016] Caiming Xiong, Stephen Merity, and Richard Socher. 2016. Dynamic memory networks for visual and textual question answering. In ICML.
- [Xu and Saenko, 2016] Huijuan Xu and Kate Saenko. 2016. Ask, attend and answer: Exploring question-guided spatial attention for visual question answering. In ECCV.
- [Yang et al., 2016] Zichao Yang, Xiaodong He, Jianfeng Gao, Li Deng, and Alexander J. Smola. 2016. Stacked attention networks for image question answering. In CVPR.
- [Zhang et al., 2016] Peng Zhang, Yash Goyal, Douglas Summers-Stay, Dhruv Batra, and Devi Parikh. 2016. Yin and Yang: Balancing and answering binary visual questions. In CVPR.
- [Zhou et al., 2015] Bolei Zhou, Yuandong Tian, Sainbayar Sukhbaatar, Arthur Szlam, and Rob Fergus. 2015. Simple baseline for visual question answering. CoRR, abs/1512.02167.