Columnar structure formation of a dilute suspension
of settling spherical particles in a quiescent fluid
Abstract
The settling of heavy spherical particles in a column of quiescent fluid is investigated. The performed experiments cover a range of Galileo numbers () for a fixed density ratio of . In this regime the particles are known to show a variety of motions [M. Jenny, J. Dušek, and G. Bouchet, “Instabilities and transition of a sphere falling or ascending freely in a Newtonian fluid”, Journal of Fluid Mechanics 508, 201–239 (2004)]. It is known that the wake undergoes several transitions for increasing Ga resulting in particle motions that are successively: vertical, oblique, oblique oscillating, and finally chaotic. Not only does this change the trajectory of single, isolated, settling particles, but it also changes the dynamics of a swarm of particles as collective effects become important even for dilute suspensions with volume fraction up to , which are investigated in this work. Multi-camera recordings of settling particles are recorded and tracked over time in 3 dimensions. A variety of analysis are performed and show a strong clustering behavior. The distribution of the cell areas of the Voronoï tessellation in the horizontal plane are compared to that of a random distribution of particles and shows clear clustering. Moreover, a negative correlation was found between the Voronoï area and the particle velocity; clustered particles fall faster. In addition, the angle between adjacent particles and the vertical is calculated and compared to a homogeneous distribution of particles, clear evidence of vertical alignment of particles is found. The experimental findings are compared to simulations.
I Introduction
The settling of a sphere in a quiescent viscous fluid is a longstanding problem, already explored by Newton Newton (1999) in the XVII century. The problem is simple only in appearance. The usual picture of a straight settling trajectory with a constant terminal velocity resulting from the balance between buoyancy and viscous drag is an important but only marginal situation in a much richer landscape of possible settling regimes.
A sufficiently small or slowly settling sphere (i.e. in a low Reynolds number approximation, so that the flow around the particle can be approximated as a Stokes flow) with diameter and density ratio ( is the particle density and the density of the fluid) surrounded by a fluid with viscosity , will indeed settle along a straight vertical path, reaching a steady terminal vertical velocity , where the linear viscous drag (due to the Stokes flow around the particle) (with the particulate Reynolds number and the drag coefficient, which is simply for a sphere in the limit ) is balanced by the buoyancy force, so that . Several successive scenarios arise as the size or density of the particle increases and the particulate Reynolds number increases.
Finite size effects
At finite particulate Reynolds number, the flow around a sphere departs from a simple Stokes flow, and eventually develops wake instabilities. Such instabilities have been extensively studied (numerically and experimentally) in the past 15 years for the case of fixed spheres in a flow Johnson and Patel (1999); Ghidersa and Dušek (2000); Schouveiler and Provansal (2002); Bouchet et al. (2006). The global picture is now clear, with several successive instabilities taking place as increases: from a steady axisymmetric wake at low to, first, a wake with steady planar double-threaded vortices (above ), then an unsteady time-periodic vortex shedding wake (above ) and finally a transition towards a fully three dimensional chaotic wake above ). These successive modifications of the wake, have two main implications. First, the value of the drag coefficient departs from the simple law as increases, reaching eventually to a full non-linear drag regime (with an almost constant value of at very high values of when the wake becomes fully turbulent).
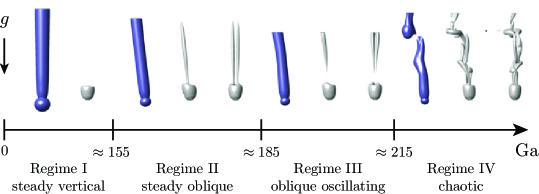
Second, in the case of a free-falling sphere (with additional degrees of freedom compared to the case of a fixed sphere) these wake instabilities induce particle path instabilities marking a departure from a simple vertical trajectory. The settling regime of a free falling sphere is controlled by two dimensionless parameters: i.e. the density ratio and the Galileo number , which can be thought of as a Reynolds number based on the gravitational velocity . A sphere settling in finite Ga regimes (hence beyond the Stokes approximation) is referred to as a ‘finite size sphere’ (by definition the settling problem concerns the case ). The settling Reynolds number is then an output parameter of the problem. The path instabilities at finite values of Ga are now well characterized and have been deeply investigated numerically Jenny et al. (2004) and experimentally Veldhuis and Biesheuvel (2007); Horowitz and Williamson (2010) in the past decade for single finite size free falling spheres, cf. the visualizations in fig. 1 (see also the review by Ern et al. Ern et al. (2012)).
Collective effects
The case of many particles settling simultaneously raises further complexity, as long-range multi-particle hydrodynamic interactions emerge. In the limit of point particles (or equivalently in the limit ), the collective settling of such an ensemble of spheres and the underlying hydrodynamic interactions can be efficiently studied using Stokesian dynamics methods Brady and Bossis (1988); Ramaswamy (2001). This approach yields a satisfactory quantitative comparison with experiments Guazzelli and Morris (2011), although several questions remain, in particular, regarding the induced fluctuations and the correlation lengths of particles and flow motion. Much less is known however for the case of a settling ensemble of finite size particles. Systematic experimental studies remain scarce. Parthasarathy and Faeth Parthasarathy and Faeth (1990) and Mizukami et al. Mizukami et al. (1992) have performed a series of experiments in dilute conditions (volume fraction of particles ) in a range of Ga from 40 to 340. Their experiments focused on measuring the fluctuations of the flow induced by the interacting wakes of the particles and showed that in dilute regimes a linear superposition of wakes gives a good approximation. It is only recently that accurate numerical simulations of a large number of fully resolved finite size particles settling collectively and fully coupled with the fluid have become possible Uhlmann (2005); Kajishima and Takiguchi (2002), mainly thanks to immersed boundary methods combined to direct numerical simulations of the Navier-Stokes equation. These methods permit a description of the coupling between the particle and the surrounding flow at the interface level. Uhlmann & Doychev Uhlmann and Doychev (2014); Doychev (2014) reported recently using this method that depending on the value of Ga, particles may tend (or not) to align in columnar clusters along their wakes, resulting in an enhancement of their settling velocity (the average settling velocity was found up to 12% faster than for individual particles). Such a clustering and settling enhancement was observed for (hence in a regime of steady oblique motion for individual settling particles, see fig. 1), but was not observed for (when individual particles settle along steady vertical path). This study shows that the interplay of individual wake instabilities and collective interactions is crucial to understand the settling of an ensemble of finite size spheres, even in relatively dilute conditions (in their study ). However, the computational cost of these simulations does not yet allow a systematic exploration of the parameter space (density ratio, Galileo number, and volume fraction). At the moment these studies Uhlmann and Doychev (2014); Doychev (2014) only comprise three parameter points at a single value of the density ratio and for two different solid volume fractions and Galileo numbers. We propose here to explore the collective settling of finite size spheres experimentally, with the goal to broaden the range of parameters, in particular regarding the role of the Galileo number around the first wake instabilities. In the present article we therefore address the experimental counterpart of the aforementioned simulations, by exploring the settling behavior of a swarm of dense finite size particles. We look more particularly at the eventual emergence of clustering and columnar alignment, and its impact on local and global settling velocity, for increasing values of the Galileo number in the range and comparable seeding densities of the order of . We compare our experimental data with an existing numerical simulation Doychev (2014) with , in the steady oblique regime when considering an isolated particle, and at a solid volume fraction of the same order in the experiments. The numerical method, the grid resolution, and configuration are identical to case M178 of Uhlmann & Doychev Uhlmann and Doychev (2014). The solid volume fraction, however, was reduced by a factor of ten: it employs the immersed boundary method of Uhlmann Uhlmann (2005) on a triply periodic box elongated in the direction of gravity with a treatment of collisions with a repulsive force Glowinski et al. (1999). The simulation domain has an extension of 85 particle diameters in the horizontal directions and 171 diameters in the vertical direction with a uniform grid resolution such that . This simulation covers 1756 gravitational time units.
II Experimental details
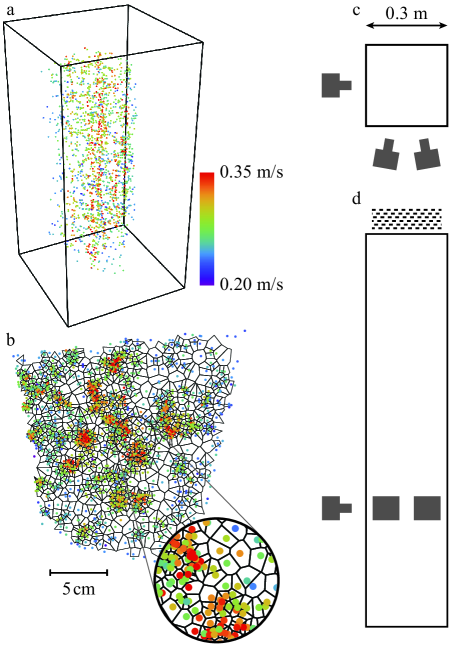
In the current work we look at the collective effects of heavy spherical particles settling in a column of quiescent liquid, see figures 2c and 2d. The high column has a square cross section with sides of . In order to vary Ga two sizes of glass particles ( and ) with density and two fluid viscosities ( and created using a mixture of water and UconTM oil) are used, resulting in . Constant seeding of heavy particles is accomplished by gradually pouring particles on a stack of 6 perforated meshes, which has become the de facto standard, see e.g. ref. Parthasarathy and Faeth (1990). The particles that leave the last mesh were checked to have a Voronoï area distribution closely resembling an RPP distribution (and very far from the Voronoï distribution farther downstream) by injecting particles in a very shallow tank and then taking photographs of the injected particles. The columns are therefore not introduced because of the mesh but are formed during descent. The particles travel roughly one meter before entering the field of view of the cameras, attaining their terminal velocity far before entering the view. For our largest particles this distance of one meter corresponds to roughly . Numerical simulations Uhlmann and Doychev (2014) suggest that at least a distance of is needed in order to observe clusters and columns Uhlmann and Doychev (2014). The falling particles are recorded by a set of three Flare 2M360-CL cameras from IO Industries at up to at a resolution of using a focal length lens covering a height of roughly . The particles are coated black and backlight illumination is employed for enhanced contrast. The cameras are calibrated using an in-situ calibration method Machicoane et al. (2016) achieving a sub-radius resolution of roughly . Picked from a set of experiments are those for which the volume fraction is constant and comparable to one another (see table 1). Note that the injection is done manually and the volume concentration is only known a posteriori. Injections that are too short do not form columns and only show transient behavior and are therefore rejected. Furthermore we look for experiments where the number of particles in the field of view remains roughly constant. The selected experiments all have a constant volume fraction in the range – and have sufficiently long duration of injection such that columns can potentially be formed. In particular, we make sure to omit the transient part of each experiment, at the beginning when particles start entering the measurement volume and at the end when they leave it. These experiments have the following Galileo numbers: , , , and , here the values between parenthesis are the number of experiments, see also table 1. Note that the values for Ga are rounded to the nearest 10 to reflect the errors in , , and , which lead to an estimated error of 10 for the Galileo number. In the recorded imagery particles are detected and using standard Particle Tracking Velocimetry (PTV) the location of the particles are tracked over time and three dimensional space. A snapshot of the reconstructed particle positions can be seen in fig. 2a for the case . Visual inspection reveals already clear vertical trails of particles.
| Ga | [mm] | [] | [m/s] | [m/s] | [m/s] | / | [] | ||
|---|---|---|---|---|---|---|---|---|---|
| 110 | 2.5 | 2.0 | 3.15 | 0.17 | 0.18 | 0.22 | 1.19 | 120 | 38 |
| 110 | 2.5 | 2.0 | 3.15 | 0.17 | 0.18 | 0.21 | 1.13 | 120 | 20 |
| 170 | 2.5 | 2.0 | 2.05 | 0.17 | 0.25 | 0.31 | 1.25 | 240 | 49 |
| 170 | 2.5 | 2.0 | 2.05 | 0.17 | 0.25 | 0.30 | 1.21 | 240 | 56 |
| 200 | 2.5 | 3.0 | 3.15 | 0.21 | 0.30 | 0.36 | 1.17 | 290 | 79 |
| 200 | 2.5 | 3.0 | 3.15 | 0.21 | 0.30 | 0.38 | 1.23 | 290 | 100 |
| 310 | 2.5 | 3.0 | 2.05 | 0.21 | 0.33 | 0.37 | 1.10 | 490 | 84 |
| 310 | 2.5 | 3.0 | 2.05 | 0.21 | 0.33 | 0.39 | 1.16 | 490 | 79 |
| 310 | 2.5 | 3.0 | 2.05 | 0.21 | 0.33 | 0.39 | 1.17 | 490 | 76 |
III Results
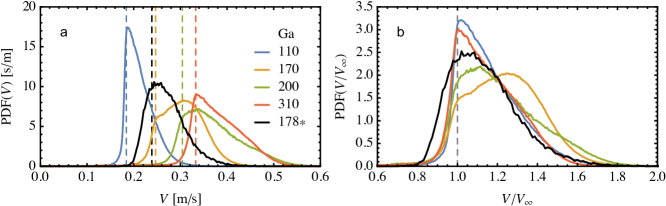
The velocity of the particles is inferred from the particle trajectories, and is defined as positive in the direction of gravity, see also fig. 2a. Visually we already observe the formation of high-speed (orange–red) columns inside the measurement volume. Moreover, during the experiment one can clearly see the column extend way beyond measurement section. We estimate that the columns are at least long without any sign that they are unstable or that they break up. The probability density function (PDF) of the velocity as a function of Ga can be found in figure 3a. The mean settling velocity of isolated particles are included as colored dashed lines and increases with Ga. We complement our experimental data with numerical simulations Doychev (2014) with comparable , , and , see fig. 3a. A large spread of the velocity above its isolated velocity is found, which supports the idea of an enhanced settling velocity in a suspension of particles. Figure 3b shows the velocities normalized by their isolated settling velocity. We note that the largest velocity enhancement is seen for . The speed enhancement for is notably less than for the and cases, see also table 1. Several possible reasons might explain this behavior. First, the most probable explanation is that the chaotic wakes of the particles might prohibit the formation of a stable train of settling particles, which is not the case for intermediate Ga. Second, the volume fraction necessary for ‘equivalent’ clustering might be a function of Ga. The velocities lower than the mean isolated velocity (below in the fig. 3b) is caused by the combined effects of non-monodispersity, minute density-differences, lack of roundness, and the unavoidable adherence of micro bubbles. In addition, it is clear that particles drag fluid downwards with them, and therefore, when fluid is going downward, and equal amount has to go up as per the continuity equation. This upward flow could cause isolated particles (particles in low density regions) to appear to have a lower velocity in the frame of reference of the lab. This effect can not be disentangled by us as we do not have access to the velocity of the fluid. The experiments are performed in the center of a square box and any upward flow can thus go ‘around’ the falling particles en masse, however in the simulation there is no such possibility as the simulation domain is performed in a 3 dimensional periodic box. In the simulation we therefore expect more particles with a velocity below . Indeed, this can clearly be seen in fig. 3b. The strong enhancement of the velocity can be attributed to particles entering the wake of upstream (leading) particles, similar to what happens with aligned bubbles rising in tandem Huisman et al. (2012). We therefore expect that particles tend to align vertically such that a collection of vertically clustered particles can fall faster as they would individually.
To investigate this vertical alignment hypothesis we look at the angle of a particle with other particles in its vicinity and the vertical, see the sketch in figs. 4. The focus is at close-range interactions, and therefore the distance between two neighboring particles is limited to . We plot the PDF of the angle as a function of Ga, see fig. 4a.
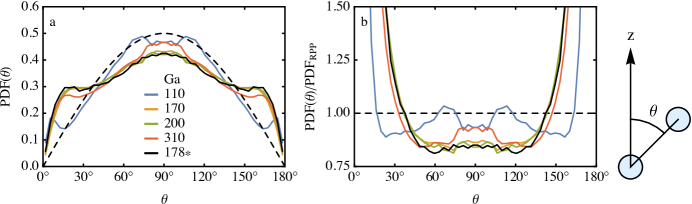
To compare our data we introduce the concept of a random set of Poisson point (RPP) particles. These non-interacting particles are independently and randomly placed inside a volume of choice. We will use this as reference and show that our particles (despite the low Re and relatively low ) do interact with each other as their statistics strongly differ from that of RPP particles. For such a random set of points the distribution of the angle can be theoretically calculated and follows where , following from the Jacobian of spherical coordinates. Each pair is considered twice and with a different angle . The sum of these two angles is however , which ensures that the PDF is indeed symmetric around . For the low Ga case of we see that the PDF (fig. 4a) closely resembles the one that is found if one were to take random particles. We do find a slight increase around and a slight decrease around which might be caused by the mild clustering that we see from visual inspection, and which we will show later using Voronoï analysis. For the high Ga cases (), we see a very different behavior; namely that for we see a clear reduction in the number of neighbors, see also fig. 4b where we present the distribution normalized by the RPP distribution.. So the chance of finding a particle next to each other is significantly reduced for the high Ga cases. As a consequence, or rather a cause, particles are found to align vertically far more than a random set of Poisson particles; the PDF is found to be much higher for (or equivalently , which can be more clearly seen in figure 4b. Figures 4 have the inclusion of numerical data Doychev (2014) with , , and which is comparable to our set of parameters. For this data we find that angle-pair distribution is remarkably similar to the experimentally found distributions for , despite having a fairly different density ratio . Indeed a difference in can have a profound impact on the stability of the wake as found by refs. Jenny et al. (2004); Veldhuis and Biesheuvel (2007), though the influence is expected to be relatively small in the range for this value of the Galileo number. Note, however, that the phase spaces presented in refs. Jenny et al. (2004); Veldhuis and Biesheuvel (2007) are for the case of vanishing , and these lines might shift significantly for increasing as neighboring particles can trigger wake instabilities.
A look from the top further corroborates the hypothesis that these particles cluster and thereby form a rapidly-settling group (or cluster) of particles, see fig. 2b. This top view shows the horizontal position of the particles colored by their velocities. Not only do we observe a set of high-density and low density-regions—far different from a RPP—but also that the settling velocities are higher in high-density regions, which can be attributed to vertical alignment and further corroborates our view of the mechanism of enhanced settling velocity. The observation of relatively low and high density regions—different from RPP—can be substantiated by computing the Voronoï tessellation in the horizontal plane. It is indeed the Voronoï tessellation in the horizontal plane that should clearly show a signature of clustering as it is this plane that is perpendicular to gravity. An example of a Voronoï tessellation is included in fig. 2b. We take particles over the entire measurement height (roughly ) such as to have as many samples as possible. Note that the choice of the vertical extent needs to be at least several times the typical vertical distance between descending particles in the same column, such that vertically aligned particles create dense regions once projected on the horizontal plane. We have checked that the PDF of the Voronoï areas is similar if a limited vertical extent (down to ) is chosen. Each particle is assigned the set of all points (forming a convex polygon called a Voronoï cell) that is closest to itself rather than any other particle. The area of the cell is now inversely proportional to the local density Monchaux et al. (2010). Mathematically, the Voronoï tessellation is the dual graph of the Delaunay triangulation. We make sure not to include Voronoï cells at the periphery, which create artificially large cells, skewing the statistics.
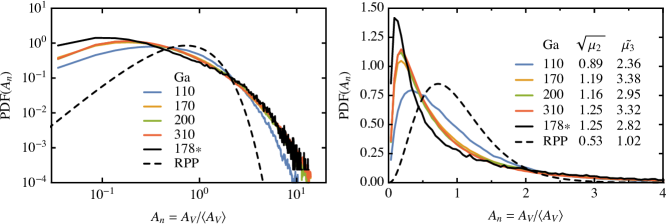
The Voronoï tessellation is calculated for each frame and the area of the cells () are scaled by the mean area of each frame. The PDF of the normalized area () is calculated for each Ga, see figs. 5. The figures include the corresponding PDF for random Poisson particles (RPP). For the lowest value of the Galileo number, we already observe an increase in probability density for smaller and larger cells indicating some clustering, as we also observe in the angle-pair distribution in figs. 4. For large Ga, we find even more increase in the probability density for both small and large Voronoï areas, indicating a more pronounced clustering. Such an important level of clustering could already be observed from a simple visual inspection of fig. 2b: more dense and ‘open’ areas than one would expect from randomly placed particles. Broadening of the distribution is also quantified by calculating the standard deviation of the distribution, see figs. 5. Compared to an RPP () we indeed observe an increased standard deviation for (), indicating clustering, and further increased standard deviations for even higher (up to ). Increased standard deviation with respect to an RPP is indeed also what one observes in fig. 2b. We emphasize that the particles follow an RPP distribution when they exit the injector—very different from the distribution farther downstream.
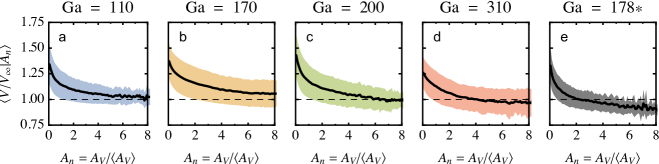
A visual inspection of fig. 2b also suggests that higher velocities are attained at high-density regions. To substantiate that claim the conditional average of the average settling velocity is calculated, see figs. 6. The average velocity is conditioned on the normalized Voronoï area which is proportional to the inverse local density. Moreover, along with the mean velocity also the standard deviation is calculated for each . The mean velocities and their spread are normalized using the terminal velocity of an isolated particle settling in a quiescent fluid bath. A clear increase in speed of up to can be seen for high density (low ) regions for all Ga, and the graphs are very similar, showing the same behavior. As we stated before, the simulations of ref. Uhlmann and Doychev (2014) are performed in a 3 dimensional periodic box where upward flow will certainly affect the velocity of some isolated particles. We can now clearly see this in fig. 6e; isolated particles () have normalized velocities below 1, meaning they settle slower than they would if they were to settle by themselves in an infinite bath. Also here we see that the case of shows slightly less enhanced velocity (for example at ) as compared to the and cases.
IV Conclusion
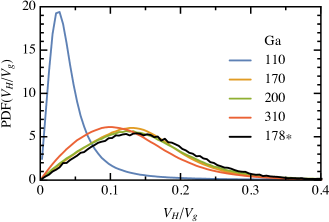
Starting from the visual observation in fig. 2a that particles look vertically aligned, we find that, indeed, particles are preferentially aligned vertically as per our findings of the PDF of in figs. 4. In the two dimensional top view visual inspection suggests low and high density regions with low and high velocities, respectively. We confirm this view in figures 5 and 6. Altogether, our findings indicate that particles tend to settle in a preferential columnar configuration, with an increased trend to alignment with increasing Galileo number. This columnar alignment then impacts the settling of the particles as particles that follow in the wake of another particle tend to settle faster. It was found in previous numerical simulations at and (although at a higher seeding density ) by Uhlmann & DoychevUhlmann and Doychev (2014) that only the latter tended to form columns impacting the settling. The different behavior between the low and large Galileo cases is interpreted in terms of the properties of particle wakes. The wakes of the low Ga particles () have a stable vertical wake (see fig. 1) and particle fall straight down. Only when two particles are already vertically aligned will the trailing particle fall in the wake of the leading particle. For higher Ga the wakes of the particles are unstable, causing the trajectory of said particles to be either steady oblique (), oblique oscillating (), or even chaotic (). In the aforementioned simulations, the case , was in a steady oblique regime, particles therefore have a horizontal motion with a higher chance of ‘catching’ the slipstream of an upstream particle Uhlmann and Doychev (2014), causing the columnar alignment and the enhanced settling velocity. Our experimental results show that the same behavior (columnar alignment and enhanced settling) prevails for the oblique oscillating () and chaotic () situations which all exhibit lateral motion. The strongest impact on overall settling velocity enhancement, is observed for particles at intermediate Galileo number () in the steady oblique situation. The highest Galileo case explored () was found on the contrary to exhibit less enhanced settling. At first glance this may seem consistent with the slightly reduced alignment observed for the case from the angular statistics shown in fig. 4. However Voronoï statistics in fig. 5 seem on the other hand to exhibit a slightly enhanced clustering for this same case, which would be on the contrary associated to settling enhancement. A first attempt of interpretation could be related to the chaotic nature of the particle motion at which could still promote the chance for particles to catch each others wake and form columns, while disturbing the alignment within the columns. However, the statistics of the horizontal velocity of the particles reveal a more complex situation. The PDF of the amplitude of the horizontal velocity of the particles for is indeed only marginally different as compared to the , , and cases, but very different from the case, see fig. 7. The case exhibits a low (mean) sideways velocity compared to the other cases, with a narrow distribution, as expected for particles settling mostly in a ‘steady-straight’ regime. The other cases exhibit all very similar PDFs compared to each other, with larger mean sideways velocities and broader distributions (note, though, that the mean sideways horizontal velocity is a little less for the case as compared to the , , and cases). Purely oblique trajectories (as expected for individual particles settling at ) would exhibit a larger mean sideway motion compared to , but still a narrow PDF (the amplitude of the horizontal velocity being mostly constant). The chaotic case on the contrary is expected to have a wide PDF for the horizontal velocity which undergoes erratic fluctuations. The similarity of the PDFs for the four cases therefore indicates that, though these particles follow different paths (fig. 1) when they settle individually, an ensemble of particles eventually shows complex trajectories and chaotic wakes, probably due to particles and the wakes interacting with each other, causing horizontal velocities of the particles to have important and similar fluctuations (see fig. 7). Furthermore, note that fig. 7 shows the horizontal velocity of the particles and that the horizontal velocities of the flow in the wake of individual particles can follow a different trend. Overall these observations show that it is very likely irrelevant to speculate on possible interpretations for the differences in the settling collective behavior for particles at and at simply considering the usual ‘single particle regimes’ in fig. 1, although these regimes certainly play a role in the initial triggering of column formation. Why the case shows less enhanced velocity, while still having a comparable , , , and (though in each case it slightly differs from the , , and cases), is still an open question. Further research, where also the fluid-velocity is measured, might help to find an explanation.
An increase or decrease in settling velocity is significant in cases where one wants to predict or prevent settling particles in e.g. chemical reactors with solid reactants or settling of particulate matter in riverbeds, and can probably also affect rain falls (the transition between steady vertical and steady oblique regimes for water droplets in air occurs for droplet diameters of the order of 850 microns) and ash cloud dynamics.
Finally, a striking observation of the present study is that, contrary to the simulations, we do find in the experiment that particles in the steady vertical regime () also exhibit mild clustering and column formation, although less pronounced than for particles at larger Galileo number (as shown by Voronoï statistics in fig. 5 and the angular pair statistics in figs. 4). A possible reason for the emergence of columns for such a low Galileo number, where no wake instability is expected, can be related to the existence of a large scale flow caused by a ensemble of settling particles in a closed container as ours. Such a large-scale flow is absent in the simulations presented in the manuscript as it has a periodic domain. This large scale flow might induce some different flow dynamics as particles in low-density regions are less affected by upward flow as compare to those particles for the case of the simulation.
To summarize, we find a coherent set of observations for settling particles that explain the observed features: trajectory properties, vertical alignment, high density regions, and enhanced settling velocity. Future studies, will explore further the role of increasing the seeding density as well as the importance of confinement and boundary conditions. Another important extension of the present study concerns the impact of surrounding turbulence on the column formation and settling enhancement.
Acknowledgements.
We acknowledge the German-French program procope 57129319, the French program ANR-12-BS09-0011 “TEC2”, and the German Research Foundation (DFG) under Project UH242/1-2 for funding this study.References
- Newton (1999) Isaac Newton, The Principia: mathematical principles of natural philosophy (Univ of California Press, 1999).
- Johnson and Patel (1999) T.A. Johnson and V.C. Patel, “Flow past a sphere up to a Reynolds number of 300,” Journal of Fluid Mechanics 378, 19–70 (1999).
- Ghidersa and Dušek (2000) B. Ghidersa and J. Dušek, “Breaking of axisymmetry and onset of unsteadiness in the wake of a sphere,” Journal of Fluid Mechanics 423, 33–69 (2000).
- Schouveiler and Provansal (2002) L. Schouveiler and M. Provansal, “Self-sustained oscillations in the wake of a sphere,” Physics of Fluids 14, 3846–3854 (2002).
- Bouchet et al. (2006) G. Bouchet, M. Mebarek, and J. Dušek, “Hydrodynamic forces acting on a rigid fixed sphere in early transitional regimes,” European Journal of Mechanics - B/Fluids 25, 321 – 336 (2006).
- Uhlmann and Doychev (2014) M. Uhlmann and T. Doychev, “Sedimentation of a dilute suspension of rigid spheres at intermediate Galileo numbers: the effect of clustering upon the particle motion,” J. Fluid Mech. 752, 310–348 (2014), 1406.1667 .
- Jenny et al. (2004) M. Jenny, J. Dušek, and G. Bouchet, “Instabilities and transition of a sphere falling or ascending freely in a Newtonian fluid,” Journal of Fluid Mechanics 508, 201–239 (2004).
- Veldhuis and Biesheuvel (2007) C.H.J. Veldhuis and A. Biesheuvel, “An experimental study of the regimes of motion of spheres falling or ascending freely in a Newtonian fluid,” International Journal of Multiphase Flow 33, 1074 – 1087 (2007).
- Horowitz and Williamson (2010) M. Horowitz and C.H.K. Williamson, “The effect of Reynolds number on the dynamics and wakes of freely rising and falling spheres,” Journal of Fluid Mechanics 651, 251–294 (2010).
- Ern et al. (2012) P. Ern, F. Risso, D. Fabre, and J. Magnaudet, “Wake-induced oscillatory paths of bodies freely rising or falling in fluids,” Annual Review of Fluid Mechanics 44, 97–121 (2012).
- Brady and Bossis (1988) J. F. Brady and G. Bossis, “Stokesian dynamics,” Annual Review of Fluid Mechanics 20, 111–157 (1988), http://dx.doi.org/10.1146/annurev.fl.20.010188.000551 .
- Ramaswamy (2001) S. Ramaswamy, “Issues in the statistical mechanics of steady sedimentation,” Advances in Physics 50, 297–341 (2001), http://dx.doi.org/10.1080/00018730110050617 .
- Guazzelli and Morris (2011) É. Guazzelli and J. F. Morris, A Physical Introduction to Suspension Dynamics (Cambridge University Press, 2011) cambridge Books Online.
- Parthasarathy and Faeth (1990) R. N. Parthasarathy and G. M. Faeth, “Turbulence modulation in homogeneous dilute particle-laden flows,” Journal of Fluid Mechanics 220, 485–514 (1990).
- Mizukami et al. (1992) M. Mizukami, R.N. Parthasarathy, and G.M. Faeth, “Particle-generated turbulence in homogeneous dilute dispersed flows,” International Journal of Multiphase Flow 18, 397 – 412 (1992).
- Uhlmann (2005) M. Uhlmann, “An immersed boundary method with direct forcing for the simulation of particulate flows,” Journal of Computational Physics 209, 448 – 476 (2005).
- Kajishima and Takiguchi (2002) T. Kajishima and S. Takiguchi, “Interaction between particle clusters and particle-induced turbulence,” International Journal of Heat and Fluid Flow 23, 639 – 646 (2002).
- Doychev (2014) T. Doychev, The dynamics of finite-size settling particles, Ph.D. thesis, Karlsruhe Institute of Technology http://dx.doi.org/10.5445/KSP/1000044723 (2014).
- Glowinski et al. (1999) R. Glowinski, T.-W. Pan, T.I. Hesla, and D.D. Joseph, “A distributed Lagrange multiplier/fictitious domain method for particulate flows,” International Journal of Multiphase Flow 25, 755 – 794 (1999).
- Machicoane et al. (2016) N. Machicoane, M. Lopez-Caballero, M. Bourgoin, A. Aliseda, and R. Volk, “Improvements on Particle Tracking Velocimetry: model-free calibration and noiseless measurement of second order statistics of the velocity field,” ArXiv e-prints (2016), arXiv:1605.03803 [physics.flu-dyn] .
- Huisman et al. (2012) S. G. Huisman, P. Ern, and V. Roig, “Interaction and coalescence of large bubbles rising in a thin gap,” Phys. Rev. E 85, 027302 (2012).
- Monchaux et al. (2010) R. Monchaux, M. Bourgoin, and A. Cartellier, “Preferential concentration of heavy particles: a Voronoi analysis,” Physics of Fluids (1994-present) 22, 103304 (2010).