]Present address: State Key Laboratory of Low-Dimensional Quantum Physics, Department of Physics, Tsinghua University, Beijing 100084, China
Dumbbell Defects in FeSe Films:
A Scanning Tunneling Microscopy and First-Principles Investigation
Abstract
The properties of iron-based superconductors (Fe-SCs) can be varied dramatically with the introduction of dopants and atomic defects. As a pressing example, FeSe, parent phase of the highest- Fe-SC, exhibits prevalent defects with atomic-scale “dumbbell” signatures as imaged by scanning tunneling microscopy (STM). These defects spoil superconductivity when their concentration exceeds 2.5%. Resolving their chemical identity is prerequisite to applications such as nanoscale patterning of superconducting/nonsuperconducting regions in FeSe, as well as fundamental questions such as the mechanism of superconductivity and the path by which the defects destroy it. We use STM and density functional theory to characterize and identify the dumbbell defects. In contrast to previous speculations about Se adsorbates or substitutions, we find that an Fe-site vacancy is the most energetically favorable defect in Se-rich conditions, and reproduces our observed STM signature. Our calculations shed light more generally on the nature of Se capping, the removal of Fe vacancies via annealing, and their ordering into a superstructure in FeSe and related alkali-doped compounds.
FeSe, a member of the iron-based superconductors (Fe-SCs) with the simplest stoichiometry, lies at the vanguard of high- materials. On one hand, its anomalous parent phase, with no static magnetic order Medvedev et al. (2009), poses a fresh theoretical challenge Glasbrenner et al. (2015); Wang et al. (2015); Chubukov et al. (2015); Yu and Si (2015). On the other hand, its plain, 2D-layered structure lends itself to bottom-up, nanoscale engineering of its electronic properties. As a striking example, monolayer FeSe interfaced with SrTiO3 Wang et al. (2012) exhibits an order-of-magnitude enhancement in its transition temperature (up to 109 K Ge et al. (2015)) compared to its bulk value (8 K Hsu et al. (2008)). Similar boosts up to 48 K have also been attained by depositing K adatoms Miyata et al. (2015); Wen et al. (2016), opening the door to all kinds of adatom modifications of FeSe.
More generally, defects in Fe-SCs are crucial to control Kamihara et al. (2008); Yeh et al. (2008), raise the critical current through vortex pinning Yin et al. (2009); Song et al. (2013), and also serve as microscopic probes of pairing symmetry Balatsky et al. (2006); Kashiwaya and Tanaka (2000). Furthermore, defect effects are typically enhanced in 2D systems. An ultimate goal is to control precise placement of atomic defects, possibly through scanning probe lithography, as has been achieved with hydrogenated graphene Sessi et al. (2009), P dopants in Si Weber et al. (2012), and Mn dopants in GaAs Kitchen et al. (2006). To similarly pattern nanostructures in FeSe, an atomistic understanding of defect formation in this material is needed.
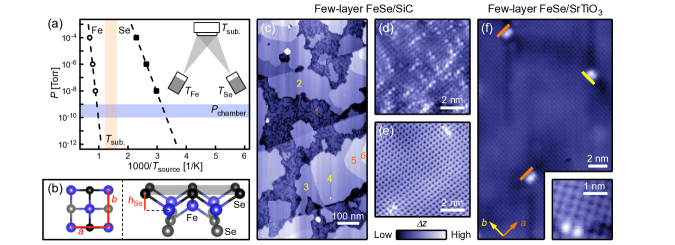
As an intriguing and urgent example, FeSe films grown by molecular beam epitaxy (MBE) exhibit prevalent defects with atomic-scale “dumbbell” signatures as imaged by scanning tunneling microscopy (STM) (also called geometric dimers in Ref. Song et al. (2012)). They consist of two bright lobes on adjacent top-layer Se sites [Figs. 1(d)-(f)]. Their concentration is highly tunable, increasing with excess Se flux and decreasing with substrate temperature. Importantly, superconductivity emerges only when their concentration falls below 2.5% Song et al. (2011a). Despite the structural simplicity of FeSe, it is still unknown whether these dumbbell defects are Se adsorbates, antisites, interstitials, or some other type of defect. Their identity is crucial to determine whether or not they can be engineered to define superconducting/nonsuperconducting regions in FeSe for nanoscale applications.
Here we present an STM characterization of dumbbell defects and an exhaustive, first-principles investigation of candidate defect configurations. Using density functional theory (DFT), we find that Fe vacancies have the lowest formation energy. Furthermore, our modeling shows that they perturb orbitals on neighboring Se sites, producing dumbbell signatures when imaged by STM. Based on nudged elastic band calculations and 2D random walk simulations, we explain how Fe vacancies can diffuse to the edge of terraces during vacuum annealing, consistent with experimental observations of reduced dumbbell density after annealing. We further discuss implications for Se capping of FeSe films for ex-situ applications. We also connect our results to previous questions of vacancy ordering in FeSe and related alkali-doped compounds.
Methods. Films of FeSe were deposited via MBE on 6H-SiC(0001) and SrTiO3(001) substrates, following established recipes Song et al. (2011b, a); Wang et al. (2012); Huang et al. (2015). The greater volatility of one element (Se) over the other (Fe) motivates two conditions for stoichiometric growth Song et al. (2011a): First, by setting the substrate temperature between the source temperatures, , impinging Fe with temperature will be adsorbed with sticking coefficient close to unity, while impinging Se can stick only if they bind to free Fe on the substrate [Fig. 1(a)]. Second, to compensate for high Se losses and to mitigate excess Fe clustering, typical molar flux ratios range from 5 to 20.
Post growth, the films were transfered in situ to a homebuilt STM and imaged at liquid nitrogen/helium temperatures. From Figs. 1(d)-(f), we enumerate several characteristics of the dumbbell defects: First, their prevalence over any other kinds of defects suggests they are energetically favorable. In few-layer FeSe, this observation is independent of substrate, SiC [Figs. 1(c)-(e)] or SrTiO3 [Fig. 1(f)]. (We note that single-layer FeSe/SrTiO3, with vastly different superconducting properties, exhibits a different set of defects Huang et al. (2015, 2016).) Similar dumbbell defects have also been imaged in FeSe crystals grown by vapor transport Kasahara et al. (2014); Watashige et al. (2015) and in Li1-xFexOHFeSe crystals grown by hydrothermal ion exchange Du et al. (2016); Yan et al. (2015). Second, the dumbbells are aligned along both the and axes of the 2-Fe unit cell [Figs. 1(d)-(f)], pointing to their independence from a structural orthorhombic distortion McQueen et al. (2009) and electronic nematic state in FeSe Shimojima et al. (2014); Nakayama et al. (2014); Watson et al. (2015); Zhang et al. (2015) that break 90∘ rotational symmetry. Third, our STM measurements up to = 84 K with bias voltages 10100 mV demonstrate that the dumbbell signatures persist well above the superconducting state. Fourth, the dumbbell defects can be removed upon annealing, leaving behind pristine FeSe [Fig. 1(e)].
| Monolayer | Bilayer | Film | Bulk | |
|---|---|---|---|---|
| (expt.) | (expt.) | |||
| Functional: | GGA | GGA/DFT-D2 | ||
| Supercell size: | 44 | 33 | ||
| BZ sampling: | 221 | 441 | ||
| = [Å]: | 3.69 | 3.64 | 3.8-3.9 | 3.7707 |
| [Å]: | 5.47 | 5.5 | 5.521 | |
| [Å]: | 1.38 | 1.40 | 1.472 | |
| [Å]: | 20 | 25 |
We performed DFT calculations using VASP Kresse and Furthmüller (1996a, b). We used the PBE exchange-correlation functional Perdew et al. (1996), and the projector augmented wave (PAW) method, with Fe 4, 3 and Se 4, 4 electrons treated as valence. An energy cutoff of 450 eV and Methfessel-Paxton smearing Methfessel and Paxton (1989) with = 0.1 eV were employed. We modeled defects within freestanding monolayer and bilayer FeSe supercells (details in Table 1), with full relaxation of internal atomic coordinates (corresponding to a magnitude of the force per atom 0.025 eV/Å). To reproduce the experimental -axis value, we included van der Waals corrections in the bilayer calculations using the DFT-D2 method Grimme (2006), with dispersion potential parameters taken from Ref. Ricci and Profeta (2013) (tested for bulk FeSe and FeTe).
Results. Given the correlation of dumbbell defects with excess Se flux, we examine candidate defects in which . Although the dumbbell signature is centered above an Fe site, we explore all possible binding sites for completeness. We begin with isolated Se adatoms as the simplest class of Se-rich defects. Among three adsorption sites (see Supporting Information), the hollow site in FeSe, directly above a bottom-layer Se atom, is most stable [Fig. 2(a)-(b)]. We compute the binding energy as
| (1) |
where is the DFT total energy of the system including the adatom, is the total energy of pristine FeSe within the same supercell, and is the energy of an isolated Se atom. We find that = 3.14 eV (3.02 eV) for monolayer (bilayer) FeSe, which suggests chemisorption. Examining the relaxed structure [Fig. 2(b)], we observe that the Se adatom comes within bonding distance of neighboring Fe atoms and induces local strain. Importantly, given that in Fe-SCs is highly sensitive to the Fe-Se/As height Okabe et al. (2010), our result points to a possible microscopic explanation of why amorphous Se may be a poor capping material.
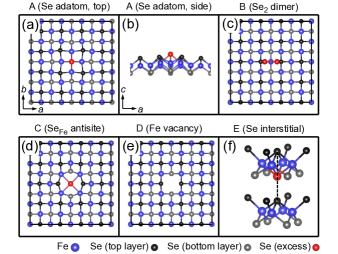
We next examine adsorbed Se2 dimers. We find that among five possible adsorption geometries (see Supporting Information), two are nearly degenerate, one of which has the Se2 molecule centered above an Fe site [Fig. 2(c)]. Furthermore, with binding energy defined as
| (2) |
where is the energy of an isolated Se2 molecule, we calculate = 0.39 eV (0.69 eV) for monolayer (bilayer) FeSe. These values suggest that Se2 dimers are weakly physisorbed and may have short adsorption lifetimes. We contrast this result to the case of GaAs(001)-(24), where surface dangling bonds can stabilize adsorbed As2 dimers or As4 tetramers with calculated binding energies up to 1.6 eV Morgan et al. (1999). Such dangling bonds are absent in the top layer of FeSe. As a side note, our DFT calculations suggest that adsorption can be enhanced if two surface dimers cluster into Se4, but this would produce an unobserved four-lobe STM topographic signature.
Alternatively, some studies have proposed that a perturbation at the Fe site (either an unknown repulsive potential Choubey et al. (2014) or Se subsitution Li et al. (2014)) could affect the orbitals on neighbouring Se atoms and generate a dumbbell signature. We consider three possibilities: Se antisites, Fe-site vacancies, and Se interstitials, perhaps binding to a surface-layer Fe atom from below. As seen in Fig. 2(d), the antisite configuration in the monolayer supercell produces pronounced distortions of nearby atoms. Fe atoms are pulled closer to the antisite, and Se atoms are pushed away. We note that the antisite could not be held in place in the bilayer supercell during structural relaxation. Figure 2(e) shows an Fe vacancy. Figure 2(f) shows the most stable Se interstitial configuration, where the excess Se atom lies beneath a top-layer Se site, not an Fe site.
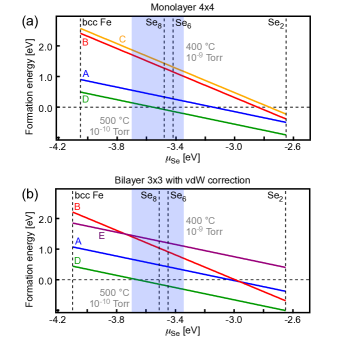
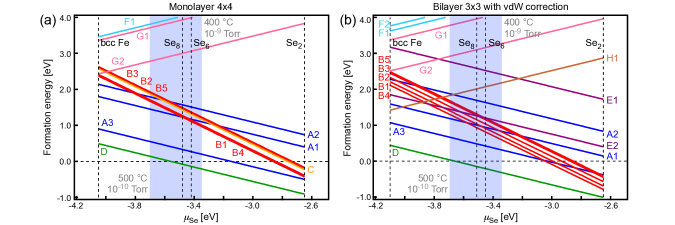
To compare formation energies among the aforementioned defects with variable stoichiometry, we include the energetic costs of incorporating () additional Fe (Se) atoms from a reservoir into the defect:
| (3) |
Assuming quasi-equilibrium growth of FeSe and no bulk Fe or Se precipitation, we impose the following constraints on the chemical potentials: (i) ; (ii) ; (iii) . Eq. (3) then yields
| (4) |
where . Figures 3(a), (b) show results for monolayer and bilayer FeSe supercells. In both cases the Fe vacancy possesses the lowest formation energy by a margin of at least 0.5 eV within estimated ranges.
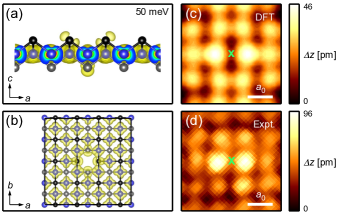
Having identified the Fe vacancy as the lowest-energy, Se-rich defect of FeSe, we considered whether it can produce a dumbbell signature. Figures 4(a), (b) show a charge density isosurface, integrated from the Fermi energy up to 50 meV. For improved accuracy, we increased the BZ sampling to 881 and used tetrahedron smearing with Blöchl corrections Blöchl et al. (1994). Due to the missing Fe atom, orbitals on neighboring Se atoms protrude further out. We simulate an STM topography by tracing the height of the charge density isosurface. As seen in Fig. 4(c), the two protruding Se orbitals appear as bright lobes of a dumbbell, matching the experimental image [Fig. 4(d)].
If the dumbbell defects are Fe vacancies, they must also be capable of diffusing to the edge of typical film terraces at high temperatures, as implied by Fig. 1(e). To elucidate this process, we performed nudged elastic band calculations to find the minimum energy path associated with Fe vacancy hopping Mills et al. (1995); Jónsson et al. (1998). We used a smaller supercell with BZ sampling. We computed seven intermediate images, each relaxed with total force per atom (tangential and chain) 0.025 eV/Å.
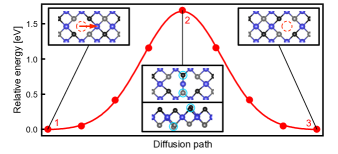
Figure 5 shows the relative energy along the diffusion path, with insets depicting initial, transition, and final states. In the transition state, two neighboring Se atoms (circled in blue) are pushed above and below the plane, suggesting that vacancy diffusion may be easier on the surface than in the bulk, as expected. We calculate the diffusion rate as
| (5) |
where is the attempt frequency and = 1.69 eV is the barrier height. From Vineyard transition-rate theory Vineyard (1957); Pandey and Kaxiras (1991) (see Supporting Information),
| (6) |
where is the mass of an Fe atom and () is the initial-state (transition-state) position of the hopping Fe atom. Then for a random walk over a 2D lattice, the root-mean-square distance traveled after time is
| (7) |
where . If we anneal at 450 ∘C for 2.5 h [Fig. 1(e)], we estimate to be 950 Å. This distance exceeds typical film island dimensions [Fig. 1(c)], thereby explaining how dumbbell defects are removed upon annealing.
Discussion. We draw a final connection between dumbbell defects and Fe vacancies. At large dumbbell concentrations, Song et al. Song et al. (2011a) found that the defects ordered into a superstructure. Similarly, electron diffraction measurements of FeSe crystals, nanosheets, and nanowires have revealed various types of Fe-vacancy order, including 1 Chen et al. (2014). Given that the Fe vacancy is the thermodynamically most stable defect, the closest packing of these vacancies would lead to a arrangement, because any closer packing would produce multi-vacancy defects (two or more nearest neighbor Fe atoms mising), which would likely destabilize the crystal altogether. This argument provides an explanation of the pattern (see Supporting Information for additional calculations).
The identification of the dumbbell superstructure with Fe-vacancy order has further significance. Investigations of the related compound Fe2-ySe2 ( = alkali metal), with enhanced up to 32 K Guo et al. (2010); Wang et al. (2011a), have been complicated by mesoscale phase separation into multiple Fe-vacancy reconstructions Wang et al. (2011b); Ricci et al. (2011); Li et al. (2011, 2012); Ding et al. (2013). Our calculations suggest that Fe vacancy order is not a pathological feature of Fe2-ySe2, but a phenomenon intrinsic to FeSe grown under excess Se flux. The crucial distinction is that in the latter case, Fe vacancies can be removed upon annealing, while in the former, Fe vacancy diffusion may be hindered by the buffer layers. This additional flexibility in FeSe may afford better control of stoichiometric (superconducting) and ordered vacancy (nonsuperconducting) phases for nanoscale patterning.
In conclusion, we have established the chemical identity of dumbbell defects that appear in MBE-grown FeSe under excess Se flux and suppress superconductivity with concentrations greater than 2.5%. Our DFT calculations show that Fe vacancies (1) are energetically most favorable, (2) produce dumbbell signatures consistent with STM images, and (3) can diffuse to the edge of typical film islands with vacuum annealing. These atomistic insights lay the foundation towards controlling precise placements of such defects. We also reiterate that amorphous Se may be a poor choice of capping material to perform ex-situ measurements due to induced distortions within the underlying FeSe. Finally, we suggest a broader, microscopic connection between dumbbell defect phenomenology in FeSe and mesoscale phase separation in Fe2-ySe2.
Acknowledgements.
Acknowledgements. We thank Tetsuo Hanaguri for suggesting to us the Fe vacancy configuration. We thank Shiang Fang, Wei Chen, Matthew Montemore and Joerg Rottler for useful conversations. This work was supported by the National Science Foundation under Grant No. DMR-1231319 (STC Center for Integrated Quantum Materials), and the Gordon and Betty Moore Foundation’s EPiQS Initiative through Grant No. GBMF4536. Computations were run on the Odyssey cluster supported by the FAS Division of Science, Research Computing Group at Harvard University. E. K. acknowledge support by Army Research Office (ARO-MURI) W911NF-14-1-0247. J. E. H. acknowledges support from the Canadian Institute for Advanced Research.References
- Medvedev et al. (2009) S. Medvedev, T. M. McQueen, I. A. Troyan, T. Palasyuk, M. I. Eremets, R. J. Cava, S. Naghavi, F. Casper, V. Ksenofontov, G. Wortmann, and C. Felser, Nat. Mater. 8, 630 (2009).
- Glasbrenner et al. (2015) J. K. Glasbrenner, I. I. Mazin, H. O. Jeschke, P. J. Hirschfeld, R. M. Fernandes, and R. Valentí, Nat. Phys. 11, 953 (2015).
- Wang et al. (2015) F. Wang, S. A. Kivelson, and D.-H. Lee, Nat. Phys. 11, 959 (2015).
- Chubukov et al. (2015) A. V. Chubukov, R. M. Fernandes, and J. Schmalian, Phys. Rev. B 91, 201105 (2015).
- Yu and Si (2015) R. Yu and Q. Si, Phys. Rev. Lett. 115, 116401 (2015).
- Wang et al. (2012) Q.-Y. Wang, Z. Li, W.-H. Zhang, Z.-C. Zhang, J.-S. Zhang, W. Li, H. Ding, Y.-B. Ou, P. Deng, K. Chang, J. Wen, C.-L. Song, K. He, J.-F. Jia, S.-H. Ji, Y.-Y. Wang, L.-L. Wang, X. Chen, X.-C. Ma, and Q.-K. Xue, Chin. Phys. Lett. 29, 037402 (2012).
- Ge et al. (2015) J.-F. Ge, Z.-L. Liu, C. Liu, C.-L. Gao, D. Qian, Q.-K. Xue, Y. Liu, and J.-F. Jia, Nat. Mater. 14, 285 (2015).
- Hsu et al. (2008) F.-C. Hsu, J.-Y. Luo, K.-W. Yeh, T.-K. Chen, T.-W. Huang, P. M. Wu, Y.-C. Lee, Y.-L. Huang, Y.-Y. Chu, D.-C. Yan, and M.-K. Wu, Proc. Natl. Acad. Sci. 105, 14262 (2008).
- Miyata et al. (2015) Y. Miyata, K. Nakayama, K. Sugawara, T. Sato, and T. Takahashi, Nat. Mater. 14, 775 (2015).
- Wen et al. (2016) C. H. P. Wen, H. C. Xu, C. Chen, Z. C. Huang, X. Lou, Y. J. Pu, Q. Song, B. P. Xie, M. Abdel-Hafiez, D. A. Chareev, A. N. Vasiliev, R. Peng, and D. L. Feng, Nat. Commun. 7, 10840 (2016).
- Kamihara et al. (2008) Y. Kamihara, T. Watanabe, M. Hirano, and H. Hosono, J. Am. Chem. Soc 130, 3296 (2008).
- Yeh et al. (2008) K.-W. Yeh, T.-W. Huang, Y. lin Huang, T.-K. Chen, F.-C. Hsu, P. M. Wu, Y.-C. Lee, Y.-Y. Chu, C.-L. Chen, J.-Y. Luo, D.-C. Yan, and M.-K. Wu, Europhys. Lett. 84, 37002 (2008).
- Yin et al. (2009) Y. Yin, M. Zech, T. L. Williams, X. F. Wang, G. Wu, X. H. Chen, and J. E. Hoffman, Phys. Rev. Lett. 102, 097002 (2009).
- Song et al. (2013) C.-L. Song, Y. Yin, M. Zech, T. Williams, M. M. Yee, G.-F. Chen, J.-L. Luo, N.-L. Wang, E. W. Hudson, and J. E. Hoffman, Phys. Rev. B 87, 214519 (2013).
- Balatsky et al. (2006) A. V. Balatsky, I. Vekhter, and J.-X. Zhu, Rev. Mod. Phys. 78, 373 (2006).
- Kashiwaya and Tanaka (2000) S. Kashiwaya and Y. Tanaka, Rep. Prog. Phys. 63, 1641 (2000).
- Sessi et al. (2009) P. Sessi, J. R. Guest, M. Bode, and N. P. Guisinger, Nano Lett. 9, 4343 (2009).
- Weber et al. (2012) B. Weber, S. Mahapatra, H. Ryu, S. Lee, A. Fuhrer, T. C. G. Reusch, D. L. Thompson, W. C. T. Lee, G. Klimeck, L. C. L. Hollenberg, and M. Y. Simmons, Science 335, 64 (2012).
- Kitchen et al. (2006) D. Kitchen, A. Richardella, J.-M. Tang, M. E. Flatté, and A. Yazdani, Nature 442, 436 (2006).
- Song et al. (2012) C.-L. Song, Y.-L. Wang, Y.-P. Jiang, L. Wang, K. He, X. Chen, J. E. Hoffman, X.-C. Ma, and Q.-K. Xue, Phys. Rev. Lett. 109, 137004 (2012).
- Song et al. (2011a) C.-L. Song, Y.-L. Wang, Y.-P. Jiang, Z. Li, L. Wang, K. He, X. Chen, X.-C. Ma, and Q.-K. Xue, Phys. Rev. B 84, 020503 (2011a).
- Oxf (2008) Evaporation Guide for the Elements, Oxford Vacuum Science (2008).
- Song et al. (2011b) C.-L. Song, Y.-L. Wang, P. Cheng, Y.-P. Jiang, W. Li, T. Zhang, Z. Li, K. He, L. Wang, J.-F. Jia, H.-H. Hung, C. Wu, X. Ma, X. Chen, and Q.-K. Xue, Science 332, 1410 (2011b).
- Huang et al. (2015) D. Huang, C.-L. Song, T. A. Webb, S. Fang, C.-Z. Chang, J. S. Moodera, E. Kaxiras, and J. E. Hoffman, Phys. Rev. Lett. 115, 017002 (2015).
- Huang et al. (2016) D. Huang, T. A. Webb, S. Fang, C.-L. Song, C.-Z. Chang, J. S. Moodera, E. Kaxiras, and J. E. Hoffman, Phys. Rev. B 93, 125129 (2016).
- Kasahara et al. (2014) S. Kasahara, T. Watashige, T. Hanaguri, Y. Kohsaka, T. Yamashita, Y. Shimoyama, Y. Mizukami, R. Endo, H. Ikeda, K. Aoyama, T. Terashima, S. Uji, T. Wolf, H. von Löhneysen, T. Shibauchi, and Y. Matsuda, Proc. Natl. Acad. Sci. 111, 16309 (2014).
- Watashige et al. (2015) T. Watashige, Y. Tsutsumi, T. Hanaguri, Y. Kohsaka, S. Kasahara, A. Furusaki, M. Sigrist, C. Meingast, T. Wolf, H. v. Löhneysen, T. Shibauchi, and Y. Matsuda, Phys. Rev. X 5, 031022 (2015).
- Du et al. (2016) Z. Du, X. Yang, H. Lin, D. Fang, G. Du, J. Xing, H. Yang, X. Zhu, and H.-H. Wen, Nat. Commun. 7, 10565 (2016).
- Yan et al. (2015) Y. J. Yan, W. H. Zhang, M. Q. Ren, X. Liu, X. F. Lu, N. Z. Wang, X. H. Niu, Q. Fan, J. Miao, R. Tao, B. P. Xie, X. H. Chen, T. Zhang, and D. L. Feng, ArXiv e-prints (2015), arXiv:1507.02577 [cond-mat.supr-con] .
- McQueen et al. (2009) T. M. McQueen, A. J. Williams, P. W. Stephens, J. Tao, Y. Zhu, V. Ksenofontov, F. Casper, C. Felser, and R. J. Cava, Phys. Rev. Lett. 103, 057002 (2009).
- Shimojima et al. (2014) T. Shimojima, Y. Suzuki, T. Sonobe, A. Nakamura, M. Sakano, J. Omachi, K. Yoshioka, M. Kuwata-Gonokami, K. Ono, H. Kumigashira, A. E. Böhmer, F. Hardy, T. Wolf, C. Meingast, H. v. Löhneysen, H. Ikeda, and K. Ishizaka, Phys. Rev. B 90, 121111 (2014).
- Nakayama et al. (2014) K. Nakayama, Y. Miyata, G. N. Phan, T. Sato, Y. Tanabe, T. Urata, K. Tanigaki, and T. Takahashi, Phys. Rev. Lett. 113, 237001 (2014).
- Watson et al. (2015) M. D. Watson, T. K. Kim, A. A. Haghighirad, N. R. Davies, A. McCollam, A. Narayanan, S. F. Blake, Y. L. Chen, S. Ghannadzadeh, A. J. Schofield, M. Hoesch, C. Meingast, T. Wolf, and A. I. Coldea, Phys. Rev. B 91, 155106 (2015).
- Zhang et al. (2015) P. Zhang, T. Qian, P. Richard, X. P. Wang, H. Miao, B. Q. Lv, B. B. Fu, T. Wolf, C. Meingast, X. X. Wu, Z. Q. Wang, J. P. Hu, and H. Ding, Phys. Rev. B 91, 214503 (2015).
- Böhmer et al. (2013) A. E. Böhmer, F. Hardy, F. Eilers, D. Ernst, P. Adelmann, P. Schweiss, T. Wolf, and C. Meingast, Phys. Rev. B 87, 180505 (2013).
- Kresse and Furthmüller (1996a) G. Kresse and J. Furthmüller, Comp. Mater. Sci. 6, 15 (1996a).
- Kresse and Furthmüller (1996b) G. Kresse and J. Furthmüller, Phys. Rev. B 54, 11169 (1996b).
- Perdew et al. (1996) J. P. Perdew, K. Burke, and M. Ernzerhof, Phys. Rev. Lett. 77, 3865 (1996).
- Methfessel and Paxton (1989) M. Methfessel and A. T. Paxton, Phys. Rev. B 40, 3616 (1989).
- Grimme (2006) S. Grimme, J. Comput. Chem. 27, 1787 (2006).
- Ricci and Profeta (2013) F. Ricci and G. Profeta, Phys. Rev. B 87, 184105 (2013).
- Okabe et al. (2010) H. Okabe, N. Takeshita, K. Horigane, T. Muranaka, and J. Akimitsu, Phys. Rev. B 81, 205119 (2010).
- Morgan et al. (1999) C. G. Morgan, P. Kratzer, and M. Scheffler, Phys. Rev. Lett. 82, 4886 (1999).
- Choubey et al. (2014) P. Choubey, T. Berlijn, A. Kreisel, C. Cao, and P. J. Hirschfeld, Phys. Rev. B 90, 134520 (2014).
- Li et al. (2014) Z. Li, J.-P. Peng, H.-M. Zhang, W.-H. Zhang, H. Ding, P. Deng, K. Chang, C.-L. Song, S.-H. Ji, L. Wang, K. He, X. Chen, Q.-K. Xue, and X.-C. Ma, J. Phys. Condens. Matter 26, 265002 (2014).
- Blöchl et al. (1994) P. E. Blöchl, O. Jepsen, and O. K. Andersen, Phys. Rev. B 49, 16223 (1994).
- Mills et al. (1995) G. Mills, H. Jónsson, and G. K. Schenter, Surface Science 324, 305 (1995).
- Jónsson et al. (1998) H. Jónsson, G. Mills, and K. W. Jacobsen, in Classical and Quantum Dynamics in Condensed Phase Simulations, edited by B. J. Berne, G. Ciccotti, and D. F. Coker (World Scientific, 1998) p. 385.
- Vineyard (1957) G. H. Vineyard, J. Phys. Chem. Solids 3, 121 (1957).
- Pandey and Kaxiras (1991) K. C. Pandey and E. Kaxiras, Phys. Rev. Lett. 66, 915 (1991).
- Chen et al. (2014) T.-K. Chen, C.-C. Chang, H.-H. Chang, A.-H. Fang, C.-H. Wang, W.-H. Chao, C.-M. Tseng, Y.-C. Lee, Y.-R. Wu, M.-H. Wen, H.-Y. Tang, F.-R. Chen, M.-J. Wang, M.-K. Wu, and D. Van Dyck, Proc. Natl. Acad. Sci. 111, 63 (2014).
- Guo et al. (2010) J. Guo, S. Jin, G. Wang, S. Wang, K. Zhu, T. Zhou, M. He, and X. Chen, Phys. Rev. B 82, 180520 (2010).
- Wang et al. (2011a) A. F. Wang, J. J. Ying, Y. J. Yan, R. H. Liu, X. G. Luo, Z. Y. Li, X. F. Wang, M. Zhang, G. J. Ye, P. Cheng, Z. J. Xiang, and X. H. Chen, Phys. Rev. B 83, 060512 (2011a).
- Wang et al. (2011b) Z. Wang, Y. J. Song, H. L. Shi, Z. W. Wang, Z. Chen, H. F. Tian, G. F. Chen, J. G. Guo, H. X. Yang, and J. Q. Li, Phys. Rev. B 83, 140505 (2011b).
- Ricci et al. (2011) A. Ricci, N. Poccia, G. Campi, B. Joseph, G. Arrighetti, L. Barba, M. Reynolds, M. Burghammer, H. Takeya, Y. Mizuguchi, Y. Takano, M. Colapietro, N. L. Saini, and A. Bianconi, Phys. Rev. B 84, 060511 (2011).
- Li et al. (2011) W. Li, H. Ding, P. Deng, K. Chang, C. Song, K. He, L. Wang, X. Ma, J.-P. Hu, X. Chen, and Q.-K. Xue, Nat. Phys. 8, 126 (2011).
- Li et al. (2012) W. Li, H. Ding, Z. Li, P. Deng, K. Chang, K. He, S. Ji, L. Wang, X. Ma, J.-P. Hu, X. Chen, and Q.-K. Xue, Phys. Rev. Lett. 109, 057003 (2012).
- Ding et al. (2013) X. Ding, D. Fang, Z. Wang, H. Yang, J. Liu, Q. Deng, G. Ma, C. Meng, Y. Hu, and H.-H. Wen, Nat. Commun. 4, 1897 (2013).
Supporting Information for:
Dumbbell Defects in FeSe Films:
A Scanning Tunneling Microscopy and First-Principles Investigation
Dennis Huang, Tatiana A. Webb, Can-Li Song, Cui-Zu Chang, Jagadeesh S. Moodera, Efthimios Kaxiras, and Jennifer E. Hoffman
I Additional defect configurations
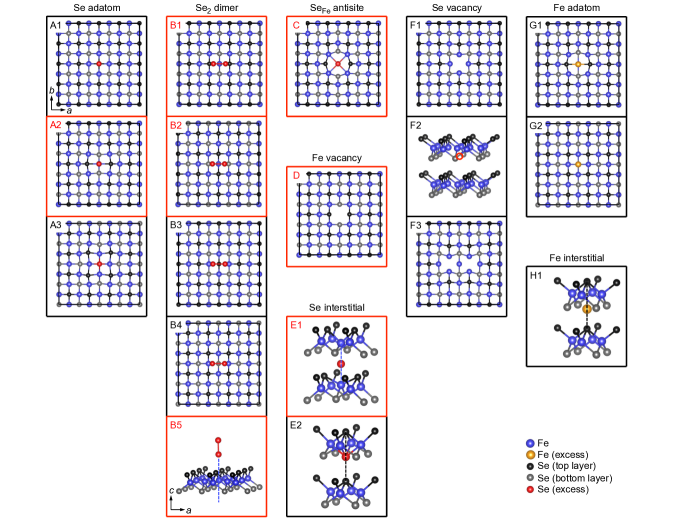
Figure S1 shows all defect configurations examined in this work, which fall into eight categories: (A) Se adatoms, (B) Se2 dimers, (C) Se antisites, (D) Fe vacancies, (E) Se interstitials, (F) Se vacancies, (G) Fe adatoms, and (H) Fe interstitials. Their corresponding formation energies in the monolayer and bilayer FeSe supercells are plotted in Fig. S2. Se-rich configurations that are laterally centered at an Fe site, consistent with the STM dumbbell signature, are enclosed in a red box in Fig. S1.
II Selenium chemical potential
Following Ref. Reuter and Scheffler (2001), we estimate the experimental chemical potential of Se using ideal gas approximations and tabulated thermodynamic quantities. Under fixed temperature and pressure , the chemical potential of an ideal gas of Se2 molecules is related to the Gibbs free energy as
| (S1) |
where is the number of Se2 molecules. First, we compute at standard conditions ( = 298.15 K, = 1 bar),
| (S2) |
using enthalpy and entropy values derived from thermochemistry references. Next, we extrapolate to desired temperatures using reference heat capacity data,
| (S3) |
and desired pressures using ideal gas relationships,
| (S4) |
We make some practical remarks on estimating :
(1) To maintain consistency with DFT calculations and total energies () defined in VASP, we set for an isolated Se atom.
(2) Based on the chosen reference, we compute in a two-step process:
| (S5) |
(3) From p. 40 of Ref. Åke Olin et al. (2005), = JK-1mol-1.
(4) From p. 63 of Ref. Åke Olin et al. (2005), , where = JK-1mol-1, = JK-2mol-1, = JK-3mol-1, = Jmol-1, and = JKmol-1. These values are valid from = 298 K to 1300 K.
(5) We choose to be the substrate temperature and to be the Se partial pressure in the chamber, based on quasi-equilibrium growth assumptions suggested for similar III-V semiconductor MBE processes Kratzer et al. (1999); Tersoff et al. (1997). For = 400 ∘C and = 10-9 T, we find that = 3.35 eV. For = 500 ∘C and = 10-10 T, we find that = 3.70 eV.
III Simulated STM topographies
To simulate the STM topography of an Fe vacancy site, we use DFT to compute the real-space charge density, integrated from the Fermi energy up to 50 meV. We then trace the height variation () for a given isosurface of charge density (). As shown in Fig. S3, the value of chosen does not qualitatively affect the simulated topography, but we pick to be clearly in the regime of exponential decay.
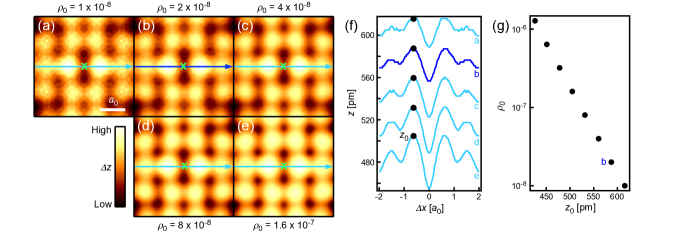
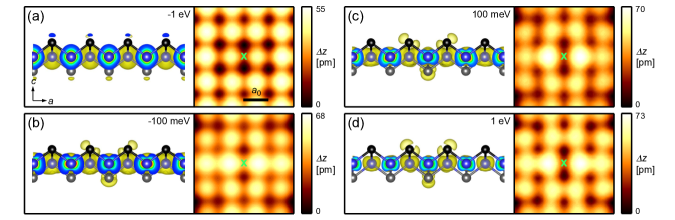
Figure S4 shows STM topographic simulations of an Fe vacancy with different imaging biases , carried out by integrating the charge density from the Fermi energy to . We note that experimental FeSe bands exhibits orbital-dependent renormalization with an average factor = 1/6 relative to LDA/GGA-calculated bands Maletz et al. (2014); Watson et al. (2015); Mukherjee et al. (2015), precluding a more detailed ab-initio analysis of STM defect signatures.
IV Vineyard transition-rate theory
The classical probability distribution for an ensemble of identical, non-interacting particles moving in a 1D potential is given by
| (S6) |
where is the particle mass, is its velocity, and is a normalization constant. We consider a finite spatial region in phase space, , with a potential barrier peaked at . The average transition rate is given by , where is the phase space current across the barrier and is the number of states in Vineyard (1957). From Eq. (S6), we find that
| (S7) |
and
| (S8) |
which yields
| (S9) |
In our application to an Fe atom hopping to a neighboring vacant site in FeSe, we take , and to be the DFT total energy along the diffusion path, parameterized by the position of the moving Fe atom Kaxiras and Pandey (1993).
V vacancy order
We show that a ordering of Fe vacancies in FeSe is thermodynamically stable under excess Se flux. Following the same reasoning in the main text, the formation energy of Fe1-xSe, where , is given by
| (S10) |
We consider two concentrations:
(1) Dilute: = 0.03125. This value corresponds to one Fe vacancy in a monolayer 44 supercell [Fig. S5(a)].
(2) Fe vacancy order: = 0.2. For this DFT calculation, we use a monolayer supercell [Fig. S5(b)] with 551 BZ sampling.
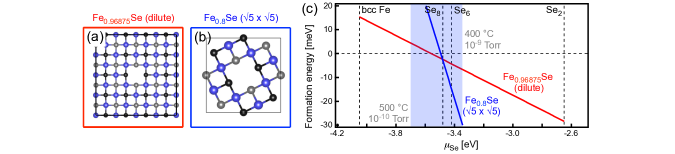
Figure S5(c) demonstrates that within a narrow range of viable values, the Fe vacancy superstructure is more energetically favorable compared to a dilute Fe vacancy.
References
- Reuter and Scheffler (2001) K. Reuter and M. Scheffler, Phys. Rev. B 65, 035406 (2001).
- Åke Olin et al. (2005) Åke Olin, B. Noläng, L.-O. Öhman, E. Osadchii, and E. Rosén, Chemical Thermodynamics of Selenium, Vol. 7 (Nuclear Energy Agency, 2005).
- Kratzer et al. (1999) P. Kratzer, C. G. Morgan, and M. Scheffler, Phys. Rev. B 59, 15246 (1999).
- Tersoff et al. (1997) J. Tersoff, M. D. Johnson, and B. G. Orr, Phys. Rev. Lett. 78, 282 (1997).
- Maletz et al. (2014) J. Maletz, V. B. Zabolotnyy, D. V. Evtushinsky, S. Thirupathaiah, A. U. B. Wolter, L. Harnagea, A. N. Yaresko, A. N. Vasiliev, D. A. Chareev, A. E. Böhmer, F. Hardy, T. Wolf, C. Meingast, E. D. L. Rienks, B. Büchner, and S. V. Borisenko, Phys. Rev. B 89, 220506 (2014).
- Watson et al. (2015) M. D. Watson, T. K. Kim, A. A. Haghighirad, N. R. Davies, A. McCollam, A. Narayanan, S. F. Blake, Y. L. Chen, S. Ghannadzadeh, A. J. Schofield, M. Hoesch, C. Meingast, T. Wolf, and A. I. Coldea, Phys. Rev. B 91, 155106 (2015).
- Mukherjee et al. (2015) S. Mukherjee, A. Kreisel, P. J. Hirschfeld, and B. M. Andersen, Phys. Rev. Lett. 115, 026402 (2015).
- Vineyard (1957) G. H. Vineyard, J. Phys. Chem. Solids 3, 121 (1957).
- Kaxiras and Pandey (1993) E. Kaxiras and K. C. Pandey, Phys. Rev. B 47, 1659 (1993).