Photo-enhanced magnetization in Fe-doped ZnO nanowires
Abstract
An emerging branch of electronics, the optospintronics, would be highly boosted if the control of magnetic order by light is implemented in magnetic semiconductors nanostructures being compatible with the actual technology. Here we show that the ferromagnetic magnetization of low Fe-doped ZnO nanowires prepared by carbothermal process is enhanced under illumination up to temperatures slightly below room temperature. This enhancement is related to the existence of an oxygen vacancy VO in the neighbouring of an antiferromagnetic superexchange Fe3+-Fe3+ pair. Under illumination the VO is ionized to V giving an electron to a close Fe3+ ion from the antiferromagnetic pair. This light excited electron transition allows the transition of Fe3+ to Fe2+ forming stable ferromagnetic double exchange pairs, increasing the total magnetization. The results here presented indicate an efficient way to influence the magnetic properties of ZnO based nanostructures by light illumination at high temperatures.
Magnetic materials with addressable electrical and/or optical properties may add flexibility and larger storage density to spintronics devices. The photo-induced magnetization (PIM) of materials is of interest, because it would lead to the development of optospintronic devices. The PIM phenomenon has been found below a temperature of K in cobalt-iron cyanide-based Prussian blue analogSato et al. (1996), K for magnetic semiconductor heterostructuresKoshihara et al. (1997) and K for core-shell nanostructures Koshihara et al. (2012). Recently, PIM after irradiation of polarized light in oxygen-deficient SrTiO3 and at K has been reportedRice et al. (2014), revealing the importance of certain defects for a possible manipulation of magnetization by light. The photo induced magnetization has also been observed at room temperature, RT, in non-epitaxial film with a Nano-crystallite size of 17nm Bettinger et al. (2009). The results in Ref. [5] suggested that a a stronger spin-orbit interaction given by small crystallite size samples is essential to generate the PIM in manganese zinc ferrite films Bettinger et al. (2009). However, it hinders the possible applications in spintronic since small spin-orbit interaction is ideally required for a larger spin coherence length. In particular, this is the case of ZnO based DMS materials, which are ideal candidates not only due to the large spin coherence lengthAlthammer et al. (2012), but also because of the observed variation in the optoelectronic properties at low magnetic fields, i.e. 0.4 T.Lorite et al. (2015). In fact, studies have already been performed in colloidal nanocrystals of Mn2+ doped ZnO showing a PIM property but only below K as shown by magnetization measurements.Ochsenbein et al. (2009) It is, therefore, of interest to further study PIM in magnetic semiconductors like ZnO and try to get this phenomenon at higher temperatures. In the present work, we report on the magnetic properties of low Fe-doped ZnO nanowires (NWs) under the influence of light irradiation. Fe doping and the ionization of oxygen vacancies are found to be the key to observe PIM in nanowires up to K. The PIM effect is observed only for Fe-doped ZnO deficient in oxygen.
The Fe-doped ZnO (ZF) nanowires were prepared by a carbothermal process explained elsewhereAleman et al. (2011); Lorite et al. (2014). A mixture of ZnO/Fe3O4/Carbon in the weight proportion of 30%/20%/50% was pressed applying 4 kPa to form a pellet of 2 mm diameter. The pellet was kept in a furnace at 1150C for one hour and then cooled down to room temperature. A white foam-like powder formed by NWs was obtained on the wall at a distance of 15 cm from the center of tubular furnace.
The magnetic moment of a bundle of NWs was measured using a superconducting quantum interference device magnetometer (SQUID) from Quantum Design. The measurements of magnetization under illumination were performed with a Xe-lamp coupled to the SQUID. The light was guided by an optical fiber to the sample. The wavelength was selected by using the corresponding filters. The light intensity was kept low in order not to increase the sample temperature at the lowest measured temperatures.
Photoluminescence (PL) of the NWs at room temperature was excited by the 325 nm line of a He-Cd KIMMON IK3301R-G laser operating in continuous-wave mode, spectrally dispersed by a 320 mm HORIBA JOBIN YVON iHR320 monochromator and detected by a Peltier-cooled CCD camera. X-ray diffraction measurements were performed using Philips Xpert diffractometer and Raman spectroscopy at room temperature was performed with a micro-Raman Jobin Yvon U1000 double spectrometer with excitation light of 532 nm and with a liquid nitrogen cooled CCD detector. EPR measurements were carried out with a BRUKER EMX Micro X-band spectrometer at 9.41 GHz. The Q-band cw EPR spectra were recorded with a BRUKER EMX 10-40 spectrometer operating at 34 GHz. EPR spectra were simulated using the Easy Spin Matlab toolbox Stoll and Schweiger (2006).
Scanning electron microscopy (SEM) measurements revealed that the synthesized wires have a diameter of 130 nm and several micrometers length. The XRD pattern of a bundle of ZF NWs along with that of undoped ZnO. The XRD results indicate the existence of diffraction peaks of hexagonal ZnO as a single phase with no presence of secondary phases or Fe clusters, within experimental resolution. Particle induced x-ray emission (PIXE) measurements were carried out to quantify the amount of Fe in the NWs. We found a Fe concentration of at.%. This Fe concentration is slightly smaller that the previously reported Fe-solubility limit in ZnO Aleman et al. (2011).
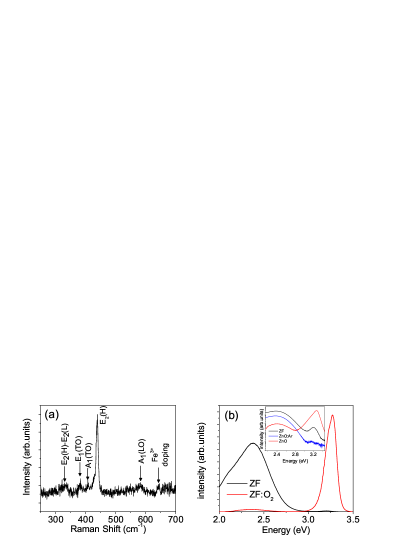
Raman spectroscopy allows the observation of small amount of impurities, extra phases or dopant in ZnOBundesmann et al. (2003); Lorite et al. (2009). In agreement with the XRD results, signatures of secondary phases have not been found in the Raman spectrum of the studied NWs, see Fig. 1, which shows the typical modes observed for ZnOBundesmann et al. (2003). Note that the longitudinal vibrational mode A1(LO) at 586 cm-1 is related to oxygen vacancies VO. An additional feature, observed at 644 cm-1, has been previously related to the incorporation of Fe3+ ions at Zn sites Bundesmann et al. (2003).
The existence of VO was corroborated by PL measurements. Figure 1(b) shows the PL spectrum of the as grown Fe-doped ZnO NWs, which presents two different bands, i.e. a band edge emission and a defect level emission. The band edge emission at an energy 3.2 eV (wavelength nm) is attributed to the recombination of free excitons and their phonon replicaShan et al. (2005). The broad band at 2…2.75 eV (600…450 nm) represents the defect level emission or green luminescence, which is commonly related to different type of lattice defects in the ZnO latticeAleman et al. (2011). After an annealing at 400°C for the oxygenation of the NWs, the observed green luminescence intensity is drastically reduced, see Fig. 1(b). It suggests that it is mostly produced by VO’s. These vacancies are removed by the oxygen incorporation during the annealing treatment. It is important to mention that most of the VO’s in ZnO NWs are defects localized at the near surface region. The concentration of VO’s decreases strongly to the interior of NWsWong et al. (2013), this facilitates its removal with low-temperature annealing treatments in oxygen atmosphere.
.
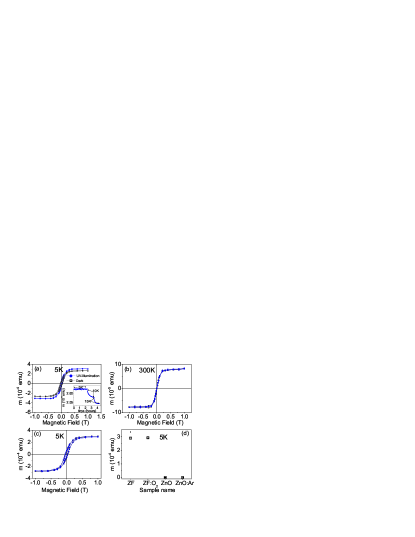
The change of the magnetic moment of the samples with light has been measured in Fe-doped and undoped ZnO NWs, before and after annealing in O2 atmosphere. Figure 2(a,b) shows the field hysteresis of the as prepared ZF NWs, in dark and in light; all samples of 6 mg mass. The data here presented are after subtraction of a linear in field background. This background is due to the intrinsic diamagnetic contribution of ZnO and the sample holder where the samples were placed and a small paramagnetic (PM) contribution. Assuming a Curie-law temperature dependence for the PM contribution and a temperature independent diamagnetic one, we estimate a PM contribution of the order of of the total Fe concentration in the ZF NWs, assuming per ion.
In dark conditions all the studied ZF NWs exhibit ferromagnetic ordering with a magnetic moment at saturation of 3.1 10-4 emu and 7.9 10-4 emu at 5 K and 300 K, respectively (see Fig. 2(a,b)). The measured magnetic moment at saturation would correspond to /Fe (at 5 K), a value smaller than the reported value in literatureKarmakar et al. (2007). Note that the Curie temperature K, in spite of the very low concentration of Fe. This fact suggests that regions should exist with a Fe concentration larger than the average 0.2 at to trigger magnetic order above room temperature, likely due to double exchange. The estimated low magnetic moment of Fe would also indicate that in addition to the FM contribution, Fe ions can also couple antiferromagneticaly (AFM) by super-exchange interactionKarmakar et al. (2007); Kodama and Berkowitz (1999), in addition to the paramagnetic contribution. Taking into account the value of per Fe for double exchange couple pairsKarmakar et al. (2007); Kodama and Berkowitz (1999), we estimate that of the Fe concentration is responsible for the FM signal, whereas most of the remaining Fe ions should be AFM ordered.
After measuring the magnetic moment of the as-prepared ZF NWs in dark, we illuminate them with light of wavelength = 425 nm. Figure 2(a) shows the observed increase in the magnetic moment of at saturation under light and at 5 K. At this low temperature the increase in the magnetic moment with light has a persistent character after switching the light off. This persistent light-driven enhancement of the ferromagnetic moment decreases with temperature, see inset in Figure 2(a). The same set of experiments were performed at different = 360nm, 545nm, 690nm, however no change in the magnetization was detected within a relative resolution of , indicating that a specific range of wavelength is needed to obtain the PIM effect
As shown previously, ZF NWs exhibit a green emission, see Fig. 1(b), mostly due to the existence of VO’s in the as-prepared NWs. To check for their role in the observed PIM, we explored the effect in the ZF NWs after annealing them in oxygen, see Fig. 1(b), removing in this way a large part of the VO’s. After reducing the oxygen vacancies content we measured the same magnetic moment as in the as-prepared NWs, in dark but also under illumination. This result indicates that the VO’s are important only for the PIM effect. Finally, to clarify the importance of Fe doping, similar experiments were performed in non-magnetic, pure ZnO as-prepared as well as after Ar annealing to produce VO’s. This was corroborated by photoluminescence by the observation of the increase of the green band, in comparison to untreated pure ZnO, with an intensity comparable to the one observed in ZF NWs, see inset in Fig. 1(b). Ferromagnetic order in the ZnO NWs, independently of their VO’s concentrations, was observed neither in dark conditions nor under illumination. All these results indicate that both, Fe and VO’s are necessary to observe the PIM effect in ZnO.
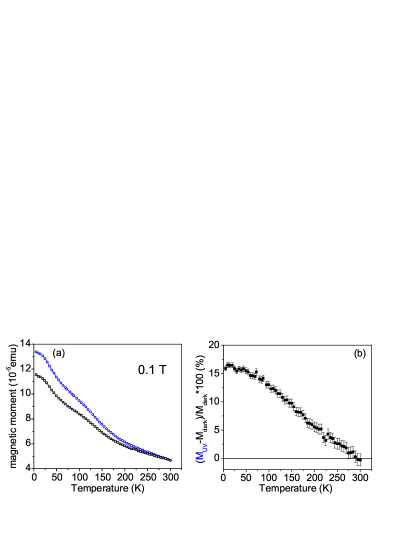
We measured the temperature dependence of the enhanced magnetization under constant UV illumination. The results are shown in Fig. 3(a). We observe that the enhancement, given by the difference between the results with and without light, decreases linearly with temperature above 50 K, see Fig. 3(b), vanishing at 270 K. This behavior can be an indication of the existence of spin waves in two dimensions (2D), as previously observed in defect-induced magnetic graphite after proton irradiationBarzola-Quiquia et al. (2007). This apparent 2D dimensionality of the the PIM effect in our ZF NWs agrees with the expectation that the near surface region is the one where the PIM effect originates.
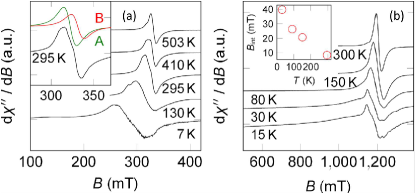
To further clarify the mechanisms behind the magnetic order and the PIM origin observed in the ZF NWs, electronic paramagnetic resonance (EPR) measurements were performed between 7 K and 503 K. In Fig. 4 EPR measurements of a bundle of ZF NWs at X- and Q-band frequencies are presented. At room temperature the X-band measurements show a broad signal around . Attributing these signals to Fe3+ ions we suggest that Fe3+ is not magnetically diluted and magnetic dipolar and exchange interactions between Fe-ions lead to a coalescence of the fine structure pattern of Fe3+. The signal can be simulated by two main species, A and B, see inset in Fig. 4 (a), which are observed in a wide temperature range. The X-band measurements show an apparent -value increase from 2.03 at 503 K to about 2.35 at 7 K. To study the nature of the EPR signals, Q-band measurements were conducted, see Fig. 4(b). Here we observe a slight increase of the -factor from 2.035 at room temperature to 2.06 at 15 K, suggesting the presence of temperature dependent internal fields which can be estimated from the comparison of the X-band and Q-band spectra Fainstein et al. (1999) and are shown in the inset of Fig. 4(b). This allows us to recalculate the real value of at room temperature in good agreement with the value for Fe3+.Fainstein et al. (1999) Additionally, we observe that the line width increases towards lower temperatures, see Fig. 4(a), suggesting that the Fe ions observed by EPR do not couple ferromagneticallySchulz et al. (1994) but an antiferromagnetic coupling exists. With the presence of internal fields attributed to Fe-ions ferromagnetically coupled, the overall EPR results support the interpretation of the magnetization that both FM and AFM ordered Fe-ions co-exist in the studied NWs de Wijn et al. (1972).
As noted above, to explain the observed magnetic order at such high temperatures and with such small Fe concentration, we need to assume the formation of a non homogeneous distribution of Fe-ions which allows the co-existence of FM, Fe2+-Fe3+, and AFM regions, Fe3+-Fe3+. Moreover, the VO’s can be placed in the neighboring of an AFM couple. By light illumination the mention VO can be ionized to form V. When the VO is close to an Fe3+, this photo-ionization can produce an electron transfer from the VO to the nearby Fe3+ ion transforming it into Fe2+. This will produce Fe2+-Fe3+ FM couple pairs increasing the density of double exchange couples that contribute to the FM order in detriment of the pairs AFM ordered.
The found PIM effect in ZnO doped with a nominally low concentration of Fe and our interpretation based on the light-induced ionization of the oxygen vacancies near Fe ions, localized mainly at the surface of the NWs, shed light to the possibility to explore light-induced magnetism in semiconductors at much higher temperatures than the ones reported previously. The effect found in our study could be applied to other type of oxides in which the ionization of vacancies by light is possible. The PIM effect and the possibility to have it in nanostructures as small or smaller than in our NWs, should substantially support a further development of magnetic semiconductors for optospintronics application at technologically relevant wavelengths.
Acknowledgements.
This work was partially supported by CIUNT under Grants 26/E439 and 26/E478, by ANPCyT-PICTR 35682, and by the Collaborative Research Center SFB 762 “Functionality of Oxide Interfaces”. We are grateful for the support within the DFG priority program SPP 1601 “New Frontiers in Sensitivity for EPR Spectroscopy”.References
- Sato et al. (1996) O. Sato, T. Iyoda, A. Fujishima, and K. Hashimoto, Science 272, 704 (1996).
- Koshihara et al. (1997) S. Koshihara, A. Oiwa, M. Hirasawa, S. Katsumoto, Y. Iye, C. Urano, H. Takagi, and H. Munekata, Phys. Rev. Lett. 78, 4617 (1997).
- Koshihara et al. (2012) S. Koshihara, A. Pandey, S. Brovelli, R. Viswanatha, L. Li, J. M. Pietryga, V. I. Klimov, and S. A. Crooker, Nature Nanotechnology 7, 792 (2012).
- Rice et al. (2014) W. D. Rice, P. Ambwani, M. Bombeck, J. D. Thompson, G. Haugstad, C. Leighton, and S. A. Crooker, Nature Materials 13, 481 (2014).
- Bettinger et al. (2009) J. S. Bettinger, R. V. Chopdekar, and Y. Suzuki1, Appl. Phys. Lett. 94, 072505 (2009).
- Althammer et al. (2012) M. Althammer, E.-M. Karrer-Müller, S. T. B. Goennenwein, M. Opel, and R. Gross, Appl. Phys. Lett. 111, 082404 (2012).
- Lorite et al. (2015) I. Lorite, Y. Kumar, P. Esquinazi, C. Zandalazini, and S. P. de Heluani, Small 11, 4403 (2015).
- Ochsenbein et al. (2009) S. T. Ochsenbein, Y. Feng, K. M. Whitaker, E. Badaeva, W. K. Liu, X. Li, and D. R. Gamelin, Nature 4, 681 (2009).
- Aleman et al. (2011) B. Aleman, Y. Ortega, J. A. García, , P. Fernandez, and J. Piqueras, J. Appl.Phys. 110, 014317 (2011).
- Lorite et al. (2014) I. Lorite, P. Esquinazi, C. Zapata, and S. P. Heluani, Journal of Materials Research 29, 78 (2014).
- Stoll and Schweiger (2006) S. Stoll and A. Schweiger, Journal of Magnetic Resonance 178, 42 (2006).
- Bundesmann et al. (2003) C. Bundesmann, N. Ashkenov, M. Schubert, D. Spemann, T. Butz, E. M. Kaidashev, M. Lorenz, and M. Grundmann, Appl.Phys. Lett. 83, 1074 (2003).
- Lorite et al. (2009) I. Lorite, F. Rubio-Marcos, J. Romero, and J. Fernández, Materials Letters 63, 212 (2009).
- Shan et al. (2005) W. Shan, W. Walukiewicz, J. W. Ager, K. M. Yu, H. B. Yuan, H. P. Xin, G. Cantwell, and J. J. Song, Appl. Phys. Lett. 86, 191911 (2005).
- Wong et al. (2013) K. M. Wong, S. M. A. e Abbas, Y. Fang, A. Shaukat, and Y. Lei, J. Appl. Phys. 114, 8034901 (2013).
- Karmakar et al. (2007) D. Karmakar, S. K. Mandal, R. M. Kadam, P. L. Paulose, A. K. Rajarajan, T. K. Nath, A. K. Das, I. Dasgupta, and G. P. Das, Phys. Rev. B B, 75, 144404 (2007).
- Kodama and Berkowitz (1999) R. H. Kodama and A. E. Berkowitz, Phys. Rev. B 59, 6321 (1999).
- Barzola-Quiquia et al. (2007) J. Barzola-Quiquia, P. Esquinazi, M. Rothermel, D. Spemann, T. Butz, and N. García, Phys. Rev. B 176, 161403 (2007).
- Fainstein et al. (1999) A. Fainstein, E. Winkler, A. Butera, and J. Tallon, Phys. Rev. B (1999).
- Schulz et al. (1994) B. Schulz, R. Schwarzwald, and K. Baberschke, Surface Science , Part B, 1102, 307 (1994).
- de Wijn et al. (1972) H. de Wijn, L. Walker, j.L. Davis, and H. Guggenheim, Solid State Communications 11, 803 (1972).