Hot and dense water in the inner 25 AU of SVS13-A
Abstract
In the context of the ASAI (Astrochemical Surveys At IRAM) project, we carried out an unbiased spectral survey in the millimeter window towards the well known low-mass Class I source SVS13-A. The high sensitivity reached (3–12 mK) allowed us to detect at least 6 HDO broad (FWHM 4–5 km s-1) emission lines with upper level energies up to = 837 K. A non-LTE LVG analysis implies the presence of very hot (150–260 K) and dense ( 3 107 cm-3) gas inside a small radius ( 25 AU) around the star, supporting, for the first time, the occurrence of a hot corino around a Class I protostar.
The temperature is higher than expected for water molecules are sublimated from the icy dust mantles ( 100 K). Although we cannot exclude we are observig the effects of shocks and/or winds at such small scales, this could imply that the observed HDO emission is tracing the water abundance jump expected at temperatures 220–250 K, when the activation barrier of the gas phase reactions leading to the formation of water can be overcome. We derive 3 10-6, and a H2O deuteration 1.5 10-2, suggesting that water deuteration does not decrease as the protostar evolves from the Class 0 to the Class I stage.
keywords:
Molecular data – Stars: formation – radio lines: ISM – submillimetre: ISM – ISM: molecules1 Introduction
The origin of terrestrial water is still a source of intense debate (e.g. Ceccarelli et al. 2014; van Dischoeck et al. 2014; Altwegg et al. 2015). A key element to shed light on it, is how water evolves with time in proto-Sun analogues. Specifically, two aspects are particulary important: (1) the amount of water and its distribution in the planet formation region (a few tens of AU) of the proto-Suns, and (2) its deuterium fractionation (e.g. Ceccarelli et al. 2014; Willacy et al. 2015).
With respect to the first point, water has been detected at all stages of the Sun-like star formation process, from prestellar cores and Class 0 sources to the Solar System (e.g. Caselli et al. 2012; Ceccarelli et al. 1999; van Dishoeck et al. 2011, 2014). However, so far, we mostly have poor angular resolution observations that allowed us to detect the water emission, but not to resolve it on small ( AU) scales. Only a handful of observations exists with enough spatial resolution. They show that the water emission in the envelopes of Class 0 sources is concentrated in small regions, called hot corinos (Codella et al. 2010; Persson et al. 2013, 2014; Taquet et al. 2013; Coutens et al. 2014). On the contrary, no spatially resolved observations exist for the more evolved protostars, the Class I sources. With respect to the water deuterium fractionation, again only a few measures are available in Class 0 sources (Coutens et al. 2012, 2013, 2014; Persson et al. 2013, 2014; Taquet et al. 2013), but none in Class I.
In the context of the ASAI (Astrochemical Surveys At IRAM: http://www.oan.es/asai/) project, we have carried out a systematic study of the molecular emission towards SVS13-A. This is a well studied young stellar object located in the NGC1333 star-forming region, at a distance of 235 pc (Bachiller et al. 1998; Hirota et al. 2008; Lee et al. 2016). SVS13-A is part of the system SVS13, where three millimeter sources have been identified by interferometric observations (Bachiller et al. 1998; Looney et al. 2000), called A, B, and C. The distance between A and B is 15, while C is 20 away from A. The systemic velocity of the sources A and B is between +8 km s-1 and +9 km s-1 (Chen et al. 2009; Lopèz-Sepulcre et al. 2015). The luminosity of SVS13-A has been estimated to be 34 L⊙ (Chen et al. 2009; Tobin et al. 2016), where we corrected for the new estimate of the distance = 235 pc (Hirota et al. 2008).
Although SVS13-A is still deeply embedded in a large-scale (6000 AU; e.g. Lefloch et al. 1998) envelope, its extended (0.07 outflow pc) outflow, associated with the HH7-11 chain (e.g. Lefloch et al. 1998, and references therein), and its low Lsubmm/Lbol ratio ( 0.8 ) lead to the classification as a Class I source (e.g. Chen et al. 2009 and references therein).
In this Letter, we report the detection of several lines of HDO towards SVS13-A, providing the first detection of deuterated water in a Class I source.
2 Observations
The present observations have been performed during several runs between 2012 and 2014 with the IRAM 30-m telescope near Pico Veleta (Spain) in the context of the Astrochemical Surveys At IRAM111www.oan.es/asai (ASAI) Large Program. In particular, the unbiased spectral surveys at 3 mm (80–116 GHz), 2 mm (129–173 GHz), and 1.3 mm (200–276 GHz) have been acquired using the EMIR receivers with a spectral resolution of 0.2 MHz. The observations were performed in wobbler switching mode with a throw of 180 towards the coordinates of the SVS13-A object, namely = 03h 29m 0329, = +31 16 038). The pointing was checked by observing nearby planets or continuum sources and was found to be accurate to within 2–3. The HPBWs are in the 9–31 range.
The data were reduced with the the GILDAS–CLASS222http://www.iram.fr/IRAMFR/GILDAS package. Calibration uncertainties are 10% at 3mm and 20% at shorter wavelengths. All the spectra have been converted from antenna temperature to main beam temperature (), using the main beam efficiencies reported on the IRAM 30-m website333http://www.iram.es/IRAMES/mainWiki/Iram30mEfficiencies.
3 Results and discussion
3.1 HDO detected lines
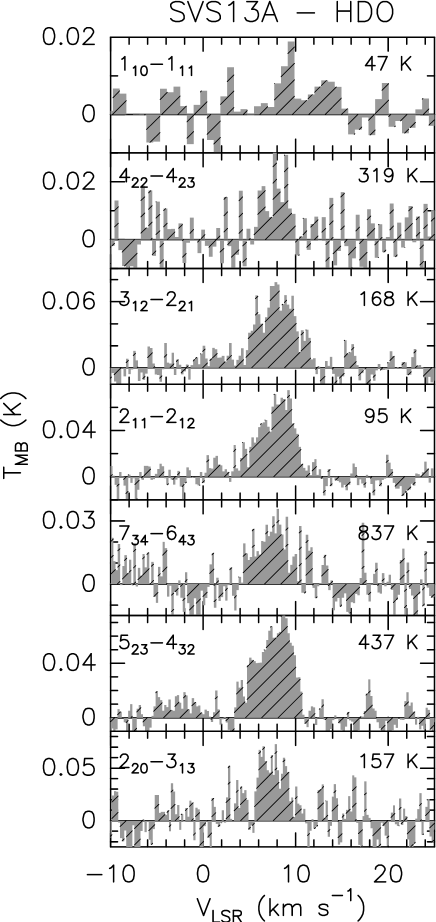
The ASAI unbiased survey allows us to detect 7 HDO lines (1 in the 3 mm band, 1 in the 2 mm band, and 5 in the 1.3 mm one) covering a wide range of excitation, with upper level energies Eu from 47 K to 837 K. The 81 GHz line is only tentatively detected, given the low S/N ratio. However, the following analysis will show how the 11,0–11,1 intensity is well in agreement with those of the other lines observed at 2mm and 1.3mm. The 33,1–42,2 transition (at 242.0 GHz) is the HDO line with the highest upper level energy (Eu=837 K) ever observed towards a low-mass protostar. The profiles of all detected lines are shown in Fig. 1, while Table 1 reports the results of the line Gaussian fits. The HDO emission peaks at the cloud systemic velocity, between +8.0 and +9.0 km s-1 (Chen et al. 2009; Lopèz-Sepulcre et al. 2015). The lines are quite broad, with a 4.2–4.9 km s-1 for all the lines but the two observed at 3mm and 2mm, which are also those observed with the lowest S/N ratio and the worst spectral resolution (from 0.7 km s-1 to 0.2 km s-1 moving from 80.6 GHz and 266.2 GHz). The emission in the 1 and 2 mm bands only originates from SVS13-A, as SVS13-B, 15 south-west, is outside the . The 3 mm band might, in principle, contain some emission from SVS13-B. However, the analysis of the measured fluxes tends to exclude a substantial contamination from SVS13-B also in this band (see below).
Finally, we searched for HO lines in our spectral survey and found none. The most sensitive upper limit to the H2O column density is set by the non detection of the para–HO 31,3–22,0 line at 203.40752 GHz444from Jet Propulsion Laboratory database, http://spec.jpl.nasa.gov/home.html; Pickett et al. (1998). We obtained a 3 upper limit on the peak temperature (in scale) of 20 mK.
| Transition | a | a | a | a | log(A/s-1)a | rms | b | b | b | b | |
|---|---|---|---|---|---|---|---|---|---|---|---|
| (GHz) | () | (K) | (D2) | (mK) | (mK) | (km s-1) | (km s-1) | (mK km s-1) | |||
| 11,0–11,1 | 80.57829 | 31 | 3 | 47 | 0.66 | –5.88 | 5 | 14(2) | +9.2(0.3) | 1.7(0.9) | 26(9) |
| 42,2–42,3 | 143.72721 | 17 | 9 | 319 | 0.73 | –5.55 | 9 | 21(8) | +8.0(0.3) | 3.1(0.8) | 68(20) |
| 31,2–22,1 | 225.89672 | 11 | 7 | 168 | 0.69 | –4.88 | 7 | 45(7) | +8.0(0.1) | 4.9(0.3) | 234(16) |
| 21,1–21,2 | 241.56155 | 10 | 5 | 95 | 0.36 | –4.92 | 6 | 41(6) | +8.0(0.1) | 4.7(0.3) | 206(9) |
| 73,4–64,3 | 241.97357 | 10 | 15 | 837 | 1.39 | –4.82 | 7 | 17(5) | +7.7(0.3) | 4.6(0.7) | 83(10) |
| 52,3–43,2 | 255.05026 | 10 | 11 | 437 | 1.02 | –4.75 | 6 | 40(6) | +7.8(0.1) | 4.5(0.2) | 199(9) |
| 22,0–31,3 | 266.16107 | 9 | 5 | 157 | 0.40 | –4.76 | 12 | 31(9) | +7.4(0.3) | 4.2(0.8) | 141(19) |
a From the Jet
Propulsion Laboratory database (Pickett et al. 1998).
b The errors are the gaussian fit uncertainties.
3.2 Analysis of the HDO emission
We analysed the observed HDO line emission with the non-LTE LVG model by Ceccarelli et al. (2003), using the collisional coefficients for the system HDO-H2 computed by Faure et al. (2012) and extracted from the the BASECOL database (Dubernet et al. 2013). We assumed a plane-parallel geometry and a Boltzmann distribution for the ortho-to-para H2 ratio of 3. Note that the collisional coefficients with ortho-H2 can be a factor 5 larger than the corresponding coefficients with para-H2 (Faure et al. 2012), but only at low temperatures (45 K) and not at those here discussed (see below). Note also that the HDO 73,4–64,3 line (with = 837 K) has been excluded from the LVG analysis because the corresponding collisional rates have not been calculated (see later for a comparison with an LTE approach).
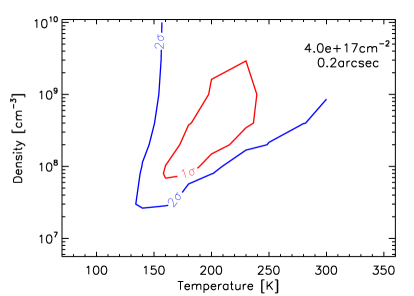
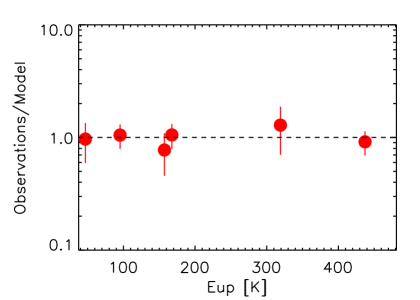
We run a large grid of models varying the temperature from 100 to 300 K, the H2 density from to cm-3, the HDO column density from to cm-3, and the emitting sizes from 0.05 to 10 . The lowest is obtained with cm-2, and 02, corresponding to AU. Figure 2 (upper panel) shows the contour plot as a function of the temperature and H2 density with these values. The best fit solution is found for a very high temperature, =150–260 K, and a quite high density cm-3. Figure 2 (lower panel) shows the goodness of the fit, namely the ratio between the measured velocity-integrated intensities and the LVG model predictions, as a function of the line upper level energy, for the best fit solution: cm-2, 02, K, and cm-3. The lines are predicted to be optically thin to moderately thick. The largest opacities are for the four lowest lying lines (at 80.58, 241.56, 266.16 and 225.90 GHz), while the other lines have opacities lower than unity.
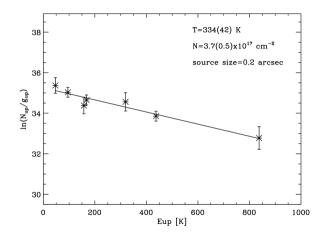
Finally, the populations of the detected transitions are predicted to be close to LTE. Indeed, since non-LTE predictions were not possible for the higher lying line at 241.97 GHz, we also computed the LTE solution (see Fig. 3), finding a rotational temperature of 33442 K, which is larger than the kinetical temperature derived from the LVG analysis, i.e. 160–240 K considering the 1 solution. In practice, assuming the non-LTE LVG solution, the agreement between the predicted and observed intensity of the = 857 K is within a factor 2; this is acceptable if we consider the opacity of the low- lines and that the LTE condition may not apply to such a high lying line so that we cannot exclude a temperature gradient with a component with larger than 200 K. High spatial resolution observations are required to clarify this point.
3.3 Origin of the HDO emission
The non-LTE analysis reveals the presence of a hot (150–260 K), dense ( cm-3) and compact ( 50 AU) component in SVS13-A. Note that the density estimate well agrees with that derived from dust continuum by Chen et al. (2009). High temperatures (218 K) have been similarly obtained by Coutens et al. (2014) applying an LTE analysis to four HDO lines detected, using the PdB array, towards the Class 0 NGC1333 IRAS2A. Also, high excitation conditions have been found through LVG analysis of H2O lines as observed by Herschel towards both Class 0 and Class I sources (e.g. Herczeg et al. 2012; Podio et al. 2012; Karska et al. 2013; Busquet et al. 2014; Kristensen et al. 2016); in these cases, the high excitation H2O emission has been associated with shocked gas induced by jets. Thus, the present results may indicate the presence of jet-induced shocks on the 20 AU scales. However, the jet hypothesis is ruled out by: (i) the line profiles ( 4 km s-1) (the is usually traced by velocities larger than 10 km s-1), and (ii) the compact size inferred by the LVG analysis. On the other hand, HDO emission could be emitted by shocks induced by the viscosity of a disk or it could probe the base of a disk wind (as suggested by Codella et al. 2016 for the Class 0 HH212). Again, there is no signature in the line profile suggesting an association of water with a small portion of the large disks expected to be around Class I objects (around 250 AU; e.g. Eisner et al. 2012).
In conclusion, what is HDO tracing in the SVS13-A system? The observed high temperature and linewidth are consistent with the presence of a hot corino inside SVS13-A, where the gas is thermally heated by the central source. Of course, the definition of hot corino involves the detection of complex organic molecules (e.g. Ceccarelli et al. 2007). We anticipate that this is indeed the case for SVS13-A (Bianchi et al., in preparation). Assuming that the dust is heated by the 34 L⊙ central source and that the dust emission is optically thin, the dust temperature would be about 200 K at a distance of 25 AU (see e.g. Ceccarelli et al. 2000, Eq. 1). Of course, if the dust opacity is thick in the innermost regions, then this value is a lower limit. Therefore, this temperature is in good agreement with the LVG analysis. Indeed, high temperatures from HDO were observed by Coutens et al. (2014) towards the Class 0 object NGC1333-IRAS2A, in agreement with the present hypothesis that HDO lines, being optically thin, probe inner regions around the protostars.
However, the hot corino interpretation has a problem. If the high temperature is caused by the thermal heating, one would expect that water is sublimated from the icy grain mantles at 100 K, whereas the HDO line emission indicates a larger temperature. Why? A first possibility could be that the HDO line emission is dominated by warmer gas because of the line opacities. Indeed, even if the HDO abundance has a jump at 100 K, if the lines are optically thin then the warmer regions, with higher opacities may dominate the integrated intensity. One has also to consider that the water abundance has a further jump at around 220–250 K, caused by the reactions that convert all the gaseous atomic oxygen into water and that possess activation barriers making them efficient at 220 K (Ceccarelli et al. 1996). The temperature is close to that derived from the LVG modeling, so that it is a plausible hypothesis that the gas probed by the observed HDO lines lies in a region warmer than the water desorption region because of the line opacities.
3.4 Water deuteration
Using the intensity 3 upper limit of the para–HO line at 203.40752 GHz (see §3.1) and assuming a source size of 02 and a temperature of 200 K, we derive un upper limit to the HO column density of cm-2. Assuming the standard value of 16O/18O = 560, the upper limit to the water column density is cm-2. Using the HDO column density previously derived, = 4 1017 cm-2, leads to a lower limit to the water deuteration, 1 10-3. Finally, using the derived density (2 108 cm-3) and emitting sizes (02 = 50 AU in diameter) provides an estimate of the H2 column density of 1.5 1023 cm-2 and, consequently of the HDO abundance of 3 10-6. Similarly, the upper limit to the H2O column density can be converted into an upper limit to the water abundance, namely 3 10-3. We can, therefore, increase the real lower limit to the water deuteration considering that, reasonably, the water abundance cannot be larger than about 2 10-4. This leads to a lower limit HDO/H2O 0.015.
This upper limit is consistent with those derived so far towards Class 0 protostars, 10-2 by Coutens et al. (2012) and Taquet et al. (2013), 0.3–8 10-2, and larger than those quoted by Persson et al. (2013, 2014) and Coutens (2013; 2014), 0.1–4 10-3. Therefore, the deuteration of water does not seem to diminish from Class 0 to Class I sources. Yet, we conclude with a word of prudence, as this value of deuteration has been obtained taking the values of the LVG modeling. In particular, since the lines seem close to the LTE, the H2 density could be larger and, consequently, the HDO abundance could be lower by the same factor.
4 Conclusions
The high-sensitivity of the IRAM 30-m ASAI unbiased spectral survey in the mm-window allows us to detect towards the Class I object SVS13-A a large number of HDO emission lines with upper level energies up to = 837 K. The non-LTE LVG analysis points to hot (150–260 K), dense ( 3 107 cm-3) gas associated with a quite small emitting region (50 AU), supporting the occurrence of a hot corino inside SVS13-A. The HDO abundance is found to be 3 10-6. Although the occurrence of shocks at such small scales cannot be excluded, it is tempting to suggest we are observing for the first time the jump in the water abundance occurring at temperatures higher than 200 K, when the activation barriers of the gas phase reactions coverting oxygen into water can be overcome.
Obviously, the final answer is in the hands of future interferometric observations (e.g. using ALMA) imaging water emission around SVS13-A on scales 20 AU.
Acknowledgments
The authors are grateful to the IRAM staff for its help in the calibration of the PdBI data. We also thank F. Dulieu for instructive discussions. The research leading to these results has received funding from the European Commission Seventh Framework Programme (FP/2007-2013) under grant agreement N° 283393 (RadioNet3). This work was partly supported by the PRIN INAF 2012 – JEDI and by the Italian Ministero dell’Istruzione, Università e Ricerca through the grant Progetti Premiali 2012 – iALMA. CCe & BL acknowledge the financial support from the French Space Agency CNES, and RB from Spanish MINECO (through project FIS2012-32096).
References
- Altwegg et al. (2015) Altwegg K., Balsiger H., Bar-Nun A., et al. 2015, Science 347, 387
- Busquet et al. (2014) Busquet G., Lefloch B., Benedettini M., et al. 2014, A&A 561, 120
- Caselli et al. (2012) Caselli P., Keto E., Bergin E.A., et al. 2012, ApJ 759, L37
- Ceccarelli et al. (1996) Ceccarelli C., Hollenbach D.J., & Tielens A.G.G.M. 1996, ApJ 471, 400
- Ceccarelli et al. (1999) Ceccarelli C., Caux E., Loinard L., et al. 1999, A&A 324, L21
- Ceccarelli et al. (2000) Ceccarelli C., Castets A., Caux E., et al. 2000, A&A 355, 1129
- ceccarelli et al. (2003) Ceccarelli C., Maret S., Tielens A.G.G.M., Castets A., & Caux E. 2003, A&A 410, 587
- ceccarelli et al. (2014) Ceccarelli C., Caselli P., Bockelèe-Morvan D., et al. 2014, Protostars and Planets VI, 859
- Chen et al. (2008) Chen X., Launhardt R., & Henning Th. 2009, ApJ 691, 1729
- Coutens (2012) Codella C., Ceccarelli C., Nisini B., et al. 2010, A&A 522, L1
- Coutens (2012) Coutens A., Vastel C., Caux E., et al. 2012, A&A 539, 132
- Coutens (2013) Coutens A., Vastel C., Cabrit S., et al. 2013, A&A 560, A39
- Coutens (2014) Coutens A., Jørgensen J.K., Persson M.V., van Dishoeck E.F., Vastel C., & Taquet V. 2014, ApJ 792, L5
- Dubernet et al. (2013) Dubernet M.-L., Alexander M.H., Ba Y.A., et al. 2013, A&A 553, 50
- Dubernet et al. (2013) Eisner, J.A. 2012, ApJ 755, 23
- Faure et al. (2012) Faure A., Wiesenfeld L., Scribano Y., & Ceccarelli C. 2012, MNRAS 420, 699
- Herczeg et al. (2012) Herczeg G.J., Karska A., Bruderer S., et al. 2012, A&A 540, 84
- Hirota et al. (2008) Hirota T., Bushimata T., Choi Y.K., et al. 2008, PASJ 60, 37
- Karska et al. (2013) Karska A., Bruderer S., van Dishoeck E.F., et al. 2013, A&A 552, 141
- Lefloch et al. (1998) Lefloch B., Castets A., Cernicharo J., Langer W.D., & Zylka R. 1998, A&A 334, 269
- Lefloch et al. (2012) Lefloch B., Cabrit S., Busquet G., et al. 2012, A&A 757, L25
- Lopez-Sepulcre et al. (2015) López-Sepulcre A., Jaber A.A., Mendoza E., et al. 2015, MNRAS 449, 2438
- Persson et al. (2013) Persson M.V., Jørgensen J.K., & van Dishoeck E.F. 2013, A&A 549, L3
- Persson et al. (2014) Persson M.V., Jørgensen J.K., van Dishoeck E.F. & Harsono D. 2014, A&A 563, 74
- Pickett et al. (1998) Pickett H.M., Poynter R.L., Cohen E.A., et al. 1998, J. Quant. Spectrosc. & Rad. Transfer 60, 883
- Taquet et al. (2013) Taquet V., López-Sepulcre A., Ceccarelli C., et al. 2013, ApJ 768, L29
- Taquet et al. (2014) Taquet V., Charnley S., & Sipilä O. 2014, ApJ 791, 1
- Tobin et al. (2016) Tobin J.J., Looney L.W., Li Z.-Y., et al. 2016, ApJ 818, 73
- van Dishoeck et al. (2011) van Dishoeck E.F., Kristensen L.E., Benz, A.O., et al. 2011, PASP 123, 138
- van Dishoeck et al. (2014) van Dishoeck E.F., Bergin E.A., Lis D.C., & Lunine J.I. 2014, Protostars and Planets VI, 835
- Vastel et al. (2010) Vastel C., Ceccarelli C., Caux E., et al. 2010, A&A 521, L31
- Willacy et al. (2015) Willacy K., Alexander C., Ali-Dib N., et al. 2015, Space Science Reviews 197, 151