CDF Collaboration222With visitors from aIstituto Nazionale di Fisica Nucleare, Sezione di Cagliari, 09042 Monserrato (Cagliari), Italy, bUniversity of California Irvine, Irvine, CA 92697, USA, cUniversity of California Santa Barbara, Santa Barbara, CA 93106, USA, dUniversity of California Santa Cruz, Santa Cruz, CA 95064, USA, eInstitute of Physics, Academy of Sciences of the Czech Republic, 182 21, Czech Republic, fCERN, CH-1211 Geneva, Switzerland, gCornell University, Ithaca, NY 14853, USA, hUniversity of Cyprus, Nicosia CY-1678, Cyprus, iOffice of Science, U.S. Department of Energy, Washington, DC 20585, USA, jUniversity College Dublin, Dublin 4, Ireland, kETH, 8092 Zürich, Switzerland, lUniversity of Fukui, Fukui City, Fukui Prefecture, Japan 910-0017, mUniversidad Iberoamericana, Lomas de Santa Fe, México, C.P. 01219, Distrito Federal, nUniversity of Iowa, Iowa City, IA 52242, USA, oKinki University, Higashi-Osaka City, Japan 577-8502, pKansas State University, Manhattan, KS 66506, USA, qBrookhaven National Laboratory, Upton, NY 11973, USA, rUniversity of Manchester, Manchester M13 9PL, United Kingdom, sQueen Mary, University of London, London, E1 4NS, United Kingdom, tUniversity of Melbourne, Victoria 3010, Australia, uMuons, Inc., Batavia, IL 60510, USA, vNagasaki Institute of Applied Science, Nagasaki 851-0193, Japan, wNational Research Nuclear University, Moscow 115409, Russia, xNorthwestern University, Evanston, IL 60208, USA, yUniversity of Notre Dame, Notre Dame, IN 46556, USA, zUniversidad de Oviedo, E-33007 Oviedo, Spain, aaCNRS-IN2P3, Paris, F-75205 France, bbTexas Tech University, Lubbock, TX 79609, USA, ccUniversidad Tecnica Federico Santa Maria, 110v Valparaiso, Chile, ddYarmouk University, Irbid 211-63, Jordan, llUniversite catholique de Louvain, 1348 Louvain-La-Neuve, Belgium, ooUniversity of Zürich, 8006 Zürich, Switzerland, ppMassachusetts General Hospital and Harvard Medical School, Boston, MA 02114 USA, qqHampton University, Hampton, VA 23668, USA, rrLos Alamos National Laboratory, Los Alamos, NM 87544, USA
Measurement of the and production cross section using final states with a charged lepton and heavy-flavor jets in the full CDF Run II data set
Abstract
We present a measurement of the total WW and WZ production cross sections in collision at TeV, in a final state consistent with leptonic boson decay and jets originating from heavy-flavor quarks from either a or a boson decay. This analysis uses the full data set collected with the CDF II detector during Run II of the Tevatron collider, corresponding to an integrated luminosity of 9.4 fb-1. An analysis of the dijet mass spectrum provides evidence of the summed production processes of either WW or WZ bosons with a measured total cross section of pb. Independent measurements of the WW and WZ production cross sections are allowed by the different heavy-flavor decay-patterns of the and bosons and by the analysis of secondary-decay vertices reconstructed within heavy-flavor jets. The productions of WW and of WZ dibosons are independently seen with significances of and , respectively, with total cross sections of pb and pb. The measurements are consistent with standard-model predictions.
pacs:
13.38.Be,13.38.Dg,14.65.Fy,14.65.DwI Introduction
The production of a pair of or vector bosons is a process of primary interest at hadron colliders. Measurements of the production of different vector-boson pairs probe the multiple gauge-boson couplings TGC_Degrande201321 predicted by the standard model (SM), and provide a benchmark for analyses designed to study lower-cross-section processes sharing the same final states, like Higgs-boson production.
Diboson production has been extensively studied by the CDF, D0, ATLAS and CMS collaborations using final states where both bosons decay leptonically. The multiplicity of charged leptons and neutrinos allows for the separation of WW, WZ, and ZZ production with the advantage of a distinctive experimental signature. Current measurements of WW ATLAS_WW_PhysRevD.87.112001 ; ATLAS_WW_8TeV ; CMS_WW2015 ; CDF_WWj_PhysRevD.91.111101 , WZ ATLAS_WZ_2012 ; ATLAS_WZ_2016_8TeV ; D0_WZZZlep_2012 , and ZZ ATLAS_ZZ_llll ; ATLAS_ZZ_llll_13TeV ; CMS_ZZ_llll ; CDF_ZZ_llll production cross sections have fractional precision in the %% range.
The analysis of final states with one of the two bosons decaying leptonically and the other hadronically (hereafter called the semileptonic final state) is more challenging because of the large background from QCD hadron production and the poor resolution in the reconstructed energy of hadronic jets compared to charged leptons. At the Tevatron and Large Hadron Collider (LHC) experiments, the measurements of the combined WW+WZ production cross section for the semileptonic final states have precisions of %% CDF_DibosonMjj_lvjj ; CDF_DibosonME_lvjj ; D0_Diboson_lvjj ; ATLAS_Diboson_lvjj ; CMS_Diboson_lvjj . The separate measurement of WW and WZ production is highly challenging because the width of the dijet-mass distribution is larger than the mass difference between the and bosons. One method to distinguish the two production modes is to use the different heavy flavor (HF) hadronic decays involving or bosons, namely , and or . The D0 collaboration used an experimental signature targeting decays to measure WZ production in the semileptonic final state with an uncertainty of %% D0_Diboson_lvjj . A precise measurement of the WZ production cross-section in this final state is still missing.
In searches for the as-yet-unobserved decay of the SM Higgs bosons to a pair of quarks, Tevatron Tevatron_Hbb and LHC ATLAS_VHbb2015 ; CMS_VHbb2014 experiments obtained the highest sensitivity by investigating the WH and ZH production modes. Because of the small expected signal yield and of the large backgrounds, multivariate discriminating algorithms have been used extensively and searches in the final states with zero, one, and two leptons have been combined together. In the same analyses, the total WZ+ZZ production cross section has been measured in the semileptonic final states enriched in HF hadrons with an uncertainty of approximately .
The goal of the analysis described in this paper is the measurement of the combined and separate WW and WZ production cross-sections using the differences in heavy flavour (HF) hadronic decays involving the and bosons. The analysis is also a benchmark for the CDF search for WH production WHbb_2012 , the most sensitive analysis channel contributing to searches for the SM Higgs boson decaying to the final state at the Tevatron Tevatron_Hbb .
This measurement is based on the full proton-antiproton () collision data set collected with the CDF II detector at the Tevatron collider, corresponding to an integrated luminosity of 9.4 fb-1 at a center-of-mass energy of TeV.
Events are selected by requiring only one fully-reconstructed electron or muon candidate and an imbalance in the total energy measured with respect to the plane transverse to the colliding beams (), indicative of the presence of a neutrino. Both requirements strongly suppress the background of ZZ production where one of the two bosons decays hadronically and the other leptonically. A support-vector-machine (SVM) algorithm NIM_SVM is used to select events consistent with +jets production. Finally, the hadronic decay of the or boson is identified by requiring events with two jets with a large component of the momentum transverse to the beam (transverse momentum) and where, in at least one of them, a secondary-decay vertex is identified in at least one jet, indicating the presence of a or hadron (HF tag). The resonant or boson signal is separated from the large nonresonant background by studying the dijet mass spectrum. In combination with this, a flavor-separator neural network single_top (flavor-separator NN) is used to separate jets originating from a charm or bottom quark, enhancing the sensitivity to WW or WZ production. The method with which the WW and WZ contributions are disentangled is novel. A Bayesian statistical analysis is then used to extract the signal cross sections by comparing the data to the background predictions. Further details on the analysis are in Ref. WZThesis .
The paper is organized as follows: the CDF II detector is briefly described in Sec. II; the selection of signal candidates is reported in Sec. III; the details of the Monte Carlo (MC) simulation used in the analysis are given in Sec. IV; the background estimation is described in Sec. V. The signal-to-background discrimination is discussed in Sec. VI, before the description of the signal-extraction statistical-analysis and its results, in Sec. VII. Conclusions are given in Sec. VIII.
II The CDF experiment
The CDF II detector, described in detail in Ref. top_lj2005 , operated at the Tevatron collider from 2001 until 2011. It was a multipurpose particle detector composed of a charged-particle tracking system immersed in a T axial magnetic field and surrounded by calorimeters and muon chambers. The detector had azimuthal symmetry around the beam axis and forward-backward symmetry with respect to the collision point. Particle trajectory (track) coordinates are described in a cylindrical-coordinate system with the -axis along the proton beam, the azimuthal angle about the beam axis, and the polar angle , measured with respect to the proton beam direction. The following variables are defined: pseudorapidity, ; transverse energy, ; transverse momentum, ; and angular distance between two particles and as .
The charged-particle tracker was composed by a set of silicon detectors svx ; isl and by an open-cell drift chamber cot covering radial ranges up to about 30 cm and 140 cm, respectively. The inner silicon detectors covered the pseudorapidity range , provided a spatial resolution on each measurement point in the plane of approximately m, and they achieved a resolution on the track transverse impact parameter d0 , of about m, of which about 30 m was due to the transverse size of the Tevatron beam. The m long drift chamber, covering the region of , ensured a measurement of charged-particle transverse momenta with resolution of , where momenta are in units of GeV/.
The tracking system was surrounded by calorimeters, which measured the energies and the directions of electrons, photons, and jets of hadronic particles. The electromagnetic calorimeters used lead and scintillating-tile sampling technology, while the hadronic calorimeters were composed of scintillating tiles with steel absorber. The calorimeters were divided into central and plug sections, each segmented in projective-geometry towers pointing towards the nominal interaction point. The central section, composed of the central electromagnetic Balka:1987ty and central and end-wall hadronic calorimeters Bertolucci:1987zn , covered the region . The end-plug electromagnetic Albrow:2001jw and end-plug hadronic calorimeters extended the coverage to . At a depth of about six radiation lengths inside the electromagnetic calorimeters, detectors with finer segmentation Apollinari:1998bg were used to provide position measurement and shape information for electromagnetic showers.
In the outermost layer of the CDF II detector, a composite set of planar multiwire-drift chambers was used for muon identification Ascoli:1987av ; Artikov:2005 . The detectors were arranged into the central-muon section covering the region , the central-muon extension covering the region , and the barrel-muon chambers covering the region .
The imbalance in the magnitude of the vector sum of all calorimeter-tower-energy depositions projected on the transverse plane, dubbed raw missing transverse energy or , is used to infer the transverse momentum of additional particles escaping detection, most notably neutrinos.
A set of gaseous Cherenkov counters clc_performance located at large pseudo-rapidity, , was used to measure the instantaneous luminosity through the rate of inelastic collisions.
III Data Sample and event selection
We maximize the acceptance of events containing one electron or muon, missing transverse energy, and two heavy-flavor jets in the final state.
The trigger selection and lepton and jet identifications follow those developed in searches for rare processes, such as WH WHbb_2012 and -channel-single-top quark production signletop_ljet_2014 . Novel strategies are used in the selection of the heavy-flavor jet-enriched sample and for the rejection of background events originating from multijet production.
III.1 Trigger selection and categorization
Data were collected using several trigger paths, which are categorized by the following four analysis regions, homogeneous in kinematic and background composition:
-
(1)
Central electrons. Collected by requiring a track from a charged particle with GeV/ matched to an electromagnetic cluster with GeV and .
-
(2)
Central muons. Collected by requiring a track from a charged particle with GeV/ and matched to hits detected in a central muon chamber.
-
(3)
Forward electrons. Collected by requiring clusters in the electromagnetic calorimeter, reconstructed in the region and with GeV, and missing transverse energy, reconstructed with GeV.
-
(4)
Extended muons. As detailed in Ref. WH7.5 , a combination of trigger paths able to collect events containing a neutrino and high- jets is used in order to recover events that, at trigger level, are not identified as containing a charged lepton. This data set is referred to as “extended muons”, since large may be originating from high- muons depositing a small amount of energy in the calorimeter system.
Due to the changes in instantaneous luminosity that occurred over the ten years of detector operation, some trigger selections were modified or their rates were decreased by randomly accepting a fixed fraction of the events that met the trigger selection. Trigger efficiencies were measured on data as functions of the instantaneous luminosity and kinematic properties of the events NIM_Adrian . For the triggers used for the extended-muon category, the efficiency is parametrized as a function of the missing transverse energy reconstructed using only calorimeter information, i.e., without accounting for any correction due to the momentum of detected muons. The uncertainty on the total trigger efficiencies ranges from 1% (central muons) to 3% (extended muons).
III.2 plus HF-jets-candidate selection
Candidate signal events are selected off line to be consistent with the production of a boson decaying leptonically and of a second particle decaying to two jets containing HF hadrons.
As a first step, events with exactly one muon (electron) candidate of GeV/ ( GeV) are selected. Muon and electron candidates are required to originate from a primary vertex vtx within 60 cm of the center of the CDF II detector, as measured along the beam line. A total of ten lepton-reconstruction algorithms, encompassing four “tight”, five “loose”, and one “track-only” classes are used. Two classes of tight-electron candidates are identified, associated with the central () and forward () regions of the electromagnetic calorimeter, using selection requirements based on five electromagnetic-shower-shape profiles and calorimeter variables WZThesis . Two classes of tight-muon candidates are selected in the central muon subdetectors, for and . A set of five loose-muon-class identification criteria is defined to recover signal acceptance up to and in the gaps of the muon subdetectors. Each lepton-candidate class requires the presence of a reconstructed track in the drift chamber, except for the forward-electron class where only partial track-reconstruction in the silicon detectors is required phx_alg . The track-only class consists of good-quality tracks reconstructed in the drift chamber with from any reconstructed hadronic jet, as defined in the following, with GeV. About 15% of the track-only lepton candidates are expected to originate from electrons or lepton hadronic decays. To increase the purity of prompt leptons from -boson decays, lepton candidates are required to be well isolated. Calorimeter isolation is used for tight and loose lepton classes: The energy reconstructed in a cone of radius around the lepton must be less than 10% of the equivalent () of the muon (electron) candidate. Isolation in the tracking volume is used for the track-only leptons. The transverse momentum associated with the sum of all the tracks inside a cone of radius around the track-only lepton candidate must be less than 10% of the of the candidate.
As a second step, events with two hadronic jets of GeV and are selected. Jets are identified and reconstructed from clusters of calorimeter energies contained within a cone of radius jetclu . The calorimeter towers corresponding to the energy deposit of any tight-electron candidate are excluded from the jet-reconstruction algorithm. The of a jet, in experimental and simulated data, is calculated from the sum of the calorimeter clusters jet_corr1 and undergoes the following jet-energy scale calibration procedure to reproduce more accurately the energy of the originating hadrons: calorimeter response is adjusted to be independent of , energy contributions from multiple interactions are removed based on the number of reconstructed interaction vertices per bunch crossing in each event, and nonlinearities in the calorimeter response are corrected.
Finally, events with candidates are required to be consistent with the presence of a neutrino. The is corrected for the momentum of the muon and track-only candidates, and for the jet-energy-scale calibration of the jets with GeV and . Unlike the case for generic jet-energy-scale calibration, described above, effects due to multiple interactions are not taken into account as high-energy neutrinos are assumed to originate only from the primary interaction. The value of after these corrections, , is required to be greater than 15 GeV.
The selected data sample is still rich in multijet (MJ) events produced by QCD processes erroneously reconstructed as having the decay signature. A MJ suppression algorithm, based on a SVM discriminant, described in Sec. III.3, is used to improve the signal-to-background ratio.
The selection criteria described are referred to as the “pretag” selection. The selected sample consists of events, most of them containing a boson decaying leptonically and produced in association with jets originating from light-flavor quarks and gluons, as no jet-flavor discrimination is performed. A subset of data enriched in events with jets originating from HF quarks is obtained through the identification of long-lived hadrons that decay away from the primary vertex. The secvtx top_lj2005 algorithm attempts to reconstruct a secondary vertex in each jet containing at least two charged particles of GeV (“taggable” jet). If a vertex is found and is significantly displaced from the primary interaction, then the jet is “tagged” as a HF jet. The algorithm is operated with different (“tight” or “loose”) requirements on the tracks and vertex-reconstruction quality. Events are classified in distinct signal regions depending on the number of HF-tagged jets:
-
(1)
Single-tag (or one-tag). Events with one tight secvtx-tagged jet are classified in this signal region. The signal selection efficiency of this category, which also includes the events where the additional jet may have a loose-secvtx tag, is relatively high. The identification efficiency for WZ events containing one jet originating from a quark is approximately 42%, while the identification efficiencies for WZ or WW events with one jet originating from a quark are about 12% and 8%, respectively.
-
(2)
Double-tag (or two-tag). Events with two jets tagged both by the tight or both by the loose secvtx algorithm are classified in this signal region, with the double-loose tag category accounting for approximately 10% of the total double-tag-data. The reconstruction efficiency for WZ events with the boson decaying to quarks in this category is about 11%, with additional small contributions to the signal yield from decays.
III.3 Suppression of multijet background using an SVM discriminant
The use of loose-lepton-identification algorithms and of a low- requirement is well suited to recover signal acceptance in searches for processes with -boson leptonic decays and small expected yield. However, this enhances the background contribution from QCD multijet events classified as having a -boson-like signature, e.g., if a particle in a jet meets the lepton identification criteria and moderate is generated from energy mismeasurement. To cope with this, a multivariate multijet rejection strategy based on a support-vector-machine algorithm is developed NIM_SVM .
A discussion of the SVM algorithm and its usage is available in Ref. BShop_machine_learning ; however, the basic concepts are briefly illustrated in the following: The SVM algorithm builds the best separating hyper-plane, called the “margin”, between two classes of events, the signal and the background training sets, with each event represented as a point associated with a vector of coordinates in the multidimensional space of the discriminating variables. If the two sets of vectors are not linearly separable, as is often the case in real applications, an appropriate transformation function, the “kernel”, is used to map the vectors into a higher-dimension space where linear separation becomes possible. The margin is completely defined by a relatively small subset of the input training points, called “support vectors”. A new point is classified according to its SVM output value, which is the signed distance of the point with respect to the margin in the space where linear separation is obtained. A negative or positive SVM output value corresponds to background-like or signal-like classification, respectively.
The specific choices used in this analysis are described in more detail in Ref. NIM_SVM . The input training sets used are simulated jets signal events and MJ-background events from data, as described in Sec. V.1. Each training point is described by a set of kinematic variables characterizing the decay, the measured leading jet momentum, and , as well as the angles between the reconstructed objects. The two sets of vectors from the signal and background training sets are not linearly separable; therefore, a kernel transformation is used. To deal with possible mismodeling and biases in the training models, feedback from a data control sample, selected with loose jets requirements, is included in the training procedure. This ensures that the SVM variable evaluated in simulated events closely reproduces the results obtained in data.
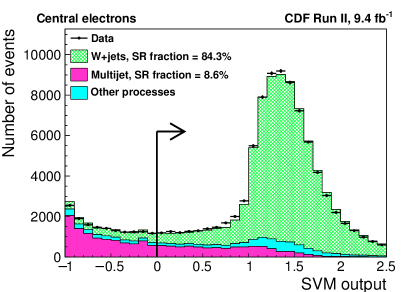
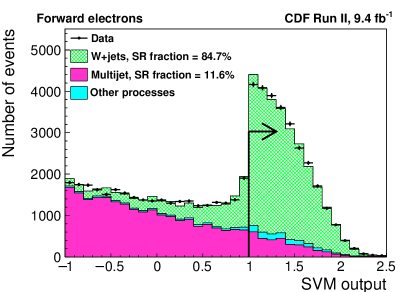
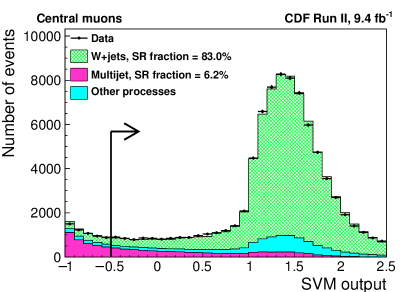
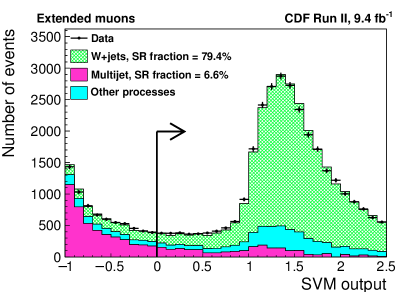
Two different SVM discriminants are developed, one for events with the lepton reconstructed in the central () region of the detector and one for the forward (). The event selection criteria are therefore defined by a threshold on the SVM output value, as shown in Fig. 1 where higher SVM thresholds are used in cases where the background is larger to obtain optimum performance. Events in the central-electron and extended-muon categories are required to have an output value of the central-SVM discriminant greater than zero. This selection rejects about % of the MJ background, as measured on the training sample, with a signal selection efficiency of % for WW or WZ simulated events. A relaxed selection threshold of SVM output greater than is used for events in the central-muon category; this yields approximately 98% signal efficiency while still rejecting about 90% of the MJ events. Events in the forward-electron category, approximately 12% of the total sample, are required to have an output value of the forward SVM discriminant greater than one; this rejects about % of the MJ background with a signal-selection efficiency of approximately % for simulated WW or WZ events.
IV Event Simulation
Several MC event generators are used to model background and signal processes. The pythia v6.2 pythia event generator at leading order (LO) in the strong-interaction coupling is used for the simulation of diboson WW and WZ signal, production and decay in inclusive final states. The same generator is used to simulate the contribution from the ZZ production and the production of a 125 GeV Higgs boson in association with a or boson, in the decay channels , , and .
The powheg powheg generator at next-to-leading order (NLO) in the strong-interaction coupling is used for single- and pair-production of top-quarks with 172.5 GeV/ mass. The alpgen alpgen LO generator is used for the matrix-element calculations of + jets and + jets processes, resulting in samples with up to four partons in the final state. The alpgen alpgen LO generator is also used for the simulation of + HF-partons samples with massive HF quarks (, , single ) accounted for in the matrix-element calculation. For all the simulated processes, the pythia v6.2 program is used for the simulation of parton-showers and hadronization.
A generated-to-reconstructed jet-matching scheme alpgen is used to correctly account for jets produced by the matrix element and the parton showers within each of the samples simulated with alpgen. As separate samples with + HF partons are used, care is taken to avoid double counting of the HF-parton phase space simulated by the matrix element or by the parton showers in different samples, as collinear QCD radiation is accounted for by the parton-shower program. This is done with an overlap-removal scheme based on jet cones of radius . For each generated event, if two HF partons originating from the matrix element are found to be in the same jet cone, the event is discarded. An event is also discarded if two HF partons originating from parton showers are reconstructed in two separate jet cones. This procedure allows for a smooth transition between the small region, where the dynamics is dominated by the parton shower, and the large region, where the hard scattering dominates.
In addition to the jet-energy scale calibration procedure described in Section III.2, a specific corrections dijet_marco is applied on simulated jets to account for their quark-like or gluon-like nature.
The distributions of the longitudinal momenta of the different types of quarks and gluons within the proton, parametrized as functions of the momentum transfer of the collision, are given by parton distribution functions (PDFs). The CTEQ5L cteq5l PDFs are used in generating all MC samples in this analysis. The underlying event model UE_explain is tuned to data CDF_UnderlingEvent . The simulated events are processed through a geant3-based detector simulation CDF_SIMULATION and then through the same reconstruction software used for experimental data.
| Process | Generator | Cross section [pb] |
|---|---|---|
| WW | pythia | , NLO MCFM |
| WZ | pythia | , NLO MCFM |
| ZZ | pythia | , NLO MCFM |
| pythia | ), NNLO HiggsCx | |
| pythia | ), NNLO HiggsCx | |
| powheg | , NNLO ttbarCx | |
| single-top- channel | powheg | , NNLO stopCx |
| single-top- channel | powheg | , NNLO stopCx |
| + jets | alpgen | , measurement zjetsCx |
| + jets | alpgen | Based on data |
The expected event yield of a simulated process is calculated as
| (1) |
where, for each process, is the NLO (or NNLO) cross section reported in Table 1, is the acceptance for each lepton and HF-tag category, and is the integrated luminosity collected by the appropriate trigger path.
The acceptance is estimated from simulated events and corrected for lepton reconstruction and HF tagging efficiencies observed in data by means of scale factors,
| (2) |
where is the efficiency associated with the lepton reconstruction or the HF-tagging, determined from simulation, and is the corresponding efficiency measured in a data control sample.
The scale factors corresponding to each lepton identification algorithm are measured in events and then applied as weights to each simulated event entering in the evaluation of in Eq. (1). The s corresponding to the tight lepton identification algorithms are known with a relative uncertainty below one percent. A relative uncertainty of approximately 2% is derived for the loose-muon identification algorithms, with the main data-MC differences arising in the modeling of the isolation and of the muon-chamber response. A relative uncertainty of 4.5% WH7.5 is derived for the isolated-track category, primarily to account for the flavor of the particle associated with the track.
The per-jet simulated HF-tagging efficiencies are corrected with scale factors derived from HF-enriched MJ samples top_lj2005 . The per-jet corrections are then propagated to the events entering in the computation of in Eq. (1) through the following formulas:
| (3) |
| (4) |
where , are the HF-tagging-efficiency corrections relative to the first and second jet in the event and , are the probabilities of each simulated event to meet the one-tag or the two-tag selection, respectively. The s of the tight and loose secvtx criteria are close to unity and do not show or dependences in the kinematic range of interest. The relative systematic uncertainty associated with the tight (loose) working point is 5% (7%) for each jet originating from quarks and about twice those values for jets originating from quarks.
V Background estimate
The selected events are likely to originate from processes characterized by the HF signature. However, in addition to the signal, several other processes are classified as having the same final state:
-
(1)
W+HF. Processes (, and ) involving the production of a boson in association with HF quarks, mainly from radiated gluons. This category represents the main source of irreducible background.
-
(2)
W+LF. Events with a real boson produced in association with one or more light-flavor (LF) jets mistakenly identified as a HF jet by the secvtx algorithm. Mistags are generated because of the finite resolution of the tracking detectors, material interactions, or from long-lived-LF hadrons ( and ) that produce real displaced vertices.
-
(3)
EWK. Background contributions from processes with a real lepton and HF jets. They originate from single-top quark and top-quark pair production, production of boson plus jets, and, to a lesser extent, WH and ZZ production.
-
(4)
MJ. Contributions from QCD multijet production giving a -boson-like signature when one of the particles in a jet passes the lepton identification criteria and energy mismeasurement in the event results in false .
A combination of simulation-based, data-based, and simulation-data-mixed prescriptions is used to estimate the background rates from the various sources single_top . These prescriptions are detailed in Ref. WZThesis and summarized in the following section.
V.1 Analysis of pretag control region
The kinematic description of the jets events, contributed by both LF and HF processes, is obtained from the simulated -plus--parton samples weighted by their LO production cross-sections. As the jets event yield is predicted with large uncertainties, we use the data sample prior to applying -jet-identification requirements (pretag control region) to estimate the total jets yield and validate the accuracy of the kinematic modeling of the jets simulation.
The normalization of the jets simulation is determined separately in each lepton category using a template-likelihood fit of the SVM distribution. Templates of the EWK and jets processes are built using simulation, while the following data-driven models are used for the MJ-background templates:
-
(1)
Central- and forward-electrons multijet templates are modeled using a sample obtained by inverting two out of the five selection requirements used to define tight electron candidates (see Sec. III.2). The of the central-electron MJ model is corrected to account for the different calorimeter response of the misidentified electron in data and in the model with inverted selection.
-
(2)
Central- and extended-muon multijet templates are modeled using a sample obtained by inverting the isolation criteria applied to tight- and loose-muon selection algorithms.
The MJ and jets template normalizations are left free in the fit, while the EWK components are constrained within their uncertainties to normalized predictions using Eq. (1), together with the theoretical cross sections listed in Table 1. The fit is performed before the application of the SVM selection requirement to leverage the high statistical power of the low SVM-output region to constrain the normalization of the MJ background. Figure 1 shows the results of the fit for the various lepton-class regions together with the different selection thresholds. The fractions of jets and MJ events after the selection requirements are also reported.
V.2 Background evaluation in the signal regions
The production of bosons in association with HF quarks represents the main background process in the single and double-tagged signal regions. The kinematic description of the HF-tagged HF background is derived from simulation using alpgen MC set with massive HF partons used in the matrix-element calculation.
The HF normalization is extracted from the simulated HF fractions in the jets MC after scaling the total jets MC yield to the one obtained from the pretag control sample. Factors accounts for the HF yield difference in data with respect to the prediction of the HF fractions, which results from the interplay of matrix-element generation (at LO), parton-shower matching scheme, and the strategy used to avoid HF-parton double-counting across samples. As described in the Appendix, the heavy-flavor-fraction correction is derived from a jet control region for both plus , and processes. In contrast to previous analyses single_top ; WHbb_2012 ; signletop_ljet_2014 , the plus , and corrections are extracted simultaneously. The correction factor for plus events is , and, for events, is . The possibility that the corrections are not appropriate for the two-tag selection region, dominated by events with two HF partons identified in well separated jets, is studied at generator level: an uncertainty of 40% is used when extrapolating the correction to the two-tag-selection region.
The contamination from LF events is estimated using the pretag data and a per-jet mistag probability measured in a QCD multijet control sample and parametrized as a function of six significant variables (“mistag matrix”). The uncertainty in the LF event rate is obtained by propagating the systematic uncertainty on the per-jet-mistag probability. The kinematic distributions of HF-tagged LF events are modeled using the pretag LF component of the simulation and weighting each event for the mistag probability.
The EWK background predictions are based on simulation with event yields predicted using Eq. (1) together with the theoretical cross sections listed in Table 1.
Finally, the residual MJ component is modeled from the data-driven templates described in Sec. V.1, plus the additional requirement of selecting events with one or two taggable jets if analyzing the single-tag or double-tag signal regions, respectively. The MJ normalization is obtained by a fit to the SVM-output distributions in data using two templates, one for the MJ and another for all the other backgrounds. The two template normalizations are free in the fit and the MJ normalization result is used in the final background estimate. A total uncertainty of 40% is applied to the MJ prediction to account for different MJ data-driven models in the HF-tagged region, different boundaries used in the fit on the SVM output, and the use of different variables (e.g., ) in the template fit.
Table 2 summarizes the number of observed and expected events in the jets sample, for all lepton categories in the pretag, one-tag, and two-tag samples.
| Process | Pretag | one-tag | two-tag |
|---|---|---|---|
| MJ | 2700 | 800 330 | 30 14 |
| LF | 3700 | 2440 350 | 29.5 6.8 |
| 1700 | 1190 290 | 33 16 | |
| 2200 | 930 310 | 12.5 5.5 | |
| 6370 930 | 2190 520 | 313 125 | |
| 9400 1900 | 281 42 | 13.5 2.1 | |
| 1600 230 | 663 94 | 137 22 | |
| Single-top | 1109 42 | 441 23 | 70.8 8.4 |
| ZZ | 93.4 4.4 | 10.1 0.7 | 2.0 0.3 |
| WH+ZH | 40.0 1.4 | 17.6 0.8 | 5.4 0.6 |
| WW | 5530 400 | 240 30 | 3.0 0.7 |
| WZ | 904 53 | 91.4 7.6 | 17.2 2.1 |
| Total prediction | |||
| Observed data | 232 145 | 9074 | 604 |
VI WW and WZ signal discrimination
After the HF-tag requirement the expected signal-to-background ratio is less than 0.04.
However, additional sensitivity comes from the study of the distribution of the invariant mass of the two jets in the event, , where signal is expected to cluster in a narrow resonance structure over a smooth nonresonant background. To improve the poor invariant mass resolution of the hadronic final state, the jet energy is corrected with a neural-network-based calibration timoNN , which uses information from jet-related variables and from the secondary decay vertex, if reconstructed in a jet. The dijet-invariant-mass resolution, initially about 15%, is improved to about 13% and 11% in the single and double-tag signal regions, respectively.
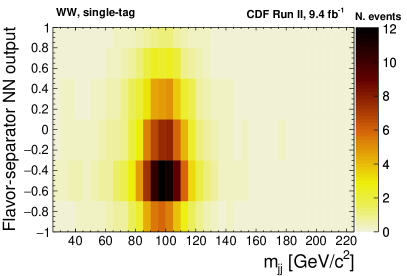
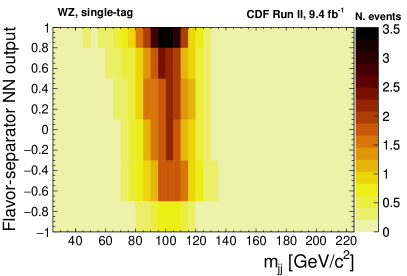
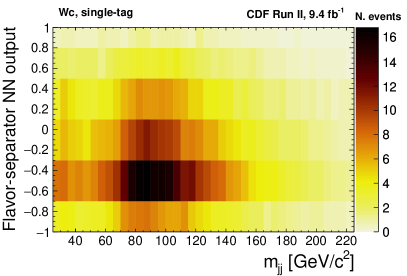
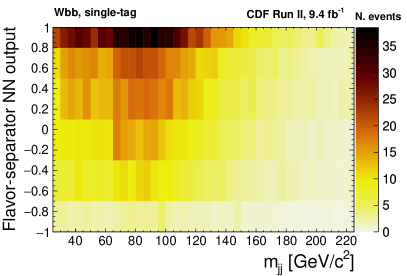
For single-tag events, in addition to the signal-to-background discrimination power of the distribution, the flavor-separator NN single_top is used to achieve -to--jet separation. The flavor-separator NN uses the information from the secondary-decay vertex to assign an output score between –1 and 1, depending on the jet being more -like or LF-like. Jets originating from quarks are likely to obtain negative scores, clustering around the NN output value of . The distribution and the flavor-separator NN output (divided in six bins) are combined in a two-dimensional distribution. This improves the separation of the WW and the WZ signals in the single-tag signal regions. Figure 2 shows example distributions for signals and background processes.
The discrimination power of the flavor-separator NN is not important in the two-tag signal region as approximately 90% of the events selected in this category are expected to originate from processes with quarks in the final state. Therefore only the distribution is used for the signal extraction in the two-tag signal region.
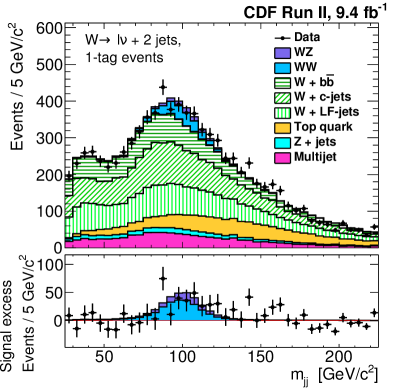
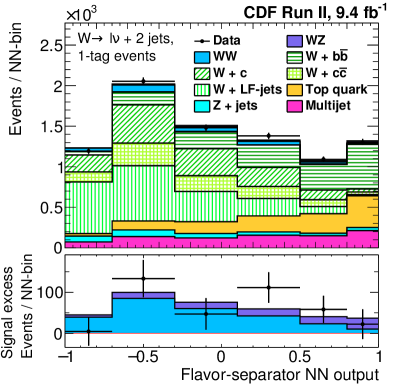
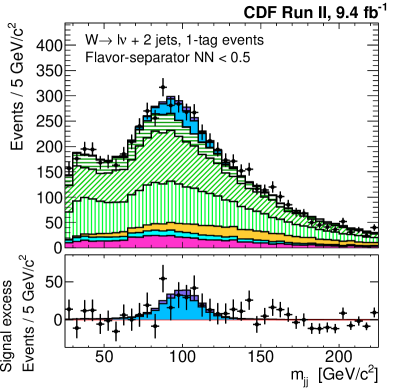
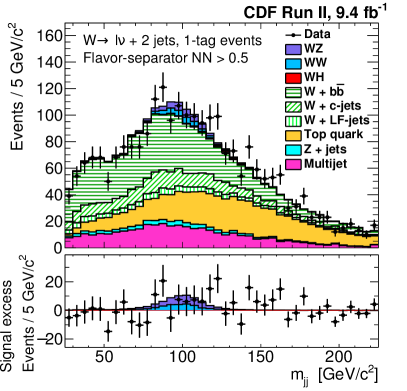
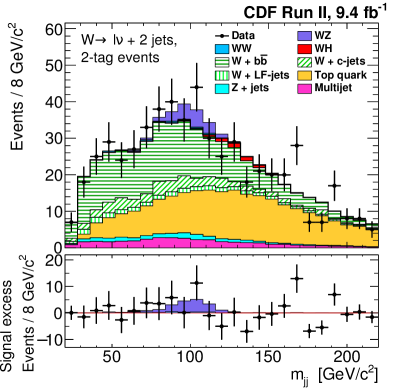
In total, eight regions are used for the signal extraction: four lepton subsamples (central electrons, central muons, forward electrons, extended muons) times two HF-tag prescriptions (one tag with flavor-separator NN and two tags). The distributions for all the lepton categories restricted to the one-tag final state are shown in Fig. 3: In panel (a) they are integrated across the flavor-separator-NN output and projected onto , while in panel (b) the integration is across and the projection is onto the flavor-separator-NN output distribution. Figure 4 shows the single-tag- distribution for the -enriched-flavor-separator-NN region (flavor-separator-NN output , Fig. 4a) and -suppressed region (flavor-separator-NN output , Fig. 4b). Finally, the distribution for two-tag events, summed for all the lepton categories, is shown in Fig. 5.
VII Cross section measurements and statistical analysis
In order to measure the total (WW+WZ ) and separate WW and WZ production cross-sections in the HF-enriched final state, data distributions described in Sec. VI are compared to expectations of signal and background using a Bayesian analysis, following Ref. single_top .
A likelihood function is built from the observed numbers of events in each bin, and the estimated signal and background distributions, assuming Poisson statistics. The prior probabilities of background and signal templates are included in the likelihood, together with all rate and shape systematic uncertainties, which are treated as nuisance parameters. The unknown yields of the two signal processes (WW and WZ ) are parametrized by uniform prior distributions in the non-negative domain. The signal production total cross-section is obtained by marginalizing the prior probability distribution over the nuisance parameters and studying the resulting posterior distribution for the signal yield. As the signal parametrization is normalized to the SM expectation, the maximum value of the Bayesian posterior corresponds to the measurement of the signal strength ,
| (5) |
Half of the shortest interval enclosing 68.3% (95.5%) of the posterior integral provides () uncertainty at the corresponding Bayesian credibility level (C.L.). For the combined WW+WZ result, a one-dimensional uniform signal prior is used with relative rates for the WW and WZ processes given by the SM. When measuring the WW and WZ cross sections separately, a two-dimensional uniform prior is used.
VII.1 Systematic uncertainties
Systematic uncertainties, which may affect both the yield (rate uncertainties) and the distribution of the discriminant variables (shape uncertainties), are used to account for the limited detector resolution and accuracy of calibrations, extrapolations from control regions, and theoretical predictions. Rate uncertainties are included in the likelihood by assigning a Gaussian prior probability to the normalization of a given process. If a given uncertainty source has relevant impact on the or flavor-separator-NN output shapes, these distributions are modified and the relative difference between the varied and the nominal distributions are included in the likelihood as correlated bin-by-bin Gaussian variations single_top . Statistical fluctuations may be large when evaluating the difference of two distributions, so the bin-by-bin variations affecting the distribution are smoothed with a three-bin median filter algorithm Filtering . This smoothing choice preserves shape correlations among the distributions if their effect extends through a few consecutive bins.
The systematic uncertainties affecting the rate of signal or background processes and considered for this analysis are the following:
-
(1)
Luminosity. A 6% uncertainty is applied to the expected rate of signal and EWK backgrounds based on the 4.0% uncertainty in the extrapolation of the inelastic cross section ppbar_cx and the 4.4% uncertainty in the acceptance of the luminosity monitor clc_performance .
-
(2)
Lepton acceptance. Such sources comprise the uncertainties arising from the measurement of the trigger efficiencies, and of the lepton-reconstruction scale-factors. The expected rate of signal and EWK backgrounds is affected by an uncertainty ranging from 2% (central muon final state) to 5% (extended muon final state), uncorrelated across the four lepton final states.
-
(3)
- and -tagging efficiences. The uncertainty arising from the per-jet HF-tagging efficiency scale-factor, uncorrelated between - and -quark jets, is propagated to the final yield of each process. Rate variations for processes with quarks in the final state range from approximately 3% (in cases of events with two jets selected in the single-tag samples) to approximately 10% (in cases with two jets selected in the double-tag samples). About twice such uncertainties are applied to processes with quarks in the final state single_top . This results in approximately a % rate uncertainty for processes selected in the single-tag signal region with one quark in the final state.
-
(4)
PDFs and radiative corrections. Uncertainties on the signal acceptance due to the choice of PDF is evaluated following Ref. WH7.5 . Uncertainties on the signal simulation due to the initial- (ISR) and final-state radiation (FSR) are evaluated by halving and doubling the ISR and FSR parameters and considering the resulting signal-acceptance and shape variations. The resulting shape variations are small and are neglected. The signal-rate variations are added in quadrature for a total systematic uncertainty of approximately 4%.
-
(5)
Theory uncertainties on EWK backgrounds. Theoretical uncertainties on production cross-sections and acceptances of the EWK background processes have rate uncertainties of 10% for top-quark-related processes, 5% for WH and ZH production, 6% for ZZ production, and 40% for +jet. The large uncertainty in the jets production is due to the conservative uncertainty assigned to the HF rate predictions of the alpgen simulation.
-
(6)
Mistag estimate. The uncertainties associated with the mistag matrix are propagated to the LF yield predictions in the signal regions. The resulting rate variations are 15% and 23% for the single- and double-tag samples, respectively, and are correlated.
-
(7)
HF fractions corrections. plus , and yields are varied according to the uncertainties associated with the factor corrections described in Section V.2. Uncorrelated rate variations of 30%, 20%, and 40% are applied to the predictions of in the single-tag sample, plus in the single-tag sample, and plus in the double-tag sample, respectively.
Additional systematic uncertainties affecting both the rate and the shape of signal or background processes and considered for this analysis are the following:
-
(8)
Flavor-separator NN response to - and LF-quark jets. Decay vertices originating from and LF hadrons typically have lower track multiplicity and smaller distance from the primary vertex than the ones originating from hadrons. As a consequence they are more sensitive to track resolution and detector-material effects, which are difficult to simulate precisely. Therefore, following the prescriptions of Ref. single_top , an additional uncertainty is assigned to the flavor-separator-NN output distribution of the processes containing and LF quarks: Their heavy flavor-separator-NN output shapes are varied between the ones obtained from the simulation and the shapes observed in a multijet-data sample enriched in misidentified HF tags.
-
(9)
MJ model. A rate uncertainty of 40% is applied to each MJ estimate in the various lepton final-states. The shape of the flavor-separator-NN output distribution of the MJ is extracted from templates of different quark flavor following Ref. single_top .
-
(10)
Jet energy-scale corrections. The envelope of the uncertainties arising from the jet energy-scale corrections is evaluated for each jet as described in Ref. jet_corr1 . The change in rate and shape of every process is taken into account and new iterations of the complete background estimate are performed using the varied samples. The resulting rate systematic uncertainty ranges from a few percent to approximately % depending on the process and on the final state. The shape variation produces a shift of up to 3% in the signal position.
-
(11)
jets . alpgen is a LO generator and its modeling is heavily affected by the choice of the factorization and renormalization scale, . The nominal scale used for parton processes is given by , where is the -boson mass, the sum runs over the partons, and is the transverse energy of each parton. Various simulated samples of jets, with halved or doubled, are used to account for the scale-choice uncertainty. Such samples have different kinematic properties and flavor composition. These are used for a new iteration of the complete background estimate and the difference in rate and shape with respect to the nominal estimate is used for the uncertainties of the LF and HF processes.
After the marginalization, the largest systematic effects on the WW+WZ cross-section measurement are given by the uncertainties on the HF-tagging efficiencies and on the HF fraction corrections, each contributing about 10% to the uncertainty of the measurement.
VII.2 Results
The WW+WZ cross section is first measured by constraining the relative fraction of the WW and WZ components to the SM values and by studying the total yield of the two processes.
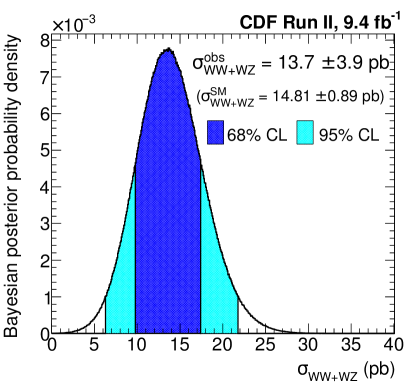
The resulting posterior distribution of the WW+WZ cross section is shown in Fig. 6 together with the 68.3% and 95.5% Bayesian credibility intervals. The measured signal strength of corresponds to a cross section of
| (6) |
in agreement with the SM NLO prediction of pb MCFM .
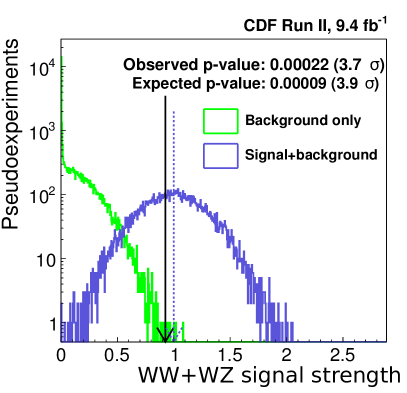
To determine the significance of the signal, we perform a hypothesis test by comparing the data with expectations under the null hypothesis of contributions from backgrounds only. Figure 7 shows the distribution of the results obtained in simplified simulated experiments that include contributions from signal and background, and background only processes. The probability of a background fluctuation to produce a signal strength equal or greater than the observed signal strength is , corresponding to evidence for WW+WZ production in the HF final-state with a significance of . The result is compatible with the expected significance of , obtained from pseudoexperiments generated under the SM hypothesis.
The WW and WZ cross sections are also measured separately by exploiting the differing decay patterns of the and bosons, which result in differing signal fractions in the one- and two-tag signal regions and in different distributions in the flavour separator NN. The Bayesian analysis is repeated leaving the and parameters free to vary. Figure 8 shows the resulting Bayesian posterior distribution, with integration contours at 68.3% and 95.5% Bayesian credibility levels. The maximum value corresponds to measured signal strengths of and .
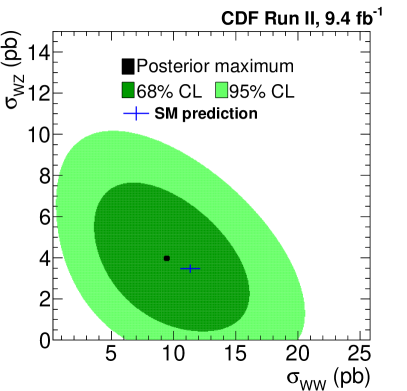
If the two-dimensional-Bayesian posterior is integrated with respect to the or to the variable, the results are
| (7) | |||||
| (8) |
in agreement with the SM NLO predictions of pb and pb MCFM , and corresponding to the most precise measurement of the WZ-production cross section in a semileptonic final state to date. Although the expected value of is about three times larger than the value, the relative uncertainties in the WW and WZ cross-section measurements are comparable because of the low -jet identification efficiency and the larger systematic uncertainty associated with it. In addition, the WZ-signal yield is limited by the 15% decay rate of the boson to -quark pairs.
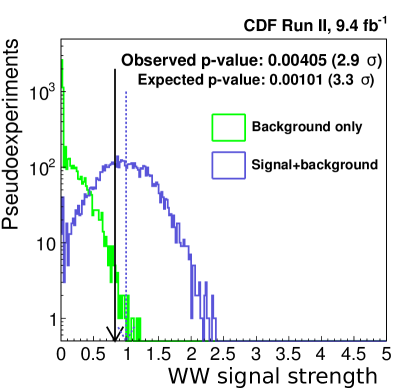
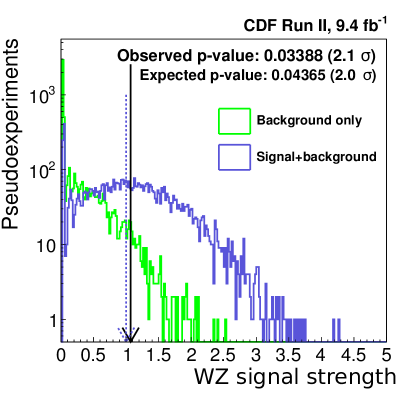
The separate significances of the WW and WZ signals are evaluated as done for the combined signal. Simulated experiments are generated under the null hypothesis for both WW and WZ signals; then the cross sections measured on the vs plane are integrated with respect to one or to the other variable and compared with and . The results of the estimates are reported in Fig. 9. We obtain: and . These correspond to significances of and , for WW and WZ, respectively. The result is consistent with the expected significances of and , for WW and WZ, respectively.
The sensitivity of this analysis to the WZ process is similar to that of the CDF WH analysis in events with one electron or muon WHbb_2012 , although the two analyses use different HF-tagging algorithms and different signal-to-background discrimination strategies.
VIII Conclusions
We analyze the full proton-antiproton collision data set collected by the CDF experiment in Run II, corresponding to fb-1 of integrated luminosity, searching for the associated production of a boson decaying leptonically, and a or boson decaying into heavy-flavored hadrons ( and ).
Because of the small expected signal yield, the acceptance for events is maximized by using loose lepton-identification criteria, while reducing the multijet background using a multivariate SVM-based selection.
The signal is identified by requiring two jets in each event, one or both consistent with being produced by heavy flavors, based on the presence of a secondary vertex.
The analysis of the dijet mass spectrum in the single- and double-tagged events shows 3.7 evidence for the WW+WZ signal over a background that is approximately 30 times larger. The measured total production cross-section of pb is consistent with the SM predictions.
The WW and WZ processes are also investigated separately. An artificial neural network dedicated to distinguishing the various flavors is used in conjunction with the dijet mass spectrum to identify the different heavy-flavor-decay pattern of the and bosons. This gives an observed (expected) signal significance of (3.3) and (2.0) for WW and WZ processes, respectively. The measured total cross sections, within the full solid-angle acceptance, of pb and pb are consistent with the SM expectations. The WZ cross section measurement is the most precise obtained to date with a semileptonic final state and supports the CDF capability to identify rare processes in this topology.
Acknowledgement
We thank the Fermilab staff and the technical staffs of the participating institutions for their vital contributions. This work was supported by the U.S. Department of Energy and National Science Foundation; the Italian Istituto Nazionale di Fisica Nucleare; the Ministry of Education, Culture, Sports, Science and Technology of Japan; the Natural Sciences and Engineering Research Council of Canada; the National Science Council of the Republic of China; the Swiss National Science Foundation; the A.P. Sloan Foundation; the Bundesministerium für Bildung und Forschung, Germany; the Korean World Class University Program, the National Research Foundation of Korea; the Science and Technology Facilities Council and the Royal Society, UK; the Russian Foundation for Basic Research; the Ministerio de Ciencia e Innovación, and Programa Consolider-Ingenio 2010, Spain; the Slovak R&D Agency; the Academy of Finland; and the Australian Research Council (ARC).
Appendix Simultaneous extraction of , , and normalization correction factors
As described in Section V.2, a normalization correction factor, , is used to account for the HF yield difference in data with respect to the HF fractions predicted by the alpgen alpgen simulation. Following Ref. single_top , the factor is extracted from the jet sample; however, in this analysis the plus , and corrections are extracted simultaneously.
The jet selection is performed using a simpler selection compared to the main analysis: candidates are selected using only the central-electron and central-muon trigger categories (described in Sec. III.1) in combination with only the tight central-lepton identification algorithms (described in Sec. III.2). The one-jet-pretag selection region is then defined by the presence of exactly one jet of 20 GeV and in each event, and multijet background contamination is reduced by means of a selection requirement on the central-region SVM-output-value distribution, as described in Sec. III.3. The sample is then enriched in HF jets by requiring the jet to be tagged by the tight secvtx algorithm. The background estimate proceeds as described in Sec. V for the jets sample, with the notable difference that the signals under investigation are now plus , and production.
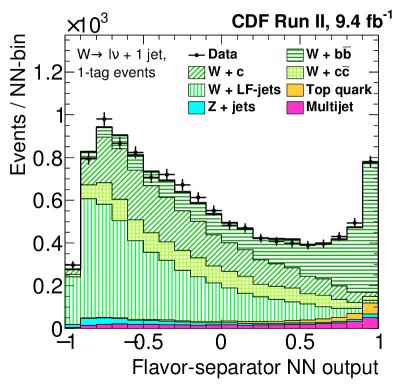
The signal strengths of the plus , and processes are defined as the ratio between the input HF-correction factors, and , and the ones favored by the data. We compare the flavor-separator-NN output distribution, shown in Fig. 10, of the two signals and of the backgrounds to the one obtained from data using the same Bayesian methodology described Sec. VII. A two-dimentional Bayesian posterior distribution is used to extract simultaneously the two signal strengths.
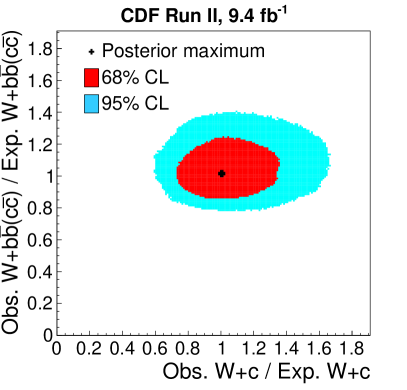
The analysis procedure is iterated four times, each time scaling the HF correction factor by the signal strength extracted from the previous iteration. The signal strength given by the last iteration is consistent with one, as shown by the two-dimensional-Bayesian posterior distribution in Fig. 11, and the final HF correction factors are , and .
References
- [1] C. Degrande, N. Greiner, W. Kilian, O. Mattelaer, H. Mebane, T. Stelzer, S. Willenbrock, and C. Zhang, Ann. Phys. 335, 21 (2013).
- [2] G. Aad et al. (ATLAS Collaboration), Phys. Rev. D 87, 112001 (2013).
- [3] G. Aad et al. (ATLAS Collaboration), CERN-PH-EP-2015-323, arXiv:1603.01702 [hep-ex], submitted to JHEP (2016).
- [4] V. Khachatryan et al. (CMS Collaboration), SMP-14-016, arXiv:1507.03268. Submitted to EPJC (2015).
- [5] T. Aaltonen et al. (CDF Collaboration), Phys. Rev. D 91, 111101 (2015).
- [6] G. Aad et al. (ATLAS Collaboration), Eur. Phys. J. C 72, 10 (2012).
- [7] G. Aad et al. (ATLAS Collaboration), Phys. Rev. D 93, 092004 (2016).
- [8] V. M. Abazov et al. (D0 Collaboration), Phys. Rev. D 85, 112005 (2012).
- [9] G. Aad et al. (ATLAS Collaboration), Phys. Lett. B 753, 552 (2016).
- [10] G. Aad et al. (ATLAS Collaboration), Phys. Rev. Lett. 116, 101801 (2016).
- [11] S. Chatrchyan et al. (CMS Collaboration), Phys. Lett. B 740, 250 (2015).
- [12] T. Aaltonen et al. (CDF Collaboration), Phys. Rev. D 89, 112001 (2014).
- [13] T. Aaltonen et al. (CDF Collaboration), Phys. Rev. Lett. 104, 101801 (2010).
- [14] T. Aaltonen et al. (CDF Collaboration), Phys.Rev. D 82, 112001 (2010).
- [15] V. M. Abazov et al. (D0 Collaboration), Phys. Rev. Lett. 108, 181803 (2012).
- [16] G. Aad et al. (ATLAS Collaboration), J. High Energy Phys. 01 (2015) 049.
- [17] S. Chatrchyan et al. (CMS Collaboration), Eur. Phys. J. C 73 2283, (2013).
- [18] T. Aaltonen et al. (CDF and D0 Collaborations), Phys. Rev. Lett. 109, 071804 (2012).
- [19] G. Aad et al. (ATLAS Collaboration), J. High Energy Phys. 01 (2015) 069.
- [20] S. Chatrchyan et al. (CMS Collaboration), Phys. Rev. D 89, 012003 (2014).
- [21] T. Aaltonen et al. (CDF Collaboration), Phys. Rev. Lett. 109, 111804 (2012).
- [22] F. Sforza and V. Lippi, Nucl. Instrum. Methods Phys. Res., Sec. A 722, 11 (2013).
- [23] T. Aaltonen et al. (CDF Collaboration), Phys. Rev. D 82, 112005 (2010).
- [24] F. Sforza, Ph.D. thesis, Università di Pisa, FERMILAB-THESIS-2012-41 (2012).
- [25] D. Acosta et al. (CDF Collaboration), Phys. Rev. D 71, 052003 (2005).
- [26] A. Sill et al., Nucl. Instrum. Methods Phys. Res., Sec. A 447, 1 (2000).
- [27] A. Affolder et al., Nucl. Instrum. Methods Phys. Res., Sec. A 453, 84 (2000).
- [28] A. Affolder et al., Nucl. Instrum. Methods Phys. Res., Sec. A 526, 249 (2004).
- [29] The track impact parameter is defined as the distance from the beam-line axis to the track at the track’s closest approach in the transverse plane.
- [30] L. Balka et al., Nucl. Instrum. Methods Phys. Res., Sec. A 267, 272 (1988).
- [31] S. Bertolucci et al., Nucl. Instrum. Methods Phys. Res., Sec. A 267, 301 (1988).
- [32] M. G. Albrow et al., Nucl. Instrum. Methods Phys. Res., Sec. A 480, 524 (2002).
- [33] G. Apollinari et al., Nucl. Instrum. Methods Phys. Res., Sec. A 412, 515 (1998).
- [34] G. Ascoli et al., Nucl. Instrum. Methods Phys. Res., Sec. A 268, 33 (1988).
- [35] A. Artikov et al., Nucl. Instrum. Methods Phys. Res., Sec. A 538, 358 (2005).
- [36] D. Acosta et al., Nucl. Instrum. Methods Phys. Res., Sec. A 494, 57 (2002).
- [37] R. Downing et al., Nucl. Instrum. Methods Phys. Res., Sec. A 570, 36 (2007).
- [38] E.J. Thomson et al., IEEE Trans. Nucl. Sci. 49, 1063 (2003).
- [39] T. Aaltonen et al. (CDF Collaboration), Phys. Rev. Lett. 112, 231804 (2014).
- [40] T. Aaltonen et al., Phys. Rev. D 86, 032011 (2012).
- [41] A. Buzatu et al., Nucl. Instrum. Methods Phys. Res., Sec. A 711, 111 (2013).
- [42] D. Acosta et al. (CDF Collaboration), Phys. Rev. D 71, 032001 (2005).
- [43] C. Issever, AIP Conference Proceedings, 670, 371 (2003).
- [44] F. Abe et al. (CDF Collaboration), Phys. Rev. D 45, 1448 (1992).
- [45] A. Bhatti et al., Nucl. Instrum. Methods Phys. Res., Sec. A 566, 375 (2006).
- [46] C. M. Bishop, Pattern Recognition and Machine Learning (Information Science and Statistics), Springer 2006.
- [47] T. Sjöstrand, S. Mrenna, and P. Skands, J. High Energy Phys. 05 (2006) 026.
- [48] S. Alioli, P. Nason, C. Oleari, and E. Re, J. High Energy Phys. 09 (2009) 111.
- [49] M. L. Mangano, M. Moretti, F. Piccinini, R. Pittau, and A. D. Polosa, J. High Energy Phys. 07 (2003) 001.
- [50] T. Aaltonen et al. (CDF Collaboration), Phys. Rev. D 89, 092001 (2014).
- [51] H.L. Lai, J. Huston, S. Kuhlmann, J. Morn, F. Olness, J.F. Owens, J. Pumplin, and W.K. Tung (CTEQ Collaboration), Eur. Phys. J. C 12, 375 (2000).
- [52] The underlying event consists of the beam-beam remnants and the multiple-parton interactions that accompany a hard scattering.
- [53] T. Aaltonen et al. (CDF Collaboration), Phys. Rev. D 82, 034001 (2010).
- [54] E. Gerchtein and M. Paulini, in Proceedings of the Computing in High Energy and Nuclear Physics, University of California, San Diego, March 2003 (unpublished).
- [55] J. Campbell, and R. K. Ellis, Phys. Rev. D 65, 113007 (2002).
- [56] S. Dittmaier et al., LHC Higgs Cross Section Working Group, arXiv:1201.3084v1 (2012).
- [57] U. Langenfeld, S. Moch, and P. Uwer, Phys. Rev. D 80, 054009 (2009).
- [58] N. Kidonakis, Phys. Rev. D 81, 054028 (2010).
- [59] T. Aaltonen et al. (CDF Collaboration), Phys. Rev. Lett. 100, 102001 (2008).
- [60] T. Aaltonen, A. Buzatu, B. Kilminster, Y. Nagai, and W. Yao, arXiv:hep-ex/1107.3026 (2011).
- [61] G. R. Arce, Nonlinear Signal Processing: a Statistical Approach (Wiley-Interscience 2005).
- [62] F. Abe et al. (CDF Collaboration), Phys. Rev. D 50, 5535 (1994).