Instruments on Large Optical Telescopes – A Case Study
Abstract
In the distant past, telescopes were known, first and foremost, for the sizes of their apertures. However, the astronomical output of a telescope is determined by both the size of the aperture as well as the capabilities of the attached instruments. Advances in technology (not merely those related to astronomical detectors) are now enabling astronomers to build extremely powerful instruments to the extent that instruments have now achieved importance comparable or even exceeding the usual importance accorded to the apertures of the telescopes. However, the cost of successive generations of instruments has risen at a rate noticeably above that of the rate of inflation. Indeed, the cost of instruments, when spread over their prime lifetime, can be a significant expense for observatories. Here, given the vast sums of money now being expended on optical telescopes and their instrumentation, I argue that astronomers must undertake “cost-benefit” analysis for future planning. I use the scientific output of the first two decades of the W. M. Keck Observatory as a laboratory for this purpose. I find, in the absence of upgrades, that the time to reach peak paper production for an instrument is about six years. The prime lifetime of instruments (sans upgrades), as measured by citations returns, is about a decade. Well thought out and timely upgrades increase and sometimes even double the useful lifetime. Thus, upgrades are highly cost effective. I investigate how well instrument builders are rewarded (via citations by users of their instruments). I find acknowledgements ranging from almost 100% to as low as 60%. Next, given the increasing cost of operating optical telescopes, the management of existing observatories continue to seek new partnerships. This naturally raises the question “What is the cost of a single night of telescope time”. I provide a rational basis to compute this quantity. I then end the paper with some thoughts on the future of large ground-based optical telescopes, bearing in mind the explosion of synoptic precision photometric, astrometric and imaging surveys across the electromagnetic spectrum, the increasing cost of instrumentation and the rise of mega instruments.
1. Background & Motivation
Historically, ground-based optical telescopes have been the primary experimental method by which astronomers investigated the heavens. The serendipitous discovery of cosmic radio emission and later cosmic X-ray sources led to a flood of exploration in other electromagnetic bands. Today it is routine for an active astronomer to call upon data from radio (decameter to the sub-millimeter), thermal infrared (mid infrared, MIR), near infrared (NIR), space ultra-violet (UV) and high energy (X-ray, -ray) bands to study and draw conclusions about celestial objects.
Space-based astronomy offers exquisite performance in several ways. For certain bands (e.g. UV, X-ray, THz and others) either the poor transmission through the atmosphere or a high atmospheric background leave us with no choice but to go to space. For other bands (e.g. MIR; see Appendix §A for definitions of IR bands) ground-based observations suffer from high but (barely) acceptable background noise. Next, atmospheric turbulence degrades the wave-front leading to poor image quality and a corresponding decrease in precision and accuracy of photometry and astrometry. Adaptive optics (AO) offers some solace but with limitations (e.g. narrow field, requirement for guide stars). Independent of this discussion, it is hard to beat space-based instruments when one desires ultra-fine measurements in photometry (e.g. color-magnitude of globular clusters, extra-solar planet transits, astero-seismology, CMB observations) or wide field astrometry (e.g. Gaia).
Separately, there is now a substantial investment in non-electromagnetic astronomical facilities: neutrinos, gravitational waves and cosmic rays (and primarily pursued by physicists). These very large investments are a testimony to the fecundity of astronomy.
Despite investments in flagship space-based electromagnetic missions and flagship non-electromagnetic facilities, the fact remains that ground-based optical and infrared (0.3–2 m; hereafter, optical-IR or OIR) telescopes continue to play a leading role in the overall development of astronomy. In the optical band, the atmosphere is relatively quiet and the absorption is low. At the same time, in the optical band, celestial sources exhibit a moderate number of spectral lines from which astronomers can infer distance (via redshift), masses (via velocities), temperatures (via line width or line ratios) and the abundances of a number of elements.
1.1. Maturity of Optical Telescope & Observatory Technology
We are now in the fifth century since a patent application for a “spyglass” (the forerunner of telescope) was made by H. Lippershey of Zeeland (a province of the Netherlands). On hearing of the invention, G. Galileo who was then working in Venice, put together a small telescope. With the double advantage of being “first on the block” and possessing deep physical insight Galileo went on to make revolutionary advances in astronomy, physics and theology. It is not a surprise that later generation astronomers aspire to at least have the same external advantage as Galileo himself had (namely, first access to a revolutionary observational facility).
The early refractors gave way to reflectors. Over the course of time there have been improvements in every aspect related to the engineering of telescopes: mirror coatings, materials (e.g. low expansion glass such as Zerodur); opto-mechanical solutions which abandon rigidity for knowledge and control (thin mirrors with active optics; e.g. European Southern Observatory’s New Technology Telescope); and large monolithic mirrors with nearly unity -ratios (made possible by honey-comb light weighting and spin casting; e.g. the Large Binocular 8.4-m mirrors). In my view, in my lifetime, the greatest advance in telescope engineering is finely segmented telescopes (e.g. the Keck 10-m telescope). This approach has opened up an elegant path for the realization of larger telescopes at lower cost (on a per unit area basis).
Thanks to all the advances discussed above the cost of large telescopes (per unit area) is decreasing. As a result the global astronomical community now enjoys a dozen large aperture (8-m and 10-m) telescopes. Even bigger telescopes are now being planned or are under construction.
So far the discussion has been about telescopes which are ultimately based on a glass-based parabolic mirror to collect the light. There have been attempts at alternative approaches. Liquid mirrors could offer an inexpensive way to realize large apertures (e.g. the Large Zenith Telescope111http://www.astro.ubc.ca/LMT/ based on liquid mercury). Another approach is spherical reflectors fixed to the ground (cf. the Arecibo radio telescope). However, to date there is no liquid mirror telescope in routine operation and there are only two operational spherical mirror telescopes (see §3.2).
The “delivered image quality” (DIQ) of a telescope, even if perfectly engineered, is limited by “seeing” which has several components: high-altitude seeing, ground-layer seeing and dome seeing. Astronomers have become painfully aware of these issues. As a result, nowadays, astronomers undertake extensive studies of telescope sites before finalizing the site selection (e.g. Schöck et al. 2009). Thermal and seeing (turbulence) control is another explicit engineering consideration in the design of modern observatories (e.g. Racine et al. 1991; Bauman et al. 2014). Domes are designed keeping in mind prevailing winds (and with computer controlled louvers to prevent buildup of turbulence within the dome) and cooled to temperatures anticipated for the coming night (e.g. Baril et al. 2012). Thinner mirrors, cooling lines and carefully engineered heat dissipation by instruments are key inputs for good thermal control of the telescope. As a result, the DIQ of telescopes has consistently increased with each generation. It is fair to say that a modern well-designed telescope can be expected to routinely perform at a level limited by overall site seeing.
I end this section by a parenthetical remark, namely that the technology for fabricating small and moderate size telescopes is now quite mature. The primary advance (and gains) lie in reduction of unit costs.222e.g. a fully robotic 70-cm telescope from Planewave Instruments of Los Angeles costs $200K (not including the burdensome California sales taxes). This trend combined with continued improvements in detector technology (particularly the possibility of low or nearly zero read noise) opens up the possibility of realizing a large aperture via a number of small diameter telescopes (“Large Aperture via Small Telescopes” or LAST; this can be compared to “Large Number of Small Diameter dishes” or LNSD architecture in radio astronomy). Separately, it may not be surprising that within this decade astronomers will have farms of 1-m telescopes, each dedicated for a specific target or a specific cause.
1.2. The Rising Cost of Instrumentation
While the telescope gathers light it is the instrument that delivers the science. The costs of instruments were minor for the first generation of modern telescopes (e.g. the Lick 36-inch refractor or the Mt. Wilson 60-inch reflector). Imaging was provided by a simple camera with a photographic plate. The imaging was, at best, seeing limited and thus the optics were simple (the plates could also be curved, if needed, thus further simplifying the optics). The focus was on single object spectroscopy and this simplified the design of the spectrographs. In both cases, the observer was responsible for the most delicate part of the observation – the guiding.
Advances in technology have made it possible to build instruments which can fill a significant fraction of the available focal plane. As a result, modern spectrographs have the ability to return spectra of multiple objects (large reach). A new development is “mega” instruments which are instruments with extra-ordinarily large reach (Appendix B). These instruments have already had a big impact and are poised to fundamentally change the landscape of optical telescopes. While in the past, say about three decades ago, one talked of the aperture of telescopes, today astronomers talk of the capabilities of the mega instruments just as much as (and sometimes even more than) the apertures of telescopes.
However, it appears to be the case that the cost of instruments has risen faster than the nominal and the real GDP. In addition, rapid changes in technology are accelerating obsolescence. This combination is deadly in that the instrumentation “line” (the annual cost for instrumentation, averaged over say a decade) can become financially draining.
Next, in the not-so-distant past, astronomers were not accustomed to the word “pipeline” or “user ready data products”. It was expected that the data reduction was undertaken by each astronomer using their own tools or within a framework supplied by the Observatory (e.g. IRAF). This worked reasonably well since most astronomers were quite specialized and typically wedded to a single facility or a narrow suite of instruments.
In view of the large sums expended for flagship projects funding agencies like to see maximal and timely exploitation of data. The expectation of great returns, in turn, mandates sophisticated algorithms for optimal extraction. Next, instruments with large reach produce such large amounts of data that the traditional “hand” data reduction is not practical. These two drivers have led to the growth of high quality data reduction pipelines (DRP). DRPs with such high expectations are not cheap. After all each DRP has to contend with data taken under different observing conditions and account for instrumental idiosyncrasies whilst still delivering optimal returns. Finally, the increased cost of astronomical facilities has naturally led to the development of archives so as to maximize the returns from the mission or facility. Unfortunately, archives, if they are to be useful at all (which means those which produce high value product on request) do not come cheap, also.
1.3. The Thesis & the Motivation
The fundamental thesis of this paper is, given the maturity of telescope technology, that the output of an Observatory following the commissioning of the telescope is determined primarily by its instrumentation. Given the discussion in the previous section the term “instrumentation” includes quality DRPs and powerful archives.
Large optical telescopes are expensive. The capitalization cost is in excess of $150M (for a single telescope). A full suite of high quality instrumentation could easily run up to $50M (or more). The operating cost including new instrumentation and upgrades start at $15M (and up). Clearly, observatories hosting large optical telescope must be regarded as “large” science. As such optical astronomers must undertake “cost-benefit” analysis and come to grips with “opportunity cost”333The formal definition is “the loss of potential gain from other alternatives when one alternative is chosen”. This important concept was developed by the French economist Frédéric Bastiat and the classic reference is his 1850 essay entitled “What is Seen and What is Unseen”. of their decisions.
One could argue that, since astronomical research is far removed from ordinary life, the very concept of cost-benefit analysis is meaningless. I do not agree with this sentiment for two reasons. First, when hundreds of millions of dollars are being spent, funding agencies necessarily demand a greater level of scrutiny and justification. Next, to me it is a self-evident truth that research is simply another human activity and as such subject to the same set of issues as one faces in ordinary life.
Here, I use the scientific output of the W. M. Keck Observatory (WMKO) – one of the two observatories that I am familiar with – as a laboratory for the “business” of large OIR telescope observatories. The first goal of this paper is to measure the impact of instrumentation. Next, the increased cost of operating large optical facilities is motivating the operators of Observatories to seek partnerships (and inversely those lacking access to seek partnership on existing telescopes). This development leads to the second goal: the construction of a framework in which the value for each night can be computed and accepted by a rational market.
1.4. The Organization of the Paper
The paper is organized as follows. In §2 I argue that the annual flux of citations is a good measure of the productivity of an observatory. This is followed by a brief history of WMKO (§3). In §4 I summarize the principal instruments that have been or continue to be employed at the W. M. Keck Observatory (or simply the Observatory) followed by the Adaptive Optics facilities (§5). The primary input for this report are the papers which have resulted from data based on the Keck Observatory. In §6 I summarize the methodologies used and metrics employed in this paper. The analysis and basic inferences can be found in §7 and §8. In §9 I summarize a recent development, the Keck Observatory Archive. This archive enables further exploitation of Keck data and in the process is augmenting the productivity of the Observatory. In §10 I propose that the value of one night of telescope time should be tied to the productivity of the Observatory. I end the paper first by summarizing the rapidly evolving landscape for optical/IR astronomy (§11) followed by my views of the future of large optical telescopes (§12) and that of the W. M. Keck Observatory (§13).
2. Measuring Progress
The cost of an astronomical instrument or facility is easy to define. For telescopes it is the money spent to design and fabricate the telescope through the commissioning of the first light instruments. This sum is usually referred to as the “capital cost”. For facilities one must also include the annual operation or “ops” cost. Ops cost must include expenses for infra-structure improvements, instrument upgrades, and developing and maintaining archives. The benefits are much harder to quantify and some may even argue that benefits cannot even be agreed upon by a group of astronomers (with disparate interests).
However, the situation is not entirely hopeless. There exists a rich literature of astronomers defining and measuring progress. A good review of astronomical “bibilometrica” (or “scientometrica”) is provided by Abt (2005). I found myself entirely in agreement with the opening paragraph of Abt’s paper: “Astronomers insist upon seeing quantitative evidence in scientific papers or they will not believe the results claimed. However, when discussing policies or making decisions about funding, instrumentation, promotions, etc., they depend mostly upon impressions, feelings and intuition. But measures of productivity, success and importance can be quantitative, and quantitative measures should replace impressions.”
In this paper I will be using two metrics to measure progress. Most research consists of making gradual progress. Thus an active area of astronomy (almost by definition) will have a flux of papers, and necessarily this flux will be associated with a flux of citations. In most cases, activity can be reasonably expected to measure progress. We thus use the citation flux as a measure of routine progress.
Next, Abt (ibid) demonstrates that the top cited papers are almost always agreed to be landmark papers by eminent astronomers and inversely those considered to be landmark papers are also heavily cited. Abt arrives at this conclusion by using the Centennial Issue444http://www.amazon.com/American-Astronomical-Society-Centennial-Astrophysical/dp/0226001857 of the Astrophysical Journal as the input sample. He cleverly builds the control sample (papers which, in the Astrophysical Journal, merely precede highly cited papers). As a simple check, I went through my list of papers and composed a list of what I thought were my top ten papers. I compared this list to a list of ten papers with the highest citations. I found an excellent concordance between the two lists. Thus, as a second measure of progress, I will be using the collection of the most cited papers.
Returning to the subject of “bibliometrics” I refer the reader to a series of papers by V. Trimble and associates and by H. Abt (e.g. Trimble, Zaich & Bosler 2005; Trimble & Zaich 2006; Trimble & Ceja 2008; Abt 2012). These authors use citation rates and investigate the productivity and impact of telescopes of various apertures, of different vintages, sorted by wavelength and so on and so forth.
Before proceeding further I would like to acknowledge that the statistics of citation are, in part, dependent on fashion and certainly influenced by the number of people who work in a given field (which is directly correlated with funding). In astronomy, currently, the two most popular and fashionable fields are cosmology and extra-solar planets. Pepe & Kurtz (2012) define a new index “Total Research Impact” or tori which takes into account (1) field-dependent citation rates (popular versus less popular fields), (2) the number of co-authors (papers with many co-authors are likely to be cited more often than single author papers) and (3) shot noise (some papers become very popular for reasons that are not clear even after the fact, cf. Gangnam Style phenomenon555http://en.wikipedia.org/wiki/Gangnam_Style. Backović (2016) provides analytical models for equivalent phenomena in astro-particle physics, CMB and particle physics.). As noted above, funding directly determines the number of researchers working in a field. In turn, funding has several drivers including particularly the choice of missions or facilities. Here, I will stick to the two measures, both based on citations, but add the caution that, for all the reasons mentioned above, it may not be appropriate to compare the citation returns from, say, ground-based optical facilities to, say, those resulting from ground-based radio facilities or space-based facilities.
3. The W. M. Keck Observatory: A Brief History
The history of optical/IR astronomy has been, for a long time, driven by ever increasing apertures. Larger collecting areas allow for spectroscopy of faint objects– an almost unique contribution of ground-based optical astronomy. However, as noted in §1.1, getting the best DIQ starts off with cold sites (critical for operations in K-band and longer wavelengths) with excellent and stable seeing and preferably with little variation in night time temperature. Thanks to the pioneering astronomer Gerard Kuiper and the continued efforts of astronomers at the University of Hawaii (UH), in particular John T. Jeffries, Mauna Kea was found to be a high quality site for astronomical observations.
The UH 88-inch telescope, commissioned in 1970, was the first research telescope atop Mauna Kea. The year 1979 saw the commissioning of NASA’s (National Aeronautics & Space Administration) Infrared 3-m Telescope Facility (IRTF), the Canada-France-Hawaii (CFH) 3.6-m telescope (hereafter, CHFT) and the United Kingdom Infrared 3.6-m telescope (UKIRT). In particular, CFHT was a highly visible international project. The great success of this telescope demonstrated the value of locating a modern large telescope at a site with superb seeing. It was only natural that Mauna Kea was chosen as the site for the next large telescope coming from the West Coast of the US – the Keck 10-m telescope(s).
3.1. The Keck 10-m Telescopes
Breaking the tradition of monolithic primary mirror, the large aperture of the 10-m Keck telescope was realized by 36 hexagonal segments. This approach was pioneered by Jerry Nelson and Terry Mast of the Lawrence Berkeley Laboratory (LBL), University of California at Berkeley (UCB). The Keck project began with a grant, in 1985, of $70M from the W. M. Keck Foundation to California Institute of Technology (Caltech) in support of the construction of the first Keck telescope. The University of California (UC) and Caltech formed a non-profit entity, the California Association for Research in Astronomy (CARA), and jointly led the Keck project. As a part of this agreement, UC signed up to pay for operations of the Observatory for the first twenty five years.666The specific financial arrangement ends by March 2018, after which both UC and Caltech will bear equal financial responsibility. Following ground-breaking in 1986, first light on Keck I (with all segments) was obtained on 14 April 1992. The first light instruments were three workhorses: NIRC, LRIS and HIRES (described below in §4). The construction costs of these instruments were included as a part of the construction cost of Keck I. The run-out cost777Throughout this paper, costs are “then-year” costs, unless otherwise stated. through first light for Keck I was $94.3M.
In 1992, the Keck Foundation donated a second tranche, to the tune of $74.5M, to Caltech for the construction of the Keck II telescope. The construction was completed in early 1996 and routine observations began in October of 1996. The runout cost888All the cost numbers reported here, including the extended commissioning costs, were obtained by the author from Gerald (“Jerry”) Smith, the Project Manager for the Keck Telescopes. for Keck II was $77.8M. In return for hosting the telescopes on the Mauna Kea Science Reserve, the University of Hawaii receives 10% of Keck I and 15% of Keck II time.
Separately, what eventually became the Keck Interferometer emerged as a major recommendation from the TOPS (Toward Other Planetary Systems) study commissioned by NASA. In 1996 NASA joined CARA as a partner and did so by contributing $30M as capital contribution for a sixth share and a proportional fraction of the ops cost. Soon thereafter, in response to the recommendations of TOPS and other advisory committees, NASA embarked on a program to implement the Keck Interferometer project. NASA selected JPL to implement the interferometer jointly with WMKO.
The incurred (capital) cost for the two Keck telescopes was $172M
(or $187.6M, if post-construction commissioning costs are included).
Usually the average of these two numbers is often quoted in the
media999http://www.nytimes.com/1996/05/09/us/world-s-biggest-telescope-has-finally-met-its-match-a-twin.html
New York Times, May 9, 1996. Money left over from the construction
of Keck II, including interest earned, was applied towards the
development and construction of the first AO system
(§5).. This low cost is a testament to
both the ingenuity of the designers of the telescope as well as
vivid demonstration of the segmented architecture in breaking the
cost scaling law for monolithic telescopes (Stepp, Daggert & Gillett, 2003).
The Keck telescopes had a major impact (Crabtree, 2008; Kim, 2011)101010Crabtree issues an annual update to his 2008 paper. because not only the telescopes represent a huge jump in collecting area (relative to the earlier generation of large telescopes with usable effective diameters of about 5-m) but were also able to produce superb images limited only by the exquisite seeing at Mauna Kea. Next, at first light, astronomers had access to a suite of powerful instruments.
3.2. The Era of Large Telescopes
The next group of large telescopes, the 8.2-m European Southern Observatory (ESO) Very Large Telescope (VLT; at Paranal, Chile; 1998–2002), the Subaru 8.2-m telescope atop Mauna Kea (1999), the 6.5-m Magellan telescopes (at Las Campanas, Chile; 2000-2002) and the two Gemini 8.2-m telescopes (one located on Cerron Pachón, Chile and the other on Mauna Kea;1999–2000) came into operation starting mid 1998 through 2002.
A different approach was taken by astronomers at the University of Texas and the Pennsylvania State University: the realization of large aperture but with a fixed spherical primary (cf. Arecibo). The Hobby-Eberly telescope (HET; McDonald Observatory, Texas) was the first such telescope. It used fixed segmented hexagonal segments for the primary. The telescope was nominally commissioned in 1996, but keeping the segments phased was problematic. Fixes were designed (Booth et al., 2003) and implemented by 2004 (Booth et al., 2004). The lessons learnt were applied to the South African Large Telescope (Sutherland, South Africa; commissioned 2005). Both these telescopes achieve large apertures (effective aperture size of about 9-m) at low cost (but with observations limited to regions near to the zenith and also, relative to conventional telescopes, a limited field-of-view (FOV)111111 The FOV of the HET at the time of first light was circle of diameter 4 arc minutes. A major upgrade was undertaken for the HETDEX project (see Appendix §B) and the FOV increased to 22 arc minutes).
| Inst. | Upgrade | Period | Refs | Cost |
|---|---|---|---|---|
| $M | ||||
| NIRC | - | 1989-1994 | [1a,1b] | 1.9 |
| LRIS | ✓ | 1988-1994 | [2a] | 4.3 |
| . | LRIS-Blue | 1995-2000 | [2b,2c] | 4.3 |
| . | LRIS-ADC | 2003-2007 | [2d] | 0.9 |
| . | LRIS-Red | 2007-2010 | [2e] | 1.6 |
| HIRES | ✓ | 1988-1994 | [3] | 4.2 |
| . | HIRES-3-CCD | 2002-2004 | - | 1.5 |
| ESI | - | 1996-2000 | [4a,4b] | 4.0 |
| NIRC2 | - | 1994-2000 | - | 6.0 |
| NIRSPEC | - | 1994-2000 | [6] | 4.4 |
| DEIMOS | - | 1993-2002 | [7] | 11.0 |
| OSIRIS | ✓ | 2000-2005 | [8a,8b] | 5.6 |
| . | H2RG | 2014-2015 | - | 1.1 |
| MOSFIRE | - | 2005-2012 | [9] | 14.6 |
Note. — From left to right.: the name of the instrument, the upgrades (, if one was undertaken;“-”, otherwise). any), the period of construction, the reference to the project and the run-out cost (marked to first light or thereabout; in “then” dollars). The references are as follows: [1a] Matthews & Soifer (1994a). [1b] Matthews & Soifer (1994b). [2a] Oke et al. (1995). [2b] McCarthy et al. (1998). [2c] Steidel et al. (2004). [2d] Phillips et al. (2008). [2e] Rockosi et al. (2010). [3] Vogt et al. (1994). [4a] Sheinis et al. (2002). [4b] Sheinis et al. (2000). [6] McLean et al. (1998). [7] Faber et al. (2003). [8a] Larkin et al. (2006). [8b]Larkin et al. (2006). [9] McLean et al. (2012).
4. The Instruments
There are (or have been) nine “facility” (major) instruments at the Keck Observatory (see Table 1 for summary and §4.1–4.9 for details). There were three other major instruments: the Long Wavelength Infrared Camera121212which was built but never commissioned, the Long-Wavelength Spectrometer and the Keck Interferometer. The latter two are no longer operational. In addition, WMKO hosted a few “visitor” instruments. Further details or mention of these two instruments and the visitor instruments can be found in §4.10.
Adaptive optics (both with natural guide star, NGS, and laser guide star, LGS) is not an instrument but is integral to the performance of some instruments (NIRC2, OSIRIS; see below). The performance of such instruments is almost entirely dependent on the improvement in image quality provided by AO. As such I have included a detailed discussion of AO (§5).
4.1. Near-Infrared Camera (NIRC)
NIRC was the first instrument to be commissioned at the W. M. Keck Observatory. The instrument was located in the forward Cassegrain module of the Keck I telescope which was fed by a gold-coated /25 chopping secondary mirror. The Principal Investigators (PIs) of the project were Keith Matthews and B. Thomas Soifer of Caltech.
The preliminary study for NIRC began in 1987 in response to a call for first light instruments for the Keck I telescope. Construction for NIRC was initiated in 1989 and completed by the end of 1992. The primary detector for NIRC was a Santa Barbara Research Corporation (SBRC) ALADDIN (Astronomical Large Area Detector Development on InSb) pixel array. First light was obtained in March of 1993 on the Keck I telescope (Matthews & Soifer 1994a, 1994b).
Thanks to a careful optical design, NIRC achieved low background levels which allowed for sensitive imaging and grism (low resolution) spectroscopy in the wavelength range of 1–5 m. In 1995, an image expander module was added and this allowed for high resolution imaging via speckle imaging131313this mode was listed as “NIRCs” in the scheduling logs. (Matthews et al., 1996). The same mode was used later on for aperture masking experiments (Tuthill et al., 2000). The instrument was decommissioned following the run of 30 January 2010. NIRC can now be found in the lobby area of the WMKO head quarters in Waimea (Kamuela), Hawaii.
4.2. Low Resolution Imaging Spectrometer (LRIS)
As with NIRC, the study for LRIS began in 1987. LRIS, following the venerable Double Beam Spectrograph (DBSP; Oke & Gunn 1982)141414 This workhorse spectrograph, built by J. Beverley Oke and James E. Gunn, is still in operation at the 200-inch Palomar telescope. It has undergone more than six detector upgrades over its lifetime. had one arm optimized for blue bands and the other for red bands. LRIS, as implied by its name, also had an imaging mode. Unlike the previous generation of (long-) slit spectrographs, LRIS was designed to routinely undertake multi-object spectroscopy. The PIs were J. Beverly Oke and Judith G. Cohen, both of Caltech.
Construction of LRIS was completed in 1992 and installed at the Cassegrain focus of the Keck I telescope. First science light was achieved in the summer of 1993 (see Oke et al. 1995). Owing to financial reasons only the red arm was populated for first light. Following first light some repairs were undertaken between 1994 and 1996.
The blue arm of LRIS was populated as a part of the “LRIS-Blue” (LRIS-B) upgrade project. This project was led by James K. McCarthy and Charles C. Steidel, both at Caltech, and lasted from 1995 through 2000. The addition of the blue channel thus doubled the data (with the existing channel providing the red spectrum or red image). In 2002 the original Tektronix (SITe) 2K2K 24-micron pixel array detector was replaced by a blue-optimized Charge Coupled Device (CCD) mosaic of two EEV 2K4K pixel array CCDs with 15 m pitch. The new CCD mosaic not only offered a better match to the spectral resolution but also increased the nominal spectral coverage by 25%. The primary references for the LRIS-B project are McCarthy et al. 1998 (the design) and Steidel et al. 2004 (the performance).
The availability of red sensitive CCDs (deep-depletion CCDs) made it attractive to replace the original Tektronix chip by a mosaic of two 2K4K pixel fully depleted, high resistivity CCDs for the red arm. In addition, the electronics were upgraded and a new focus mechanism installed. This project was led by Constance M. Rockosi of the University of California at Santa Cruz (UCSC). The initial CCD was found to be unreliable and a replacement was installed by end of 2010. The official reference for this upgrade is Rockosi et al. (2010).
The “Atmospheric Dispersion Corrector” (ADC) project was headed by Joseph S. Miller and A. “Drew” Phillips, both from UCSC. The project was initiated in 2003 and the ADC was commissioned in 2007 (Phillips et al., 2008). The ADC increases the flexibility of the multi-object spectrograph mode (the slit mask can be designed without paying attention to parallactic angle) and also makes possible increased target throughput for single object spectroscopy.
4.3. High Resolution Spectrograph (HIRES)
As with the previous two instruments HIRES was selected following a call for first-light instruments for the Keck I telescope (although the conceptual idea and early design started in 1983). The project was led by Steven S. Vogt of UCSC. It took five years (1988–1993) to design and build the instrument. First light was achieved on July 16, 1993. Further details on the instrument can be found in Vogt et al. (1994). HIRES is mounted on one of the Nasmyth ports of the Keck I telescope. Consequently, as the telescope moves in the sky (tracking the source), the sky image rotates with respect to the detector. The image motion then limits the integration time. The “de-rotator” project was led by David R. Tytler of University of California at San Diego (UCSD; during the period 1997–1999).
HIRES was originally built for high resolution spectroscopy of stars and quasar absorption line studies. The optical design is versatile to accommodate operation in the entire band 0.3–1.2 m. Over time it has been extensively used for extra-solar planet searches via precision radial velocity (RV) studies. To this end an insertable Iodine cell and an exposure meter were added.
In 2004, Vogt led a project to replace the original engineering grade 2K2K pixel Tektronix CCD with a mosaic of three science grade CCDs (2K4K pixel MIT Lincoln Lab). The smaller pixel size (15 m) of the new detectors was better suited to the HIRES camera. Furthermore, the three CCDs are each optimized for the wavebands of the dispersed spectrum (more precisely, two are blue sensitive and one is red sensitive). The upgrade contributed to both an increase in the spectral coverage by a factor of three and also improved the precision in RV from 3 m s-1 to 1 m s-1 (Butler et al., 2006). To my knowledge there is no official reference which summarizes the technical details of the upgrade.
HIRES is noteworthy for two reasons. First, early on, a pipeline to reduce the data was available (MAKEE) – a novelty (at least for the California community) in those days. The pipeline allowed for rapid exploitation of HIRES data. This became particularly important following the upgrade of HIRES. Second, starting 2004 the data from HIRES were archived at the newly formed Keck Observatory Archive (KOA). The success of the HIRES archive project led NASA to mandate that KOA begin a phased approach to ingesting data from all other Keck instruments (see §9).
4.4. Echellette Spectrograph & Imager (ESI)
ESI is a medium-resolution spectrograph with imaging capability (Sheinis et al., 2000). The instrument has an echellete grating and two prisms for cross-dispersion. In the low dispersion mode, 50 to 300 km s-1, the dispersion is provided by prisms. This mode has high throughput but owing to the large number of sky lines (in the red region of the spectrum) this mode is only popular with astronomers interested in the study of blue objects. In the echellete mode, the two prisms cross-disperse the beam diffracted by the echellete grating. The spectral resolution is moderate, about 50 km s-1 over the entire range 0.39–1 m. The moderate spectral resolution is well suited to kinematics, abundance studies of faint stars (especially giant stars in the Local Group) and faint galaxies and absorption line studies of quasars.
The project was led by J. Miller of UCSC. The instrument was officially commissioned towards the end of 1999 (Sheinis et al., 2002). In early 2010 an Integral Field Unit (IFU) capability was commissioned.
4.5. Near-Infrared Echelle Spectrograph (NIRSPEC)
NIRSPEC is a cross-dispersed echelle spectrograph that operates in the 0.95–5 m band. The instrument has two spectral modes: high spectral resolution mode with a resolution of about 25,000 and a low spectral resolution mode with a resolution of 2,300. An SBRC SBRC ALADDIN-3 pixel array (27 m pitch) served as the detector for the spectroscopic channel while a Rockwell pixel PICNIC array (see Appendix A) served as the detector to view the slit (“SCAM”). An Inmos T805 transputer was used for data acquisition and processing.
NIRSPEC can be mounted at either of the two Nasmyth ports of the Keck II telescope. It can be used in a stand-alone mode (seeing-limited) or behind the Keck II AO system which is mounted on the “right” Nasmyth port (§5). This latter mode is referred as “NIRSPAO”. The NIRSPEC project was led by Ian S. McLean of the University of California at Los Angeles (UCLA). The primary reference paper for the instrumentation is McLean et al. (1998).
The NIRSPEC project ran from October 1994 through September 1999. First light was achieved on April 23, 1999. A refurbishment of some gears and motors was also performed in 2000. In the same year the NIRSPAO mode was implemented. This necessitated fore optics for zooming the input image and a corresponding smaller pupil stop in the filter wheel. While the main strength of NIRSPEC is spectroscopy some astronomers have used SCAM for purely imaging purposes.
As we go to press there are major plans to upgrade NIRSPEC. The ALADDIN-3 detector will be replaced by an H2RG (with 18 m pixels). The expected increase in sensitivity is a factor of six (photon limited case)! For SCAM the PICNIC detector will be replaced by an H1RG (but with a long wavelength cutoff of 5 m). The transputers (which were already recognized to be obsolescent at the time of commissioning) will be replaced with current digital gateware and computer hardware. There are also plans to enable a precision radial velocity mode, replete with an NIR laser comb.
4.6. Deep Imaging Multi-Object Spectrograph (DEIMOS)
DEIMOS is a multi-object optical spectrograph optimized for studying large scale structure of the Universe (via spectroscopy of galaxies). It is mounted at the “left” Nasmyth focus of the Keck II telescope. The spectrograph employs an array of eight red-sensitive CCDs. Sufficient spectral resolution in the red band allows for minimization of bright terrestrial OH lines. The effective slit length on the sky is 17 arc minutes (a second barrel, if built, will add an equal length slit in an adjacent field). The key feature of DEIMOS was the wide-angle camera, which offered both a long slit length and a wide spectral coverage. The project was led by Sandra M. Faber of UCSC and the official reference is Faber et al. (2003). The project ran from 1993 to 2002. First light was achieved in Spring of 2002. DEIMOS was unique (140 galaxy spectra at a time) at the time it was built and was only matched by IMACS which was commissioned on Magellan in 2004 (Dressler et al., 2011). DEEP151515http://deep.ucolick.org// (Deep Extragalactic Evolutionary Probe) was a major survey undertaken at WMKO (PIs: M. Davis of UCB and S. Faber of UCSC) and the primary motivation for DEIMOS. Other notable studies with DEIMOS include “galactic archaeology” studies (multiplexed spectroscopy of stars in the Galactic disk, in the near and distant halo, in satellite dwarf galaxies and in M31).
4.7. Near Infra-Red Camera 2 (NIRC2)
The Near Infra-Red Camera 2 (NIRC2) was designed to be the primary imager for the Observatory’s Adaptive Optics system (both Laser Guide Star and Natural Guide Star; §5). The instrument is located behind the AO bench at the right Nasmyth focus of the Keck II telescope. Three pixel scales allow for diffraction limited imagery in through M bands. The detector is a 10241024 pixel ALADDIN-3 array. The filter wheel accommodates a large number of filters over the spectral range 0.93–5.3 m. Two prisms allow for low and medium-resolution slit spectroscopy. A choice of pupil masks (including non-redundant pupil masks) and coronagraphic stops (including an L-band vortex coronagraph, installed in 2015) allow for low background and high contrast imaging and spectroscopy. The principal investigators were K. Matthews and B. T. Soifer.
With the view of undertaking decade-long astrometry, careful attention was paid to keep NIRC very stable. Construction for NIRC2 began in 1994 and concluded in 2000. First light was achieved in the summer of 2001. Since there is no paper detailing the design and performance of the instrument the reader is directed to the instrument homepage161616http://www2.keck.hawaii.edu/inst/nirc2/ for further details.
4.8. OH-Suppressing Infrared Imaging Spectrograph (OSIRIS)
OSIRIS is an IFU spectrograph operating in the NIR band. It was designed to take advantage of diffraction limited images made possible by the Observatory’s Adaptive Optics system (§5). The principal investigator (PI) of the project was James Larkin (UCLA) and the co-PI was Alfred Krabbe (UCB). A lenslet array feeds a rectangular patch (1000 spaxels) of the sky into a moderate spectral resolution () spectrograph which can operate from the band through K band. The 1000-spaxel format is suitable for imaging compact objects (0.3 arc seconds to 3 arc seconds in the short axis). With the advent of a second LGS system on Keck I (see §5) OSIRIS was moved to Keck I in late 2012.
The design study for OSIRIS was undertaken in 1999. First light was achieved during 2005. The primary reference for OSIRIS is supposed to be Larkin et al. (2006a). However, I have also included the reference Larkin et al. (2006b) since it appears to have garnered more citations than the officially favored instrument reference.
Shortly after OSIRIS was commissioned it became clear that the throughput of the instrument was lower than expected. It was traced to a grating which was not manufactured to specifications. Finally in 2013, a new grating was installed. As a result OSIRIS achieved the sensitivity that was expected from the initial design (Mieda et al., 2014). In early 2016 the spectrograph detector (a Hawaii-2) was replaced with a Hawaii-2RG. An ongoing project is to replace the current imaging detector (H1) to an H2RG (the FOV remains unchanged at 20 arc seconds but the finer pitch will lead to 10 mas pixels).
4.9. Multi-Object Spectrograph for Infra-Red Exploration (MOSFIRE)
MOSFIRE, a multi-object near-IR (0.97–2.1 m) spectrograph and imager, is the latest addition to the stable of facility instruments (McLean et al., 2012). The instrument is notable for its “on-the-fly” configurable slit mask. The user can obtain moderate resolution () slit spectra of 46 objects spread over a field-of-view (FOV) of 6 arc minutes by 6 arc minutes. Cryogenic cooling of the slit mask, a low-noise 2K2K pixel Hawaii-2RG detector and the large collecting area of the Keck telescope makes MOSFIRE perhaps the most sensitive NIR multi-object spectrograph at the present time. The instrument can be mounted at the Cassegrain focus of the Keck I telescope. The principal investigators are I. S. McLean of UCLA and C. C. Steidel of Caltech. The project171717 The first attempt for a multi-slit IR spectrograph was KIRMOS. Following the preliminary design phase (2002–2005) the estimated cost of the rather ambitious instrument was deemed to be too high to warrant construction. KIRMOS was then abandoned. began in 2005 and the instrument completed by April 2011. However, just prior to shipping the instrument from Caltech to Hawaii, it was discovered that the WMKO rotator bearing assigned for MOSFIRE was defective. A new bearing had to be manufactured. The long delay and unanticipated manufacturing increased the cost of the project. First light was achieved in early April 2012.
4.10. Other Instruments
The same forward Cassegrain module that housed NIRC had the ability to also accommodate both NIR/MIR IR instrument. The facility Long Wavelength Spectrometer (LWS; Campbell & Jones 2004) was on the Keck I telescope for a total of 363 nights. The primary detector was a pixel Boeing Si:As moderate flux array (with 75 m pitch). The wavelength range for the detector was 3.5–25 m. LWS had both imaging and long slit spectroscopic modes181818https://www2.keck.hawaii.edu/inst/lws/. The Long Wavelength Infrared Camera (LWIRC)191919https://www2.keck.hawaii.edu/inst/lwirc/lwirc2.html was an imaging camera in the m band. It too was based on pixel Si:As doctor array and was a part of the NIRC/LWS suite. However, LWIRC did not proceed to commissioning.
The Keck Interferometer used both telescopes and was entirely funded by NASA (Colavita et al., 2013). Originally it was envisaged to include a collection of smaller telescopes (“outriggers” or “side-Kecks”) for year-round precision astrometry and occasional Keck I–Keck II interferometry (visibility and nulling) to characterize the distribution of zodiacal dust in a sample of nearby Sun-like stars. The first phase of the project was the development of the standard visibility mode (“V2”; commissioned in 2001) followed by the “Nuller” mode. Phase referencing methodology (first demonstrated at the Palomar Testbed Interferometer; Colavita et al. 1999) was successfully undertaken with the Keck I–Keck II interferometer (the “ASTRA” project; Woillez et al. 2014).
To complete the census of the allocated nights I note “guest” or
Principal Investigator (PI)
instruments202020http://www2.keck.hawaii.edu/realpublic/observing/
public_instrument_info/vis/index.html:
MAPS, STEPS, MIRLIN and OSCIR. These together obtained a
total of about four months. Finally, about 5% of the nights appear
to have been used for engineering, commissioning new instruments
and other purposes.
| System | Tel | Year | Cost |
|---|---|---|---|
| ($M) | |||
| NGS | II | 1999 | 4.0 |
| LGS | II | 2004 | 7.5 |
| WF-Upgrade | II | 2007 | 2.2 |
| Center-Launch | II | 2014 | 2.6 |
| TOPTICA-Laser | II | 2015 | 4.0 |
| NGS | I | 2002 | 3.0 |
| LMCT-Laser | I | 2011 | 3.1 |
| LGS-Infrastructure | I | 2012 | 5.5 |
| NIR-Tip-Tilt | I | 2014 | 3.4 |
Note. — From left to right: The name of the AO system or sub-system followed by the telescope number on which it is located, the year of commissioning and the cost for the project.
5. Adaptive Optics
The ability to exquisitely align the 36 segments limited only by the roughness of the segment surfaces (40 nm to 80 nm) allows the Keck telescopes to take full advantage of the superb seeing of Mauna Kea (Chanan et al., 1998; Chanan, Ohara & Troy, 2000). Provided the seeing cooperates the Keck telescope can produce images with 0.4 arc-second full width at half maximum in the visible (Wizinowich et al., 1994). This exquisite performance when combined with the large diameter, , of the Keck telescope makes AO a natural strength212121 The gains for AO grow as where to , depending on what quantity is being measured. of the Observatory. As a result, planning222222see footnote 9. for AO began immediately after commissioning of the first Keck telescope (Wizinowich et al. 1994b).
In early 1999 an NGS AO system was commissioned on the Keck II telescope (being located at the left Nasmyth focus; Wizinowich et al. 2000). Routine observations began in the Fall of 1999. The system was based on a 349-actuator Xinetics deformable mirror and a 6464 pixel fast-readout CCD. Following the commissioning of the AO system “KCAM” (built primarily for engineering purposes and so lacked the usual accoutrements of a science camera) served as the science camera. Starting 2001 NIRSPEC (and soon thereafter NIRC) was used as the science instrument behind the AO system. Two years later an identical NGS AO system for Keck I, located also at the left Nasmyth station, was commissioned (see Wizinowich et al. 2003).
The Observatory’s AO roadmap called for a LGS assisted AO. The laser guide star can be used to infer most of the wave front distortion but not the phase gradients (which lead to tip-tilt errors). A natural guide star is still needed for this purpose but it can be much fainter (approaching of 19) as compared to a purely NGS AO system ().
A 13-watt Sodium dye laser supplied by the Lawrence Livermore Laboratory was installed at the Keck II telescope and LGS observations began in 2004 (van Dam et al., 2006; Wizinowich et al., 2006). In 2007 a major improvement was undertaken for both the Keck I and Keck II AO systems. The wave-front sensor and wave-front electronics were upgraded. As a result the quality of correction (Strehl ratio for bright stars) increased from 0.58 to 0.71 and the limiting magnitude for NGS AO also improved (); see Johansson et al. (2008).
When first commissioned, the Keck II laser was launched using a telescope mounted to the side of the Keck II telescope. As a result, there was a perspective elongation of the Laser Guide Star as seen by the AO wave-front sensor, due to the thickness of the sodium layer. The elongation naturally reduces the quality of corrections. This elongation can be reduced by having the launch telescope behind the secondary mirror and thus aligned to the axis of the telescope. A center-launch system is now in routine use since mid 2015.
A program to replace the aging dye laser with a modern Raman fiber-amplified laser (made by Toptica Photonics; Friedenauer et al. 2012) was completed recently. The Toptica laser has been in routine use since April 2016. The return signal is 19 times higher than that of the dye laser owing to a combination of higher input laser power and (expected) better coupling efficiency to the sodium layer (P. Wizinowich, pers. comm.).
The Keck I AO system began shared risk observations in the summer of 2012 (Chin et al., 2012). The National Science Foundation (NSF) funded Lockheed Martin Coherent Technology (LCMT) to build lasers for the Gemini Observatory and WMKO. The LMCT laser is a 20 W solid-state CW laser (Sawruk et al., 2010).
The next improvement was to implement tip-tilt corrections based on measurements undertaken in the NIR (Wizinowich et al., 2014). The primary advantage of using NIR tip-tilting sensitivity is both increased Strehl ratio and sky coverage. To this end an NIR tip-tilting system based on a Hawaii-2RG detector (listed as NIR tip-tilt in Table 2) was designed. In detail, dichroics are used to send either the Ks-band or H-band light, over a 100 arc second square field, to the NIR detector. Tip-tilt measurements are undertaken on the AO-corrected core of the NGS image of the natural guide star. When using Ks-band light the sky fraction over which the 1-D rms tip-tilt error is less than 20 mas increases from the older value of 45% to 75%. This sub-system was commissioned in 2014 and became routinely usable in 2015. The reader is referred to Table 2 for a comprehensive summary as well as the timetable of both the AO systems.
| # | Instr. | Tel | Period | Nights | OSF |
|---|---|---|---|---|---|
| 2 | NIRC | I | 1994–2010 | 926 | 0.5 |
| 3 | LRIS | I | 1994– | 3209 | 0.7 |
| 4 | HIRES | I | 1994– | 2692 | 0.8 |
| 5 | ESI | II | 2000– | 654 | 0.8 |
| 6 | NIRC2 | II | 2000– | 1185 | 0.4 |
| 7 | NIRSPEC | II | 2002– | 1533 | 0.6 |
| 8 | DEIMOS | II | 2001– | 1262 | 0.7 |
| 9 | OSIRIS | I | 2005– | 549 | 0.6 |
| 10 | MOSFIRE | I | 2013– | 456 | 0.6 |
Note. — The allocation of nights for period starting with semester 1994B and ending with 2015B Number of nights on Keck-I: 8050. Number of nights on Keck-II: 7596. The fraction of nights used by above instruments is 80%. # is an internal index. The years over which the instrument was (and continues to be) used is given by “Period’. We make no distinction between NIRSPEC or NIRSPAO, LRIS-R or LRIS-B or LRIS-ADC or LRIS, NIRC or NIRCs and HIRES, HIRESr or HIRESb.The last column is the “open shutter fraction” – the fraction of time, say over a typical night, that the shutter is open. The OSF values reported are from R. Goodrich who undertook the analysis in 2013. The OSF for MOSFIRE was provided by M. Kassis (measured in 2016).
6. Data, Methodology & Metrics
6.1. Primary Data
The primary data for the analysis is the bibliography232323 http://www2.keck.hawaii.edu/library/keck_papers.html of refereed papers maintained by Peggi Kamisato, the official librarian of the W. M. Keck Observatory. For every paper, Kamisato lists the following attributes: Authors (limited to first six authors), Title of the paper, Journal name, Volume, First page, Year of publication, Instrument(s) used and the bibcode.242424A unique identifier to each paper by the SAO-NASA Astrophysics Data System (ADS). See http://adsabs.harvard.edu The assignment of the instruments were made by Kamisato based on her scanning the literature and reading of the papers. For the analysis presented here, I have considered all Keck papers from 1993 through the end of 2015.
At the time I began my analysis, the data base was expected to be complete going forward from 1996. Kamisato and I did a search of the literature and added papers for 1994 and 1995. Next, about 150 papers lacked instrument entry. For about half the papers Kamisato did not have easy access (primarily commercial publications for which the WMKO did not carry a subscription) and those for which an instrument assignment was not clear (see below). I read these papers and made the instrument assignments. For a fraction of the cases the assignment was difficult to make because the authors do not provide sufficient details other than thanking the W. M. Keck Observatory. Through patient reading, in most cases, I could discern the instrument used.
Curiously, the same problem – papers thanking WMKO but not citing the instrument used – has arisen for a number of papers published in the last few years (2013–2015). I wrote letters to authors that I knew and Kamisato received clarifications (in most cases). There still remain a total of about 30 papers that are yet to be classified.
6.2. Usage of Nights
Starting from the commissioning252525The first official science run appears to have taken place on 1-October-1994. of Keck I through semester 2015B262626A year, as is the tradition in many observatories, is divided into two semesters. The “A” semester starts 1 February and the “B” semester starts 1 August., using the “Query” tool272727http://www2.keck.hawaii.edu/schedule/schQuery.php provided by WMKO, I found a total of 8050 nights were available on Keck I. The Query tool shows that between commissioning282828The first official science run appears to have taken place on 1-October-1996. of the Keck II telescope through the end of 2015B a total of 7056 nights were available on Keck II. This tool shows the nominal instrument for each night. However, for the purpose of this paper, I used a spreadsheet maintained by Gloria Martin of WMKO which properly apportions the night between multiple allocations (e.g. half nights used for science with the other half for engineering etc).
Sometimes the scheduling logs list, for the same night, NIRC and LWS. Both these instruments were sited at the forward Cassegrain focus of the Keck I telescope. The designation “NIRC-LWS” meant that the primary instrument for the night was LWS where the designation “NIRC/LWS” meant that the two instruments shared the night (R. Campbell, WMKO, pers. comm.). These nights were attributed equally to NIRC and LWS (so that no night is double counted).
The allocations of nights by instrument is summarized in Table 3. From this table we can see that the workhorse instruments were allocated nearly 80% of the available nights. The engineering (telescope, commissioning, repairs, AO) represented 10% of the total available nights. The remaining 10% was used as follows. The interferometer project which lasted from 01A through 12A used 275 nights (sum of Keck I and Keck II nights) for observing in either V2 or Nuller mode (and paltry nights for “Ohana”) and 346 nights for associated engineering. LWS used 246 nights and the remaining 159 nights went to guest and PI instruments.

6.3. Methodology
I wrote a series of MATLAB programs to analyze Kamisato’s database. Each Keck paper is assigned a structure. The attributes of each paper in Kamisato’s database are assigned to the structure. For each bibcode I wrote a program that queried the ADS (see footnote 24) database and obtained information of papers citing a given Keck paper. The data thus obtained were filtered to obtain , the number of citations in year to Keck paper with index (whose year of publication is ). This list was added as an element to the structure.
The rest of the analyses worked off the structures. All the analyses programs use these structures as the inputs, filter them on instruments and directly produce all the Tables (in LaTeX format), the Appendix (also in LaTeX format) and all the Figures displayed in this paper.
| Inst. | ||||
|---|---|---|---|---|
| NIRC | 247 | 15564 | 3.7 | 16.8 |
| LRIS | 1497 | 144585 | 2.1 | 45.1 |
| HIRES | 1202 | 80455 | 2.2 | 29.9 |
| ESI | 293 | 24220 | 2.2 | 37.0 |
| NIRC2 | 461 | 19573 | 2.6 | 16.5 |
| NIRSPEC | 484 | 27040 | 3.2 | 17.6 |
| DEIMOS | 654 | 42936 | 1.9 | 34.0 |
| OSIRIS | 104 | 3842 | 5.3 | 7.0 |
| MOSFIRE | 54 | 1521 | 8.4 | 3.3 |
Note. — Columns (from left to right): is the total number of papers is the sum of citations. However, rather than display fractional numbers I display the inverse, (or the number of papers per night. is the number of citations per night.
| Inst. | |||
|---|---|---|---|
| NIRC | 65 | 36 | 63 |
| LRIS | 162 | 42 | 97 |
| HIRES | 141 | 40 | 67 |
| ESI | 81 | 41 | 83 |
| NIRC2 | 67 | 23 | 42 |
| NIRSPEC | 79 | 29 | 56 |
| DEIMOS | 103 | 34 | 66 |
| OSIRIS | 36 | 25 | 37 |
| MOSFIRE | 24 | 22 | 28 |
Note. — is the h-index, is the median and is the mean number of citations per paper.
6.4. Aggregate Metrics
I define the productivity of an instrument as the number of nights taken to produce a paper (Table 4). The productivity is computed by taking the ratio of the total number of papers ascribed to that instrument to the number of nights allocated292929Thus nights lost due to inclement weather or instrument failure will adversely affect the productivity. to the same instrument. The latter number can be found in Table 3. The impact of the instrument is measured by a number of attributes. One is the number of citations per night of observing (Table 4). Other measures of impact are the H-index (Hirsch, 2005), the mean and median of the number of citations (Table 5) and the collection of the most cited papers (Appendix C).
6.5. Flux Curves
Here I discuss functions of metrics which capture the temporal evolution of the productivity and impact of the Observatory.
-
1.
The annual flux of refereed publications, . This curve is obtained by binning the list by the year of publication. This is a widely used metric.
-
2.
The sum of citations from publication to the present year () of the th paper is
(1) Colloquially, is referred to as the “number of citations” and colloquially further simplified to “citations” for that paper. However, changes with time (for young papers usually increasing with ; for older papers it remains constant with ; when a subject is revived, citations to an old and dormant paper flourish again). As a result does not lend itself to a clean interpretation. However, it does have some limited use (see §8.1).
-
3.
The citation flux curve, measures the number of new citations generated by a given list of Keck papers in a given year (). The easiest way to understand this curve is to view as a response function of the th paper, launched at . In order to compute the citation flux curve in year one needs to sum the response function of all the relevant Keck papers prior to that year. Mathematically, the citation flux curve is given by
(2)
In §7 I present the paper and citation flux curves for the principal instruments of the Keck Observatory.
I make some observations about the the flux time series curves303030All the way up to the pre-submission version I used the term “light” curves on the basis that astronomers would both appreciate and understand the curves. However, several colleagues found this term to be confusing and so I have switched the pedantically correct term, flux time series curve or flux curve for short.: and . On general grounds we expect to rise slowly and then reach a plateau as users become familiar with the instrument and data reduction tools mature. Once the “low hanging fruit” projects are finished will likely decline (unless a major discovery opens up new avenues of investigation). Additionally, the decline will be precipitated by the arrival of similar but more powerful instruments, usually, at other observatories. In such a case, most users of the Observatory will find themselves to be not competitive and switch their attention to other projects.
In order to interpret the citation flux curve it is worth noting that there is a lag between the publication of a paper and the accrual of citations. Therefore, one generally expects a typical flux curve to rise quite slowly, relative to , enjoy a plateau and then gradually decline. Next, an important paper is also durable which means that it keeps getting cited for many years. As a result, we can make three general observations.
-
I.
The higher the value of the peak flux (the value of the plateau flux) the higher the impact of the instrument.
-
II.
The larger the duration of the plateau, as measured by the width of , the higher the productivity of that instrument.
-
III.
A decreasing almost always signifies that the instrument should be retired.
7. Analysis: Flux Curves & Performance Metrics
The productivity and impact of the instruments of the Keck Observatory (as defined in §6.3) are summarized in Table 4 and Table 5. The flux curves of all the instruments are summarized in Figure 1. The flux curve of each instrument can be found in §7.1–§7.5.
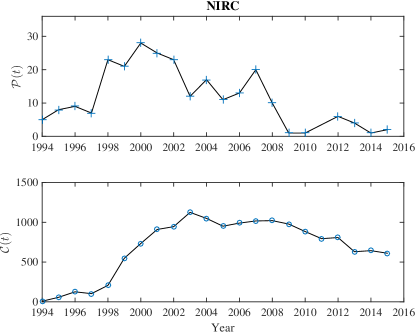

7.1. NIRC
The flux curves of NIRC (Figure 2) are worthy of further study because NIRC did not undergo an upgrade whereas there has been a steady increase in both the format and performance of NIR detectors (and chronicled in Appendix A). As a consequence, NIRC has been subject to strong external forces. Thus in some ways NIRC provides an ideal “test” instrument for the purpose of this paper.
The NIRC paper production reached a peak six years after commissioning and this was followed by a linear decline. In contrast, the citation flux curve reached a plateau nearly ten years after commissioning and is now slowly declining. The lag between paper production and garnering of citations is not unexpected. For future discussion I note that the width of plateau of is in excess of a decade.


7.2. ESI, NIRSPEC, DEIMOS
These three instruments are unified by the fact that they have not undergone (significant) upgrades. The paper curve of ESI mimics that of NIRC (except shifted in time). The impact of ESI remains quite high though (see Table 5).
The peak in paper flux of NIRSPEC appears to have been reached in 2007 (with a value of 48 papers per year). The paper flux averaged over the last five years is 31 papers per year. So we conclude that NIRSPEC peaked in paper production between seven to ten years post commissioning. However, unlike, NIRC, the citation flux did not plateau at the 10-year mark. The flux rose, albeit slowly.
Within Poisson errors, DEIMOS has a steady rate of paper production starting about five years after commissioning. The citation flux has grown year after year. Arguably the citation flux is now peaking.


7.3. LRIS and HIRES
LRIS and HIRES are remarkable instruments. These two first light instruments show no fatigue in productivity. Perhaps this continued fecundity is due to upgrades. After all, LRIS received upgrades in 2000, 2007 and 2010 (see §4.2) and HIRES was upgraded in 2004 (see §4.3).

7.4. NIRC2, OSIRIS & MOSFIRE
The paper production of NIRC2, even ten years after commissioning, is still rising as is the citation flux curve (Figure 8). Since NIRC2 is only used behind the AO system the fate of NIRC2 is firmly tied to improvements in the AO system. From Table 2 we note there has been significant investment in improving AO (on both Keck I and Keck II) for the past decade. The continued rise of and is thus reasonable. The modest flux of papers for OSIRIS has been noted by several colleagues (see §9 for further discussion). MOSFIRE is too young an instrument to warrant a detailed discussion.


7.5. Adaptive Optics
The number of AO papers (which means both NGS and LGS) is 640 and the total number of citations currently stands at 25,987. As can be seen from Table 4 most of these contributions come from NIRC2, OSIRIS and NGSPAO. The difference of about a hundred papers are due to Keck interferometry and KCAM. The citation flux curve is shown in Figure 10. The H-index of AO publications is 75 and the median of the number of citations is 23. About 8% of the citations arise from the methodology of AO.
8. Inferences
8.1. The Observatory Flux Curves
The annual paper flux, and , the total citations nominally accrued in a given year (Equation 1), are summarized in Table 7; note that is not the same as (see §6.5). The citation flux curve for the Observatory as a whole (summing over the instruments), , is displayed in Figure 11. The annual flux in 2015 is about 30,000 citations per year. It is quite impressive to see a linear growth lasting nearly two decades. [I do note that the flux curves for all instruments as well as the total number of papers show either a reduction or no change between 2013 and 2014–2015.]
In Figure 12 I plot . The numerator is the sum of citations gathered by papers published in year (see Equation 1 and the discussion surrounding it); it is not the citation flux curve, . The denominator is the number of papers published in the same year. As can be seen from this figure papers published in the first six years of the Observatory’s beginnings (1994-2000) had a distinctly higher impact relative to those published in later years. This plot is a dramatic illustration of the great benefit enjoyed by WMKO by being “first on the block”.

| Inst. | Tops |
|---|---|
| NIRC | 633 540 538 507 455 440 420 382 350 |
| LRIS | 9000 9000 2983 1869 1736 1607 1438 1400 1286 |
| HIRES | 808 804 628 624 580 566 556 471 410 |
| ESI | 870 743 689 675 643 632 538 471 424 |
| NIRC2 | 828 719 713 535 422 399 360 240 223 |
| NIRSPEC | 2983 675 661 632 422 350 321 318 272 |
| DEIMOS | 1869 1192 767 743 646 509 481 471 422 |
| OSIRIS | 214 152 147 132 113 103 100 100 97 |
| MOSFIRE | 133 106 87 73 72 63 59 55 47 |
Note. — The number of citations of the top 9 papers arising from each Keck facility instrument
In §2 we noted that the singular or exceptional impact of an instrument (or an author, for that matter) is measured by the highest cited papers. Initially I thought listing the top five papers (for each instrument) would be adequate. However, I realized that a few papers claimed the top spots for several instruments. The most heavily cited papers from LRIS, DEIMOS and ESI are all related to the same topic – the use of supernovae for cosmography. Progress in cosmography is important but like many great successes in life there are numerous claimants. In particular other observatories also assert their mighty contributions to supernova Ia cosmography. Thus in order to assess the unique contribution of Keck, I expanded the list to the top nine papers (Table 6). The titles of these papers can be found in the Appendix (§C). The reader is urged to look at this list of papers to appreciate the singular (and distinct) returns from each of these instruments.

8.2. The High Impact of Optical Instruments
As can be gathered from Tables 4 & 5 and Figure 1 optical instruments are both productive and also have a larger impact relative to NIR instruments as well as AO-assisted observations. Along this line, I note that both ESI and NIRC did not receive any upgrades since commissioning. Yet ESI had a higher return relative to NIRC.
There are two strengths that optical instruments enjoy relative to NIR: (i) natural background that is orders of magnitude smaller in the optical relative to NIR and (ii) detectors that are nearly perfect in their response (with virtually no dark current). NIR instruments win only when the natural conditions favor them: objects suffering from extinction (the poster child here is observations of the stars in the center of our Galaxy) or when the diagnostics are uniquely in the NIR band (e.g. cool objects such as brown dwarfs, asteroid spectroscopy). While beyond the scope of this paper it is worth noting that the IR/AO communities are smaller than the optical community and this may introduce a bias (Pepe & Kurtz, 2012).
| Year | Papers | |
|---|---|---|
| 1994 | 11 | 749 |
| 1995 | 36 | 4202 |
| 1996 | 53 | 9740 |
| 1997 | 68 | 8040 |
| 1998 | 109 | 22204 |
| 1999 | 127 | 21159 |
| 2000 | 169 | 16185 |
| 2001 | 175 | 15884 |
| 2002 | 193 | 14226 |
| 2003 | 211 | 22004 |
| 2004 | 214 | 18397 |
| 2005 | 232 | 18659 |
| 2006 | 277 | 21498 |
| 2007 | 312 | 22373 |
| 2008 | 262 | 19390 |
| 2009 | 269 | 15671 |
| 2010 | 289 | 16979 |
| 2011 | 297 | 15811 |
| 2012 | 337 | 14515 |
| 2013 | 319 | 10375 |
| 2014 | 291 | 6230 |
| 2015 | 292 | 3075 |
Note. — columns from left to right: year, the total number of papers published in the year and the number of citations accrued by the papers published in that year. As noted in §6.5 and Equation 1 the value of depends on the time at which the sum is evaluated. The exercise was undertaken in May 2016.
8.3. The Longevity of Instruments
From an inspection of the paper generation curves I conclude that instruments which have not undergone significant upgrades achieve a peak between five to eight years after commissioning (e.g. NIRC, ESI and NIRSPEC). Some care should be exercised in interpreting the flux curves of NIRC2 and OSIRIS since the full power of these instruments arises from the performance of the LGS AO system. As a result the impact of NIRC2 and OSIRIS can be expected to track improvements in the LGS AO system (which is undergoing considerable improvements since commissioning in 2004; see Table 2).
For the sake of argument we will accept the time for an instrument without any upgrades to peak is six years (and perhaps as much as ten years). Accepting this figure we ask the question: what sets this timescale? Before I discuss possible explanations for this duration I provide some background.
Progress in astronomy appears to take place in three phases: (i) discovery, (ii) a search for patterns (made possible by many measurements) and (iii) and the construction of a model to account for the regularities (e.g. see Kulkarni 2012). The culmination is when the model finds a natural explanation in known physics or leads to new understanding of physics. A famous example is (1) the recognition of planets as a new phenomenon (namely they move, unlike stars), (2) the gathering of exquisite data by Tycho Brahe and others and (3) a mathematical model by Johannes Kepler, culminating in a physical explanation for the mathematical model by Isaac Newton.
A modern and a far less dramatic example is the subject of brown dwarfs. The first couple of years following the discovery of the first brown dwarf constituted the period of “low hanging fruits”. Even a single observation of a brown dwarf resulted in a nice paper. Following this phase investigation shifted to systematic study of large samples. Naturally the paper production slows down during this period.
With this background, we offer two reasons to explain the decrease in with time. First, following either a discovery or the arrival of a powerful new instrument users exhaust “low hanging fruit” projects (in the sense as discussed above). Second, it may well be that the instrument becomes unattractive because other observatories start deploying instruments with larger reach or higher sensitivity. Users of the first telescope then do not find it attractive to spend their precious allocation on a fading asset.
I argue that the decline in productivity of NIRC is because of increasing obsolescence. The pixel InSb array detector of NIRC was state-of-the-art in 1993. However, the rapid growth in the format and quality of NIR detectors (see Appendix A for a summary of the great progress in NIR detectors) hastened the obsolescence of NIRC.
8.4. Upgrades
The first light instruments are NIRC, LRIS and HIRES. NIRC shows the expected classic behavior: peaking, as measured by paper production, about six years after first light and then gradually declining. In contrast, LRIS achieved a plateau six years later and is maintaining the plateau. A simple explanation for this continued productivity are the upgrades: Blue-channel (2000), ADC (2007) and Red-channel (2010). Likewise HIRES shows a rise to a plateau in the year 2000 and then undergoes another rise starting the year 2004. HIRES continues to show a sustained increase in both productivity and impact. I attribute this behavior in part to the 3-CCD upgrade that was undertaken in 2004 (the other reason is the continued blossoming of the extra-solar planet field).
| Instrument | Papers | Citations | Q(%) |
|---|---|---|---|
| NIRC | 247 | 223 | |
| LRIS | 1497 | 1699 | |
| HIRES | 1202 | 891 | |
| ESI | 293 | 237 | |
| NIRC2 | 461 | – | – |
| NIRSPEC | 484 | 425 | |
| DEIMOS | 654 | 423 | |
| OSIRIS | 104 | 113 | |
| MOSFIRE | 54 | 49 | |
| AO | 640 | 489 |
Note. — Name of the instrument, number of refereed papers () arising from the instrument and the number of citations to the fundamental paper(s) which describes the instrument (). is defined by Equation 3. For each instrument, the fundamental references are listed in various subsections of §4. In order these are NIRC (Matthews & Soifer 1994a-b); LRIS (Oke et al., 1995; McCarthy et al., 1998; Steidel et al., 2004; Rockosi et al., 2010); HIRES (Vogt et al., 1994); ESI (Sheinis et al., 2000, 2002); NIRSPEC (McLean et al., 1998); DEIMOS (Faber et al., 2003); OSIRIS (Larkin et al. 2006a-b) and the AO system (NGS & LGS; Wizinowich et al. 2000, 2006; van Dam et al. 2006). There is no entry for for NIRC2 since the builders did not publish a paper describing the instrument. The quoted values were measured at the time of the submission of this paper.
8.5. Are Builders Well Recognized?
Astronomy, particularly OIR astronomy, is perceived to have a culture that does not reward astronomers with instrumentation skills. Astronomers certainly appreciate the value of sophisticated instruments. However, whether this appreciation translates to tangible rewards, especially those which are valuable (faculty appointments) is unclear. Some areas of astronomy – radio astronomy (particularly research related to Cosmic Background Radiation, development of new facilities, pulsar research) – have a long tradition of rewarding astronomers with primary talent in instrumentation. Perhaps the difference lies in the fact that in the early history of optical astronomy (and extending through the era of large telescopes in California) the instruments were relatively simple and great value was (in effect) attributed to the astronomers who were able to secure time and make discoveries. However, over the past several decades the complexity of OIR astronomy instrumentation has dramatically increased and OIR now needs astronomers with technical background.
In Table 8, I present, for each Keck facility instrument as well as the AO system (NGS, LGS) the number of published papers () that can be ascribed to that instrument. As noted earlier (§4) some instruments have multiple references to the performance of the instrument (usually reporting a significant upgrade). I have summed up the citations from these papers (the papers are listed in the caption to Table 8 and present the total number of citations () for each instrument in Table 8). Consider the quantity
| (3) |
means that every paper which used a particular instrument acknowledged the builders of the said instrument. is the fraction of astronomers who use a Keck instrument without acknowledging the instrument team which made their observations possible. The users of NIRC, LRIS and OSIRIS and perhaps NIRSPEC can be argued (within Poisson noise) to have been grateful to the builders of the instruments. However, users of HIRES, ESI, DEIMOS and the AO system(s) appear to be quite lax in acknowledging the instrumentation teams that made their observations possible.
In case of LRIS we note . The explanation for this curious finding is that some of the observational papers refer to the original LRIS paper (Oke et al., 1995) as well as one or more upgrades (McCarthy et al., 1998; Steidel et al., 2004; Rockosi et al., 2010). Finally, as illustrated by the significant positive value of for LRIS (Table 8) a major upgrade clearly benefits by having its own instrument paper.
While here I only address “builders” in the usual sense of hardware the fact remains that software engineering is increasingly a major (and at times, even a dominant) aspect of modern instrumentation. Clearly, any such future analysis should also evaluate the returns to those who, with ingenuity and hard work, build data acquisition, data reduction pipelines and develop powerful software tools for use by observers.
I end this section with an editorial remark. The research undertaken for this project spread over many years and naturally over this time I beavered away at many locations: airports, committee meetings and visits to several institutions (domestic and otherwise). I came to appreciate the value of society journals such as PASP and AJ in terms of the ease of access from random sites. Very few institutions have paid subscription to commercial journals (especially the unrefereed SPIE proceedings ) and access is an issue. I urge instrument builders to bear this issue in mind and (1) publish their key paper (the performance of their instrument) in journals that are easily available at most institutions around the world and (2) post a copy of their published papers on any archive server (such as arXiv).
9. Archives & Pipelines
It is now well demonstrated that a high quality archive313131A good archive is not merely a collection of FITS files but one with an intelligent query interface and the ability to provide fully calibrated data and higher level products. In the absence of such products, the archives are essentially write-only storage of data. enables additional exploitation of the data collected from the observatories. For instance, in 2011, the 4-telescope VLT facility of ESO reported 550 refereed publications that were based on new data. An additional 100 papers arose from archival data analysis.323232 ESO Annual Report 2011, p. 30. The report can be found at http://www.eso.org/public/products/annualreports/. Thus, apparently, archival analysis can boost the productivity of a ground-based facility by about 20%.
The original operations model for WMKO did not include funding for an archive. Fortunately, as noted in §4.3, starting 2004 (a decade after commissioning of the telescopes), NASA funded a program – the Keck Observatory Archive (KOA). This enterprise is jointly operated by the NASA Exoplanet Science Institute (NexScI) and WMKO. KOA began with an ingestion of HIRES data. Within the annual budget of KOA, the ingestion of data from other instruments could be accommodated at a leisurely pace – one instrument every other year (or so). At the current time, KOA archives and serves public data333333Public data: data that no longer has any proprietary protection. The default proprietary period is 18 months though each partner can request longer extensions. for all facility instruments (Berriman et al., 2015).
Pettini et al. (2008) is the first paper citing the use of data from KOA. The reader should note the four year lag between the year of the publication of this paper and the launch of KOA. In 2015, forty three papers were published or about 15% of the total publications for that year. It is anticipated that the archival papers for 2016 may reach a fraction as large as 23% (H. Tran, pers. comm.). For comparison, the Hubble Space Telescope (HST) archive,343434https://archive.stsci.edu/hst/bibliography/pubstat.html widely reported to be the most productive archive, accounts for about 54% of HST papers. Returning to WMKO the late start of KOA (nearly 10 years following routine astronomical usage of the telescopes began) and the slow ingestion means that KOA is a young archive, relative to that of VLT and HST. So likely KOA is on a virtuous trajectory to boost the astronomical productivity of the Observatory.
I bring up the importance and cost (both real and opportunity) of DRPs. The case study is OSIRIS. for OSIRIS did not show the expected strong early rise. As noted in §4.8, the performance of OSIRIS at commissioning was lower due to grating not manufactured to specifications. Thus at the very start OSIRIS was at a disadvantage relative to its competitor (ESO’s SINFONI instrument which was commissioned in late 2004). The situation was further exacerbated by the difficulty of extracting signal from IFU data. Astronomers have come to appreciate that IFUs are inherently complex. Developing the extraction algorithms requires requires a deep understanding of the instrument. As a result, ordinary users need a quality DRP to reduce the IFU data. Unfortunately, a robust DRP was not a part of the OSIRIS commissioning. As a result, in practice, OSIRIS data was nearly un-reducible by the average user astronomer. A GUI-based DRP (with adequate documentation) that came several years later helped alleviate the situation. The OSIRIS pipeline is still a work in progress. Astonishingly, a similar sad story unfolded for an optical IFU that was built for the 60-inch telescope (Spectral Energy Distribution Machine; SEDM)353535https://nickkonidaris.com/sed-machine/. In contrast to OSIRIS, this is an ultra-low resolution seeing limited spectrograph. The common problem was the lack of a quality DRP at the time of commissioning followed by a lack of appreciation of the scale of high quality manpower effort that is needed to extract signal from IFUs (whilst suppressing systematics).
10. The Cost & Value of a Night of Telescope Time
Unlike radio astronomy (rather specifically, wavebands from decameter through decimeter) very few, if any, optical observatories have a truly “open sky” policy. In optical astronomy it has long been the tradition that access is primarily restricted to astronomers from institutions which funded the construction of the telescope.363636 Indeed, herein may lie the reason why the centroid of global OIR astronomy shifted to the West Coast of California. Access to the Lick Observatory, the Mt. Wilson & the Palomar Observatories, all of which laid the astronomical foundation for the University of California, Caltech and the Carnegie Observatories, was limited to the investing institutions. Once an observatory is successful it is not unusual to find astronomers elsewhere pushing their institutions to obtain access to such telescopes. Nor is it unusual for observatories to seek new partners (either as a buy-in or a limited time lease) to fund new initiatives or continue operations.
10.1. TSIP
Recognizing the above situation and also acknowledging inadequate public investment in optical astronomy (at least relative to private investment) in the United States, NSF commissioned a study. The resulting “McCray report” led to the establishment of the Telescope System Instrumentation Program (TISP).373737http://ast.noao.edu/system/tsip/ This program aimed to increase telescope access to the US community by funding existing private observatories. The funding was either for building new instruments or for compensating the operators a portion of their running costs. This initiative directly raises the question of “How should a night of telescope access be valued?”.
The TSIP framework was a landmark for US based OIR facilities. It established a market place which may sound strange to astronomers who tend to view their work as being outside the economic sphere. The TSIP framework was constructed as follows. The cost for a night of observations was derived from three contributions: the cost of the telescope linearly amortized over twenty years, the cost of instrumentation amortized over ten years and the current annual operating cost. For the first two items “then year” dollars were used whereas for the third item current year dollars are used. For a telescope older than twenty years the recommendation was to set the value of the telescope to the “current estimated cost to build a telescope of similar characteristics reduced by a factor equal to inflation over the last ten years” and then to linearly amortize this estimate over the next twenty years.
10.2. Re-examining TSIP Framework
The TSIP program was critical for WMKO. This program made it possible for the Observatory to build OSIRIS, MOSFIRE, KCWI and underwrote the considerable costs for the formulation of the “Next Generation Adaptive Optics” (NGAO) project. The same program funded instrumentation at other observatories as well.
Returning back to the business at hand, overall, the the TSIP framework is reasonable. It is nonetheless useful to review the three assumptions. To start with, the flux curve of NIRC provides some justification for the TSIP 10-year amortization rule. However, the flux curves of instruments which received upgrades would favor a longer period for amortization.
Next, the primary function of a telescope is to collect light and project it into a small image. This ability of the telescope need not decay with age. I quote an example that I know very well – the Hale 5-m telescope (commissioned in 1949). Thanks to refurbishments and a better ability to model the mechanical structure the primary mirror of the Hale telescope is in better shape today than it ever was. The pointing has been steadily improved and is now as good as a modern telescope. The mirror coating is also up to modern standards. In my opinion and experience the primary danger to the basic functioning of an older telescope is light pollution. It is possible to maintain aging facilities competitive, limited only by the imagination of astronomers (for innovative projects) and the ability of management to raise the necessary funding.
In defense of this assertion I give three examples of ground-based telescopes which continue to be of current value. I start by noting the several reincarnations of the Palomar 48-inch Oschin telescope (a Schmidt camera telescope; commissioned in 1951) – photographic all sky survey (POSS1, POSS2), robotic operation with CCD mosaic (3-banger, PalomarQuest), Palomar Transient Factory (PTF) and soon Zwicky Transient Factory (ZTF; FOV of 47 square degree, CCD mosaic with 576 Mpix, autofocus, improved pointing, rapid slewing etc).383838http://www.ptf.caltech.edu/ztf The Southern counterpart, the AAO 48-inch telescope (commissioned 1973), similarly underwent several reincarnations: ESO/SERC Southern Photographic Survey, the pioneering Fibre-Linked Array Image Reformatter (FLAIR)393939http://ftp.aao.gov.au/astro/flair.html which initiated the era of massively multiplexed spectroscopy, 6dF404040http://ftp.aao.gov.au/ukst/6df.html and RAVE.414141https://www.rave-survey.org/
Next, the Palomar 60-inch telescope (commissioned 1970), originally built for student training, was robotized and played a major role as a photometric (color) engine for the Palomar Transient Factory and is now being reinvented for robotic spectral classification of transients.
The Palomar 200-inch has an excellent suite of workhorses and novel instruments (e.g. such as the Cosmic Web Imager – the fore-runner of the Keck Cosmic Web Imager; a state-of-the-art coronagraph behind a 3,000-actuator AO system; an upgrade of the current H2 detector to an H2RG along with a polarimetric mode will result in a NIR imager very well suited to exoplanet eclipses and weather on brown dwarfs). Indeed, the vibrancy of the current partnership (Caltech, Jet Propulsion Laboratory, Yale University and National Astronomical Observatory of China) shows the telescope offers current value.
Perhaps the most dramatic case for the proposition laid at the start of the second paragraph of this section is the Hubble Space Telescope. HST, when launched in 1990, carried the Wide Field & Planetary Camera (WFPC; based on eight pixel array CCDs, eighties vintage), Goddard High Resolution Spectrometer (GHRS; two 521-pixel Digimon light intensified detectors), High Speed Photometer (HSP), Faint Object Camera (FOC; image intensifier technology) and Faint Object Spectrograph (FOS; 512-pixel Digimon light intensified detectors). Let us for a moment ignore the problem raising from the flawed mirror (and discovered shortly after first light). Specifically let us imagine a new world timeline in which HST was launched with a perfect mirror but without the possibility of instrument upgrades. In this world, HST would have produced stunning results for the first five and perhaps ten years. The march of technology, especially in improved QE (UV, optical, NIR), lower read noise (all bands) and larger format (all bands) and the development of Adaptive Optics would have diminished HST’s standing relative to ground based astronomy. The only band where HST would have had unique advantage would have been in the UV. Here, too, the gains in QE (from image intensifiers with QE of tens of percent (at best) to modern delta-doped CCDs with near unity QE) has been dramatic. HST is a leader in faint object wide-field astrometry (which will, for ever, remain a bastion of space based projects, cf. Gaia). It is the periodic updates of new instruments (which take advantage of technological growth) that kept HST at the forefront of astronomy.
I would therefore suggest the following modification to the TSIP framework: following an upgrade of an instrument the 20-year amortization rule should be applied to the market value of the upgraded instrument. A well maintained telescope should receive similar consideration.
10.3. Citations as basis for cost
There is an entirely different approach to determine the value of an observatory, namely the final output – the scientific results attributable to the observatory. In the spirit of this paper (“astro-econometrics”) I suggest that the citation flux, , should form the basis of currency for optical observatories. This market-based approach will favor observatories which build their telescopes at superior sites, maintain their telescopes to a high level of performance (so nights are not lost due to telescope failures), undertake periodic infra-structure improvements (so that the fraction of productive usage remains high), build up a suite of powerful instruments (optimized for dark and bright time, for excellent and moderate seeing) and undertake upgrades of instruments as detectors improve and so on and so forth.
The two fundamental quantities in a market are cost and value. The cost per citation, , is most simply computed as the ratio of the citations accumulated up to a point of time to that of the total money spent to that date (capital, operating expenses, instruments and other investments; all inflated to the end point).
In contrast to cost, there is no simple basis to estimate value. Fundamentally, value is intimately tied to the perception of the buyer (“eyes of the beholder”). One simple approach is to accept the TSIP rate for a night, as a given. In this case the value per citation is where is the annual flux of citations (Figure 11) and is the number of potentially usable nights (that is after accounting for nights set aside for engineering and commissioning). It would be useful to carry out similar evaluations for other recipients of TSIP grants. In a rational market (as in a micro-economic sense) the values of and will be consistent.
A high-level national study has noted that there will be a high demand for follow up facilities in the the Large Synoptic Survey Telescope (LSST) era (Elmegreen, 2015). If so, there will be demand for access to privately run facilities by those who lack access (see §11.3). Given this expectation, it would be most useful for NSF to commission a retrospective study of the influential TSIP program, particularly addressing the “business” side. Such a study would be extremely helpful to the Chairs of astronomy departments as they build up a strong case for access to telescopes for their departments. After all trustees are usually practical people and appreciate sound business arguments over any other type of argument.
The above formulation for is applicable for classical telescopes. In particular, a night allocated to one party means that the same night cannot be allocated to any other party. The above formulation is not applicable to projects such as SDSS, PS-1 and PTF for which the concept of a single night is not particularly meaningful. Alternatively, for projects such as SDSS should be the value computed above and divided by , the number of subscribers.
11. The Future Landscape
I had two objectives when I set out to undertake the investigations leading to this paper: (1) quantify the productivity of observatories by instruments and (2) explore a rational basis to determine the value of a night of telescope time. These two topics were addressed in §8–§10. In that sense the previous section marks the formal end of the paper.
Here, I take the opportunity to use the conclusions drawn in this paper to understand the future of large optical telescopes, both in terms of opportunities and challenges. However, optical telescopes (large or small) are only a part of the entire astronomical landscape. It is, therefore, important to understand the larger landscape before one can discuss the future of large optical telescopes. The two main developments (of relevance to large optical telescopes) are: the explosive growth of deep/wide imaging/photometric/astrometric surveys and the rise of of massively-multiplexed spectrographs. These are discussed below, respectively, in §11.1 and §11.2.
11.1. Imaging – Synoptic Surveys
Historically, all-sky (or large FOV) surveys have had a great impact. For instance, the plates or films (and later digitized versions) of Palomar Observatory Sky Survey (POSS) were a fixture in any respectable astronomy department; see Trimble & Ceja (2008) for more recent examples. As additional support of the value of all-sky surveys I draw the reader’s attention to Appendix D where I measure the rate of return for two wide-field surveys undertaken with the Very Large Array (VLA), an Observatory with which I have more than a passing familiarity. I find the return rate of the two surveys to be superior to those returned by PI-led projects.
In this context, the Sloan Digital Sky Survey (SDSS) deserves a special mention. Starting circa 2000, this project, based on a 2.5-m telescope, undertook the first large-area (Northern Galactic cap) digital survey in five optical bands. SDSS inspired other surveys (e.g. VLA/FIRST). SDSS is widely regarded as a great success story of modern optical astronomy (Madrid & Macchetto, 2009). In the North, the 1.8-m PanSTARSS (Kaiser et al., 2002) with its 1.4 Gigapixel (Gpix) mosaic has concluded a 5-band Northern sky survey (with a public release that is imminent) and the 1.35-m SkyMapper (Keller et al., 2007) with a 268 Megapix (Mpix) imager is midway on a similar mission for the Southern Sky.
Of all the bands, the optical band is the most mature in terms of sky surveys. The world is awash in large FOV optical imagers – thanks to the decreasing cost of sensors, data acquisition circuitry and computing (when evaluated on a per unit basis; Moore’s law). Here is an incomplete listing of large FOV imagers: CHFT/CFH12K (96 Mpix), CFHT/MegaCam (324.5 Mpix; Boulade et al. 2003), Subaru/Suprime-Cam (80 Mpix; Miyazaki et al. 2002), Blanco/Dark Energy Camera (520 Mpix; Flaugher et al. 2015) and Subaru/HSC (870 Mpix; Miyazaki et al. 2012).
The sophistication and maturity of optical synoptic imaging can be measured by the increasing number of specialized surveys. Catalina Sky Survey and PS-1 are entirely devoted to the study of Near-Earth Asteroids. We have ground- and space- missions dedicated for exoplanets (e.g. WASP, HARPS, Kepler, TESS). The on-going PTF and the imminent ZTF have a singular goal of studying optical transients. The CFH Supernova Legacy Survey (SNLS) was tuned for Ia cosmology. The Dark Energy Camera and the HyperSuprimeCam were motivated by a single goal: probing Dark Energy through several approaches.
Thanks to investments by NASA we now have full sky surveys in other bands (e.g. 2MASS/NIR, GALEX/UV, WISE/MIR). European Space Agency’s (ESA) Gaia mission, with its precision photometry, spectrophotometry and unparalleled astrometry of nearly objects, is poised to revolutionize stellar and Galactic astronomy. The Russian-German Spektr-RG mission (expected to launch in 2017) will present cadenced deep views of the entire sky in X-rays. The bonanza of large FOV surveys will continue into the near and distant future: TESS, CHEOPS and PLATO are wide field precision synoptic photometric surveys. Euclid and WFIRST will undertake space-based large FOV surveys in the optical and the NIR bands. Finally, the LSST is expected to start routine operations in 2022.
Entirely separately and truly exciting is that 2016 marks the opening of the field of Gravitational Wave (GW) astronomy (Abbott et al., 2016). The GW detectors, being essentially one-baseline interferometers, have very large FOV (the primary beam) but poor localization (owing to baselines of moderate length, relative to the wavelength). Identification of the electromagnetic counterpart of GW sources (involving neutron stars) will benefit from archival data, require large FOV imagers and rapid access to large optical telescopes for the much sought after spectroscopy of the GW events.
11.2. Advances in Spectroscopy
A traditional slit spectrograph does not make full use of the available focal plane. The primary return is a single object spectrum (since, nature rarely produces nebulae neatly lined up with the slit). Multi-slits or use of fibers allow for spectra of large numbers of objects to be obtained in one shot. The pioneering 2dF spectrograph on the 3.9-m Australian Astronomical Observatory (AAO; Colless et al. 2001) demonstrated how an existing telescope at a mediocre site can undertake leading science projects. The spectrograph could obtain low resolution spectra of 400 objects over a 2-degree field of view. The 2dF Galaxy Redshift Survey (2dFGRS) measured redshifts of 250,000 galaxies or stars over 2,000 square degrees with a median redshift of 0.1. The success of 2dFGRS has made it now almost mandatory that all large optical telescopes be equipped with multiplexed spectrographs (e.g. DEIMOS, MOSFIRE on Keck; IMACS on Magellan; VMOS and KMOS on VLT and so on). A recent development is “integral field unit” spectroscopy – obtaining spectra of a rectangular region (e.g. OSIRIS). We are on the verge of the IFU revolution – soon astronomers will routinely have access to multiple “deployable” IFUs on large telescopes.
The spectacular success of SDSS (Madrid & Macchetto, 2009) was in my opinion entirely due to the resonance between imaging and massively multiplexed spectroscopy (a pair of 320 fibers, upgraded to a pair of 500 fibers in 2009 feeding a pair of two-armed spectrographs). Indeed, without the strong support of highly multiplexed spectrographs the gains of the synoptic surveys will go largely unrealized. In this respect, I admire the vision and courage of the Subaru management for funding not just the HSC but also PFS. The HSC/PFS combination is not only potent but durably so.
11.3. NRC Study: Optimizing the System
The focus of this section – namely the landscape of OIR astronomy – has been discussed extensively and expansively by an National Research Council (NRC) panel chaired by D. M. Elmegreen of Vassar College. The panel goes further ahead and makes suggestions to optimize the US-based OIR system, particularly in the LSST era (Elmegreen, 2015). The panel made seven recommendations and here I bring up those relevant to this paper.
The panel recognizes the need for extensive follow up in the LSST era. It should not surprise the reader that the panel suggests development of a wide-field, highly multiplexed spectroscopic facility in the Southern hemisphere. Realistically, a full decade will be needed to realize such a facility (and that is five years after LSST has been in operation). Any such facility will be working in an landscape of a range of highly multiplexed spectrographs (and discussed in the next section). Clearly opportunities abound but strategic analysis of the landscape is essential.
Another recommendation of the panel is to strengthen the US OIR “system”. This recommendation follows directly from the value of follow up of targets resulting from LSST. Following up requires access to telescopes and as noted by the panel the US community has seen a decrease in the number of public telescopes. A simple way to meet the panel’s recommendation is for NSF to renew the “TSIP” program, in which case the discussion in §10 could be of some use. I find the panel’s recommendation of “bartering” as not practical. Privately run observatories need funds to run and improve their facilities. Separately, any great opportunity for bartering will, in most cases, be recognized and acted upon by the Directors of the observatories. Finally, the scale of funding for a telescope access program (“TAP”) that would make a difference to the astronomical community and at the same time have the ability to influence the existing marketplace is about $10M to $15M per year. This is a much larger sum than that discussed in the report.
12. Large Optical Telescopes: A Bright Future but also Challenges
As noted earlier (§11.1) the astronomical world is awash with sky surveys across the electromagnetic spectrum. There is no doubt that considerable astronomical progress will likely take place using the data obtained from each imaging (or photometric or astrometric) survey and by cross-survey comparisons. As an example, I note that the amazing progress in the field of astero-seismology is primarily rooted in the precision photometric data provided by the Kepler mission. In contrast, the great progress in exoplanet studies most certainly required extensive followup, namely, precision radial velocity (RV) studies of stars which were identified as candidates by the same Kepler mission. In the same spirit, time domain surveys such as ZTF (and eventually LSST) are good at identifying variable stars and transient sources but in many cases follow up is key to making progress beyond flux curves. Therefore, it stands to reason that ground-based optical/NIR telescopes will, at least for some areas of astronomy, become increasingly sought after for followup studies.
Next, there now exists a class of instruments which I call as “mega” instruments. Such instruments are expensive ($30M and up) and are usually built for a specific science goal (for which the instrument is tuned to have an impressive reach). A summary of the mega instruments can be found in §B. Briefly, these mega instruments come in three flavors: those with large spectroscopic target throughput (e.g. SDSS, Prime Focus Spectrograph on the Subaru telescope), those with large FOV imagers (Hyper Suprime Camera, Dark Energy Camera) and those associated with AO (e.g. SPHERE, GPI; both designed to address imaging of exoplanets). Mega instruments allow astronomers to undertake certain unique projects. The Subaru telescope is increasingly defined by its large FOV imagers (e.g. the SuprimeCam and the Hyper Suprime Camera or HSC). GPI appears to have made its mark in high contrast imaging of stars.

12.1. Challenge: Cost of Instrumentation
It appears to be the case that every successive generation of instruments, even in roughly the same category, are costing more than those from the previous generation. This assertion is justified by a simple glance at Table 1. For instance, the cost of MOSFIRE is five times that of NIRC. In contrast, as can be seen from Figure 43, the nominal GDP increased by a factor of 2.5 from 1990 to 2010 (during this period the real GDP grew by only 1.5).
The increase in cost is easily explained: it arises from astronomer’s desire to get more out their fixed investment (the telescope) and this desire is aided by rapid progress in technology. Thanks to Moore’s law astronomers can now populate increasingly larger fraction of the focal plane with sensors. Thanks to improvements in detectors, we can build useful wide-bandwidth instruments (e.g. X-shooter on VLT). Technological developments have made new modes possible as well as high quality measurements. Examples include integral field spectrographs and instruments with great stability (e.g. flexure compensated spectrographs; precision radial velocity spectrometers).
It is perhaps the case that large optical observatories have unwittingly entered into an arms race. This situation has an uncanny resemblance to the real arms race.444444Successive generations of fighter planes are vastly better than previous generation: greater accuracy, lower mass, more lethal power, smaller radar cross section, and smaller risks to the pilot. However, the cost of fighter planes has increased faster than the nominal GDP. I recommend the interested reader to carefully study a 2008 RAND report “Why has the cost of fixed-wing aircraft risen?” (RAND_MG696). I venture to say that in both cases, the race is motivated by national pride, the desire for global domination and is enabled by rapid changes in technology.
Thus, in the absence of planned upgrades, and bearing in mind that it takes about five years to design and develop even a typical instrument for large telescopes, one should start working on the concept for the next instrument a few years after the first generation instrument is commissioned. Should there be significant technical innovations, of relevance to the instrument, upgrades should be considered. Failing this, a schedule for a replacement instrument must be launched five years (the typical duration for construction of instruments for the present generation of large telescopes) before the anticipated obsolescence of the current instrument (typically a decade after commissioning).
Observatory management would benefit having a bibliographic database linked to instruments. Ideally, the latter would include not merely the name of the instrument (as has been and is currently the situation with the WMKO bibliographic database) but also details of the exposures undertaken during the run (integration times, instrument mode, slewing time, seeing conditions, integration time). Even if such a grand goal cannot achieved it is essential for management to undertake retrospective analysis (of the sort undertaken here) and use lessons learnt when making future choices. In this regard, I draw the reader’s attention, with some admiration, of ESO’s bibliometric portal454545http://telbib.eso.org/. The portal is sufficiently sophisticated that the analysis I undertook here can probably be done in less than a few weeks of time.
12.2. Solution: Upgrades & Common Development
Upgrades can be cost effective to maintain (if not increase) the productivity of instruments (cf. LRIS-B, LRIS-R, HIRES; see §8.4). Thus it would be useful to build into the initial instrument the possibility for upgrades, especially anticipating new and better detectors. Next, instrumentation projects encounter two types of cost challenges: the total cost and the maximum burn rate. A phased approach to instrumentation would help address the latter problem. Indeed, in effect, this has been the effective (if not planned) policy at WMKO (e.g. LRIS-R and then LRIS-B; KCWI-B and then KCWI-R).
Finally, it would be useful to examine if reuse of either hardware or software (especially) is possible. Reuse could consist of using parts of instruments that are no longer competitive. For instance, PTF uses the CHF12K detector (after extensive refurbishment; see Rahmer et al. 2008). A particularly innovative approach has been undertaken by a collaboration between CHFT and Gemini-North Observatory: “Gemini Remote Access to CFHT ESPaDOnS” (GRACES).464646http://www.gemini.edu/node/12131 This instrument combines the larger collecting area of Gemini with a unique instrument (high resolving power, high efficiency, polarimetric mode) at CHFT. GRACES is made possible by a 270-m length fiber which takes starlight from Gemini and feeds to the spectrometer located in CFHT.
A real life example which avoids re-development and makes extensive reuse is “Collaboration for Astronomy Signal Processing and Electronics” (CASPER)474747https://casper.berkeley.edu/. The stated mission is “to streamline and simplify the design flow of radio astronomy instrumentation by promoting design reuse through the development of platform-independent, open-source hardware and software”. CASPER is based on the idea of open source and community development of hardware, gateware, gpuware, software (algorithms and generic pipelines that can be easily adapted to various input data formats). The end goal is radio astronomy instrumentation for pulsar search and timing, Fast Radio Burst (FRB) searches, aperture synthesis, beam-forming, Search for Extraterrestrial Intelligence (SETI) and Very Long Baseline Interferometer (VLBI). CASPER instrumentation is deployed world-wide: Arecibo (Puerto Rico), Green Bank (West Virginia), Parkes (Australia), Effelsberg (Germany), Giant Meter Wavelength Radio Telescope (GMRT, India), Submillimeter Array (SMA; Hawaii), Long Wavelength Array & Large Aperture Experiment to Detect the Dark Ages (LEDA; both at Owens Valley Radio Observatory, California), LWA/LEDA, PAPER (Precision Array for Probing the Epoch of Reionization) & HERA (Hydrogen Epoch of Reionization Array), Very Long Baseline Array (NRAO), MeerKAT (South Africa), Medicina Observatory (Sardinia, Italy), Allen Telescope Array (Hat Creek Radio Observatory, California), Deep Space Network (DSN; JPL/NASA), ALMA (Atacama Large Millimeter Array, Chile), Five hundred meter Aperture Spherical Telescope (FAST, China), Shanghai Observatory (China) and Infrared Spatial Interferometer (Mt. Wilson, California).
I can personally attest to the impact of CASPER on radio astronomy. As a student I either developed or was involved in several hardware projects in radio astronomy: correlators, hardware for pulsar searching and timing, and long-baseline interferometry. For of each of these projects I spent a year just for the development phase. During this summer I intend to start a project for dipole-based wide-angle FRB searches at OVRO and Palomar. Thanks to CASPER I expect that the implementation phase for this project to be less than 3 months.
In OIR astronomy, over the past fifteen years, the AO community undertook two “roadmap” exercises were undertaken. Each exercise led to collaborative developments. This is not enough! OIR astronomy needs both a broader effort as well as a sustained effort, similar to CASPER. The success of CASPER would hopefully catalyze similar common development programs.
12.3. Mega Instruments: Swaps & Vertical Integration
As noted earlier, mega instruments, if chosen wisely and executed well, can undertake spectacular science. However, mega instruments eponymously are expensive. Say, for argument’s sake, that a proposed mega instrument costs $50M. We will accept 10 years as a reasonable peak lifetime. Say, over this period, 1,000 nights are allocated to the mega instrument. Ignoring inflation, the instrument depreciates at the rate of $50K per night of usage, exceeding the ops cost for a single night of a large optical telescope. Thus naturally it only makes sense to allocate all the time (subject only to lunations, if that is relevant) to the mega instrument in question. Swapping telescope time with other facilities could then solve the problem of access to users displaced by the arrival of the mega instrument.
A timely example is posed by the arrival of HSC on Subaru. Since HSC, until the commissioning of the LSST, is unique it is the case that astronomers outside the Subaru family would be salivating at the prospect of using HSC. Thus, it is desirable that in the era of mega-instruments significant time swaps between major observatories be undertaken.484848A joint NAOJ-WMKO meeting “Keck-Subaru Strategy: Sendai 2015” to explore and discuss this topic was held in September 2015 at Sendai, Japan. The ultimate solution may well be to have several observatories under one management (“vertical integration” in commercial parlance). In the coming era of mega instrument, ESO, which is already a vertically integrated observatory, may have an advantageous position relative to stand alone observatories.
13. A Future of the W. M. Keck Observatory
The great success of the Keck Observatory can be traced to two advantages: (1) an early start and (2) a suite of instruments consisting of powerful workhorses and wisely chosen niche instruments. Keck rode the rising performance gains of adaptive optics (especially the methodology of laser guide star adaptive optics).
Viewed in retrospect there were three clear weaknesses. First was the lack of timely upgrades of NIR instruments. After all, NIR detectors have been or continue to be on a virtuous trajectory (see Appendix A). Given this situation the lack of a timely upgrade of NIRSPEC was particularly unfortunate. Even more so when there were magnificent follow up opportunities of objects found in the 1-year cryogenic all-sky MIR survey of WISE mission (Wright et al., 2010). The delay of NIRES (a one-shot NIR echelle spectrometer; now scheduled for first light in late 2016) only made matters worse. I cannot help but wonder whether a timely upgrade of NIRSPEC would have made this instrument as powerful as the optical spectrographs.
Second was a lack of appreciation of the impact of quality DRPs on the productivity of astronomical research. Over time DRPs were developed (with HIRES and DEIMOS leading the way) but the lack of high quality and timely DRPs appears to have hurt WMKO’s productivity (cf. see discussion of OSIRIS towards the end of §9).
Going forward, in my view, the Keck Observatory should continue its current course, namely, serving a wide swathe of astronomers with interests that span from exoplanets to the early Universe. Using a currently fashionable word, Keck has been and should continue to be a holistic observatory. This approach leverages off other investments (e.g. in the Hubble era, Keck undertook critical spectroscopic observations of faint supernovae found by Hubble; see §8.1). Perhaps a future such “resonance” could be with the James Webb Space Telescope (which has an assured launch in 2018).
Earlier in §11.1 I noted that we are solidly in the era of synoptic surveys and squarely in the middle of time domain astronomy. The very large flux of candidates resulting from these surveys offer a great many opportunities for the world’s most sensitive OIR telescope. For instance, it is expected that a young ( day) supernova will be found by ZTF every night. This assured flux of targets opens up new types of projects. For instance LRISp494949Polarimetric module; see Goodrich, Cohen & Putney (1995). would be provide powerful diagnostics for asymmetries in the progenitor and explosions. WMKO observers can not only reap low-hanging fruits in transient object astronomy but get ready for highly nuanced and sophisticated usages when LSST turns on (first survey, 2022).
Next, I note the insatiable demand for multiplexed spectroscopy. A modern version of DEIMOS (using the entire field of view) would be unrivaled (given the large aperture of the telescope; slits, relative to fibers, allow for fainter targets). WFIRST, in particular, will need highly multiplexed spectroscopy at extremely faint levels. Next, Gaia is poised to revolutionize stellar and Galactic astronomy (or more fashionably, “near-field cosmology”). A moderate resolution single object spectrograph operating from 0.3 m to J-band (and employing EMCCDs and modern NIR detectors) is ideally suited to exploiting Gaia data. Either a rebuild of ESI or a new spectrograph would be a great addition to the Observatory.
As noted earlier the world is awash in large FOV imagers. Nonetheless, given the strong red bias of existing large FOV detectors, a Keck U-band imager based on highly efficient delta-doped CCDs (Jewell et al., 2015) would be unique and enable a wide range of astronomy (from SN shock breakout to UV bright galaxies).
WMKO should be extremely cautious of mega projects. As in ordinary life, big investments have two costs: the cost of the investment and the opportunity cost of the investment. In my view, after having analyzed the market place and understood the grave risks of opportunity cost, I do not find a compelling mega instrument for WMKO (although the cost of a new version of DEIMOS tailored to WFIRST may well cross the $30M mark).

Even with all these suggested improvements it is important to recognize that a continued growth in productivity will not be easy. Indeed, as can be seen from Figure 14 there is good evidence that the productivity of the Observatory has plateaued. (A flattening of the citation annual flux is also hinted at in Figure 11).
The growing Keck Observatory (§9) archive can be counted on to boost the productivity of the Observatory. Some help may come from the soon-to-be-commissioned deployable tertiary on Keck I (the K1DM3 project). This project allows for finer division of nights, “cadenced” observing and an increased number of TOOs – all of which, if properly leveraged, can contribute to increased productivity. New instruments – Near-Infrared Echellete Spectrograph (NIRES; summer 2016), Keck Cosmic Web Imager (KCWI; Fall 2016), Keck Planet Finder (2019) and the on-going and planned upgrades (OSIRIS, NIRSPEC) – have powerful capabilities. These instruments combined with the enormous collecting area of telescope along with the superb site means that astronomers who are fortunate to have access to the Observatory cannot but continue to make great discoveries. The astronomical future of the W. M. Keck Observatory is bright, limited only by financing, the ability of astronomers to innovate in observing styles, and the competence of management.
References
- (1)
- Abbott et al. (2016) Abbott, B. P., Abbott, R., Abbott, T. D., Abernathy, M. R., Acernese, F., and et al. 2016, Physical Review Letters, 116(13), 131103.
- Abt (2005) Abt, H. A. 2005, in Communicating Astronomy, ed. T. J. Mahoney, 2.
- Abt (2012) Abt, H. A. 2012, AJ, 144, 91.
- Backović (2016) Backović, M. 2016, ArXiv e-prints.
- Baril et al. (2012) Baril, M., Benedict, T., Thanjavur, K., Salmon, D., Vogiatzis, K., Racine, R., and Breidenthal, R. 2012, in Modeling, Systems Engineering, and Project Management for Astronomy V, volume 8449 of Proc. SPIE, 844903.
- Bauman et al. (2014) Bauman, S. E. et al. 2014, in Observatory Operations: Strategies, Processes, and Systems V, volume 9149 of Proc. SPIE, 91491K.
- Berriman et al. (2015) Berriman, G. B. et al. 2015, in Astronomical Data Analysis Software an Systems XXIV (ADASS XXIV), ed. A. R. Taylor and E. Rosolowsky, volume 495 of Astronomical Society of the Pacific Conference Series, 535.
- Booth et al. (2004) Booth, J. A. et al. 2004, in Ground-based Telescopes, ed. J. M. Oschmann, Jr., volume 5489 of Society of Photo-Optical Instrumentation Engineers (SPIE) Conference Series, 288.
- Booth et al. (2003) Booth, J. A. et al. 2003, in Large Ground-based Telescopes, ed. J. M. Oschmann and L. M. Stepp, volume 4837 of Society of Photo-Optical Instrumentation Engineers (SPIE) Conference Series, 919.
- Boulade et al. (2003) Boulade, O. et al. 2003, in Instrument Design and Performance for Optical/Infrared Ground-based Telescopes, ed. M. Iye and A. F. M. Moorwood, volume 4841 of Society of Photo-Optical Instrumentation Engineers (SPIE) Conference Series, 72.
- Butler et al. (2006) Butler, R. P. et al. 2006, ApJ, 646, 505.
- Campbell & Jones (2004) Campbell, R. D. and Jones, B. 2004, Advances in Space Research, 34, 499.
- Chanan, Ohara & Troy (2000) Chanan, G., Ohara, C., and Troy, M. 2000, Appl. Opt., 39, 4706.
- Chanan et al. (1998) Chanan, G., Troy, M., Dekens, F., Michaels, S., Nelson, J., Mast, T., and Kirkman, D. 1998, Appl. Opt., 37, 140.
- Chin et al. (2012) Chin, J. C. Y. et al. 2012, in Society of Photo-Optical Instrumentation Engineers (SPIE) Conference Series, volume 8447 of Society of Photo-Optical Instrumentation Engineers (SPIE) Conference Series.
- Colavita et al. (1999) Colavita, M. M. et al. 1999, ApJ, 510, 505.
- Colavita et al. (2013) Colavita, M. M. et al. 2013, PASP, 125, 1226.
- Colless et al. (2001) Colless, M. et al. 2001, MNRAS, 328, 1039.
- Crabtree (2008) Crabtree, D. R. 2008, in Society of Photo-Optical Instrumentation Engineers (SPIE) Conference Series, volume 7016 of Society of Photo-Optical Instrumentation Engineers (SPIE) Conference Series.
- Dressler et al. (2011) Dressler, A. et al. 2011, PASP, 123, 288.
- Elmegreen (2015) Elmegreen, D. M. 2015, in Optimizing the U.S. Optical and Infrared System, Board on Physics and Astronomy; National Research Council.
- Faber et al. (2003) Faber, S. M. et al. 2003, in Society of Photo-Optical Instrumentation Engineers (SPIE) Conference Series, ed. M. Iye and A. F. M. Moorwood, volume 4841 of Society of Photo-Optical Instrumentation Engineers (SPIE) Conference Series, 1657.
- Flaugher et al. (2015) Flaugher, B. et al. 2015, AJ, 150, 150.
- Fowler et al. (1994) Fowler, A. M., Gatley, I., Vrba, F. J., Ables, H. D., Hoffman, A., and Woolaway, J. 1994, Experimental Astronomy, 3, 243.
- Friedenauer et al. (2012) Friedenauer, A., Karpov, V., Wei, D., Hager, M., Ernstberger, B., Clements, W. R. L., and Kaenders, W. G. 2012, in Society of Photo-Optical Instrumentation Engineers (SPIE) Conference Series, volume 8447 of Society of Photo-Optical Instrumentation Engineers (SPIE) Conference Series.
- Goodrich, Cohen & Putney (1995) Goodrich, R. W., Cohen, M. H., and Putney, A. 1995, PASP, 107, 179.
- Hall et al. (2000) Hall, D. N., Hodapp, K.-W., Goldsmith, D. L., Cabelli, C. A., Haas, A. K., Kozlowski, L. J., and Vural, K. 2000, in Optical and IR Telescope Instrumentation and Detectors, ed. M. Iye and A. F. Moorwood, volume 4008 of Proc. SPIE, 1268.
- Hirsch (2005) Hirsch, J. E. 2005, Proceedings of the National Academy of Science, 102, 16569.
- Hodapp et al. (1996) Hodapp, K.-W. et al. 1996, New Astronomy, 1, 177.
- Jewell et al. (2015) Jewell, A. D. et al. 2015, in UV, X-Ray, and Gamma-Ray Space Instrumentation for Astronomy XIX, volume 9601 of Proc. SPIE, 96010N.
- Johansson et al. (2008) Johansson, E. M. et al. 2008, in Society of Photo-Optical Instrumentation Engineers (SPIE) Conference Series, volume 7015 of Society of Photo-Optical Instrumentation Engineers (SPIE) Conference Series.
- Kaiser et al. (2002) Kaiser, N. et al. 2002, in Survey and Other Telescope Technologies and Discoveries, ed. J. A. Tyson and S. Wolff, volume 4836 of Proc. SPIE, 154.
- Keller et al. (2007) Keller, S. C. et al. 2007, Publications of the Astronomical Society of Australia, 24, 1.
- Kim (2011) Kim, S. C. 2011, Publication of the Astronomical Society of Australia, 28, 249.
- Kulkarni (2012) Kulkarni, S. R. 2012, ArXiv e-prints.
- Larkin et al. (2006) Larkin, J. et al. 2006a, in Society of Photo-Optical Instrumentation Engineers (SPIE) Conference Series, volume 6269 of Society of Photo-Optical Instrumentation Engineers (SPIE) Conference Series.
- Larkin et al. (2006) Larkin, J. et al. 2006b, New Astronomy, 50, 362.
- Madrid & Macchetto (2009) Madrid, J. P. and Macchetto, D. 2009, in Bulletin of the American Astronomical Society, volume 41 of BAAS, 913.
- Matthews et al. (1996) Matthews, K., Ghez, A. M., Weinberger, A. J., and Neugebauer, G. 1996, PASP, 108, 615.
- Matthews & Soifer (1994) Matthews, K. and Soifer, B. T. 1994a, in Astronomy with Arrays, The Next Generation, ed. I. S. McLean, volume 190 of Astrophysics and Space Science Library, 239.
- Matthews & Soifer (1994) Matthews, K. and Soifer, B. T. 1994b, Experimental Astronomy, 3, 77.
- McCarthy et al. (1998) McCarthy, J. K. et al. 1998, in Society of Photo-Optical Instrumentation Engineers (SPIE) Conference Series, ed. S. D’Odorico, volume 3355 of Society of Photo-Optical Instrumentation Engineers (SPIE) Conference Series, 81.
- McLean et al. (1998) McLean, I. S. et al. 1998, in Society of Photo-Optical Instrumentation Engineers (SPIE) Conference Series, ed. A. M. Fowler, volume 3354 of Society of Photo-Optical Instrumentation Engineers (SPIE) Conference Series, 566.
- McLean et al. (2012) McLean, I. S. et al. 2012, in Society of Photo-Optical Instrumentation Engineers (SPIE) Conference Series, volume 8446 of Society of Photo-Optical Instrumentation Engineers (SPIE) Conference Series.
- Mieda et al. (2014) Mieda, E. et al. 2014, PASP, 126, 250.
- Miyazaki et al. (2012) Miyazaki, S. et al. 2012, in Ground-based and Airborne Instrumentation for Astronomy IV, volume 8446 of Proc. SPIE, 84460Z.
- Miyazaki et al. (2002) Miyazaki, S. et al. 2002, PASJ, 54, 833.
- Oke et al. (1995) Oke, J. B. et al. 1995, PASP, 107, 375.
- Oke & Gunn (1982) Oke, J. B. and Gunn, J. E. 1982, PASP, 94, 586.
- Pepe & Kurtz (2012) Pepe, A. and Kurtz, M. J. 2012, PLoS ONE, 7, 46428.
- Pettini et al. (2008) Pettini, M., Zych, B. J., Steidel, C. C., and Chaffee, F. H. 2008, MNRAS, 385, 2011.
- Phillips et al. (2008) Phillips, A. C., Miller, J., Cowley, D., and Wallace, V. 2008, in Society of Photo-Optical Instrumentation Engineers (SPIE) Conference Series, volume 7014 of Society of Photo-Optical Instrumentation Engineers (SPIE) Conference Series.
- Racine et al. (1991) Racine, R., Salmon, D., Cowley, D., and Sovka, J. 1991, PASP, 103, 1020.
- Rahmer et al. (2008) Rahmer, G., Smith, R., Velur, V., Hale, D., Law, N., Bui, K., Petrie, H., and Dekany, R. 2008, in Ground-based and Airborne Instrumentation for Astronomy II, volume 7014 of Proc. SPIE, 70144Y.
- Rockosi et al. (2010) Rockosi, C. et al. 2010, in Society of Photo-Optical Instrumentation Engineers (SPIE) Conference Series, volume 7735 of Society of Photo-Optical Instrumentation Engineers (SPIE) Conference Series.
- Sawruk et al. (2010) Sawruk, N. et al. 2010, in Society of Photo-Optical Instrumentation Engineers (SPIE) Conference Series, volume 7736 of Society of Photo-Optical Instrumentation Engineers (SPIE) Conference Series.
- Schöck et al. (2009) Schöck, M. et al. 2009, PASP, 121, 384.
- Sheinis et al. (2002) Sheinis, A. I., Bolte, M., Epps, H. W., Kibrick, R. I., Miller, J. S., Radovan, M. V., Bigelow, B. C., and Sutin, B. M. 2002, PASP, 114, 851.
- Sheinis et al. (2000) Sheinis, A. I., Miller, J. S., Bolte, M., and Sutin, B. M. 2000, in Society of Photo-Optical Instrumentation Engineers (SPIE) Conference Series, ed. M. Iye and A. F. Moorwood, volume 4008 of Society of Photo-Optical Instrumentation Engineers (SPIE) Conference Series, 522.
- Steidel et al. (2004) Steidel, C. C., Shapley, A. E., Pettini, M., Adelberger, K. L., Erb, D. K., Reddy, N. A., and Hunt, M. P. 2004, ApJ, 604, 534.
- Stepp, Daggert & Gillett (2003) Stepp, L. M., Daggert, L. G., and Gillett, P. E. 2003, in Society of Photo-Optical Instrumentation Engineers (SPIE) Conference Series, ed. J. R. P. Angel and R. Gilmozzi, volume 4840 of Society of Photo-Optical Instrumentation Engineers (SPIE) Conference Series, 309.
- Trimble & Ceja (2008) Trimble, V. and Ceja, J. A. 2008, Astronomische Nachrichten, 329, 632.
- Trimble & Zaich (2006) Trimble, V. and Zaich, P. 2006, PASP, 118, 933.
- Trimble, Zaich & Bosler (2005) Trimble, V., Zaich, P., and Bosler, T. 2005, PASP, 117, 111.
- Tuthill et al. (2000) Tuthill, P. G., Monnier, J. D., Danchi, W. C., Wishnow, E. H., and Haniff, C. A. 2000, PASP, 112, 555.
- van Dam et al. (2006) van Dam, M. A. et al. 2006, PASP, 118, 310.
- Vogt et al. (1994) Vogt, S. S. et al. 1994, in Society of Photo-Optical Instrumentation Engineers (SPIE) Conference Series, ed. D. L. Crawford and E. R. Craine, volume 2198 of Society of Photo-Optical Instrumentation Engineers (SPIE) Conference Series, 362.
- Wizinowich et al. (2000) Wizinowich, P. et al. 2000, PASP, 112, 315.
- Wizinowich et al. (2014) Wizinowich, P. et al. 2014, in Adaptive Optics Systems IV, volume 9148 of Proc. SPIE, 91482B.
- Wizinowich et al. (2006) Wizinowich, P. L. et al. 2006, PASP, 118, 297.
- Wizinowich et al. (2003) Wizinowich, P. L., Le Mignant, D., Stomski, Jr., P. J., Acton, D. S., Contos, A. R., and Neyman, C. R. 2003, in Society of Photo-Optical Instrumentation Engineers (SPIE) Conference Series, ed. P. L. Wizinowich and D. Bonaccini, volume 4839 of Society of Photo-Optical Instrumentation Engineers (SPIE) Conference Series, 9.
- Wizinowich et al. (1994) Wizinowich, P. L., Mast, T. S., Nelson, J. E., Divittorio, M., and Chanan, G. A. 1994a, in Society of Photo-Optical Instrumentation Engineers (SPIE) Conference Series, ed. L. M. Stepp, volume 2199 of Society of Photo-Optical Instrumentation Engineers (SPIE) Conference Series, 94.
- Wizinowich et al. (1994) Wizinowich, P. L., Nelson, J. E., Mast, T. S., and Gleckler, A. D. 1994b, in Society of Photo-Optical Instrumentation Engineers (SPIE) Conference Series, ed. M. A. Ealey and F. Merkle, volume 2201 of Society of Photo-Optical Instrumentation Engineers (SPIE) Conference Series, 22.
- Woillez et al. (2014) Woillez, J. et al. 2014, ApJ, 783, 104.
- Wright et al. (2010) Wright, E. L. et al. 2010, AJ, 140, 1868.
Appendix A A Brief History of IR detectors
The industry notation is as follows: Short Wavelength Infrared (SWIR) covering the range 1–2.5 m; Near Infrared (NIR) covering the range 1–5 m; and Mid Infrared (MIR) covering the range 5–25 m. The eighties saw an explosion of IR detector technologies. The eighties also marked the time for technology transfer from the military to astronomers.
In optical astronomy, Silicon serves both as the “sensor” (exciting electrons to the conduction band) as well as the “reader” (converting the electron count to digital values). However, the band-gap of Silicon is 1.05 m. Clearly, Silicon is not suitable for NIR detectors. NIR detectors need two distinct materials: a sensing layer (with band-gaps appropriate for NIR photons) and a Silicon layer for reading. A mechanism has to be identified to connect these two layers (“hybridizing”).
Three families of detectors cover the full range of IR astronomy. InSb detectors are used for SWIR and NIR bands. HgCdTe works from 0.8 to a long wavelength cutoff that can be engineered to as low as H-band and to as high as 10 m. Si:As IBC cover the range 6 m to nearly 30 m and are the detectors of choice for the MIR band. As noted above, in all cases, the readout is done by Silicon based circuitry. Here, we review the development of NIR detectors during the period 1990–2015.
In the early nineties the NIR detectors of choice were “Astronomical Large Area Detector Development on InSb” (ALADDIN) InSb detectors manufactured by Hughes Santa Barbara Research Corporation (SBRC). See Fowler et al. 1994 for the history of this line of detectors since introduction of the first detector in 1986. It was only natural that NIRC (commissioned in 1993) was based on a pixel ALADDIN array detector. Fowler et al. (ibid) talk of the development of pixel array detector (and indeed was deployed in NIRSPEC).
The HAWAII-1 (HgCdTe Astronomical Wide Area Infrared Imager) was developed by a partnership between U. Hawaii (D. Hall and K. Hodapp) and Rockwell (now Teledyne). The Rockwell HAWAII (1K1K pixel array) and the HAWAII-2 (2K2K pixel) arrays were based on the m cutoff LPE HgCdTe on Sapphire substrate technology. The HAWAII-1 was first used in the UH Quick Infra-Red Camera (QUIRC) in July, 1994 to observe the Comet Shoemaker-Levy impact with Jupiter (Hodapp et al., 1996).
The PICNIC detector used the sensing layer of InSb but a readout circuit based on the HAWAII array technology. Thus PICNIC detectors (unlike NICMOS) can only reset a line of pixels but not a single pixel. However, PICNIC gained the lower read noise advantage of HAWAII and the ability to turn off the circuitry during an exposure to reduce amplifier glow. Rockwell also developed the pixel array for Near Infrared Camera and Multi-Object Spectrometer (NICMOS). NICMOS was commissioned on HST in 1997. NICMOS uses HgCdTe sensing layer bonded to sapphire substrate and the read out was based on HAWAII technology.
The ability to butt became possible with a Hawaii-2 (2 K2 K pixel) which was first produced in 1998. These detectors saw saw limited use, notably in the UKIRT mosaic camera. Towards the end of the nineties Rockwell declassified the read and guide mode technology which made possible rapid guiding (RG) mode (Hall et al., 2000). HAWAII-2RG became available in 2001. The Sidecar ASIC control chip was introduced in 2003. H1R (reference pixels) flew on Deep-Impact (launched in 2005). H1RG (reference pixels plus guide sub-array) was employed by the Orbiting Carbon Observatory (OCO; launched in early 2009) and the Wide Infrared Survey Explorer mission (WISE; launched in late 2009). Currently, U. Hawaii is being funded by NSF to develop HAWAII-4RG detectors for use by large ground based telescopes. As we go to press, the first H4RG will be field tested at a telescope (D. Hall, pers. comm.).
In summary, apart from the fantastic increase in pixel count (256 256 pixel) from the NIRC InSb ALADDIN array to the H4RG-15, there have been major improvements in dark current (achieved at significantly higher operating temperature), in lower read noise, in higher QE, in reduction of persistent image effects and in reduction in radiation effects through removal of the CZT substrate.
Appendix B Mega Instruments
SDSS marks perhaps the first instance wherein the capital cost of the instrument was comparable to the cost of the telescope itself (and dominated the project cost if software expenses were included). Also relative to the size of the telescope the annual operation cost was very high. I use the following criteria to classify an instrument as a mega instrument: a capital cost approaching that of the telescope or a cost, say, of $30M or more.
Mega instruments come in two flavors: those with large reach and those which are designed to answer specific but important questions. Related to the first category are facilities built around highly multiplexed spectrographs: the Sloan Digital Sky Survey (SDSS) and the Large Area Multi-Object Fibre Spectrograph (LAMOST)505050http://www.lamost.org/public/?locale=en. The backend for LAMOST is an impressive 4000-channel dual beam spectrograph and this is fed by a wide FOV 4-m Schmidt camera (which also happens to be the large Schmidt telescope in the world).
HERMES has 390-fibers feeding four spectrographic arms on the 3.9-m AAT telescope515151http://www.aao.gov.au/HERMES/. HETDEX consists of 150 (!) IFU spectrographs mounted at the prime focus of the HET525252http://hetdex.org/hetdex/. WEAVE is a 1000-channel spectrograph on the 4.2-m William Herschel telescope535353http://www.ing.iac.es/weave/about.html. The planned MS-DESI is a 5000-channel spectrograph on the 4-m Mayall telescope545454http://desi.lbl.gov/. The planned Prime Focus Spectrograph (PFS/SuMIRE)555555http://sumire.ipmu.jp/en/2652 on the Subaru 8.2-m telescope has 2400 fibers feeding a 3-arm spectrograph. Then we have large FOV cameras: the Dark Energy Camera (3 square degrees) on the Blanco 4-m telescope and the Hyper-Suprime Camera565656http://www.naoj.org/Projects/HSC/ (HSC; FOV of 1.7 square degrees) on the Subaru 8.2-m telescope. These are major undertakings with costs575757including the cost of modifying the primary support system, the camera optics, the data taking system and pipelines that place them squarely in the mega-instrument category.
In the second category, the instruments appeared to be rooted in Adaptive Optics. The Gemini Planet Imager (GPI)585858http://planetimager.org/ on the Gemini South 8-m telescope is a high-contrast AO imager for high dynamic range (extra-solar planets) studies. SPHERE595959https://www.eso.org/sci/facilities/develop/instruments/sphere.html is also a “planet finder” but on the VLT 8-m telescope. The run-out cost of GPI and Sphere are estimated to be $26M and $50M, respectively. The Gemini Multi-Conjugate Adaptive Optics System (GeMS)606060http://www.gemini.edu/sciops/instruments/gems/ aims to deliver a very well corrected beam over one arc-minute field-of-view.
Appendix C Top Papers
C.1. NIRC
-
1.
The Rest-Frame Optical Spectra of Lyman Break Galaxies: Star Formation, Extinction, Abundances, and Kinematics (2001), ApJ 554, 981
-
2.
Submillimetre-wavelength detection of dusty star-forming galaxies at high redshift (1998), Nature 394, 248
-
3.
A Survey of 5.7 Quasars in the Sloan Digital Sky Survey. II. Discovery of Three Additional Quasars at (2003), AJ 125, 1649
-
4.
Stellar Orbits around the Galactic Center Black Hole (2005), ApJ 620, 744
-
5.
The Rest-Frame Optical Properties of Galaxies (2001), ApJ 562, 95
-
6.
High Proper-Motion Stars in the Vicinity of Sagittarius A*: Evidence for a Supermassive Black Hole at the Center of Our Galaxy (1998), ApJ 509, 678
-
7.
The unusual afterglow of the -ray burst of 26 March 1998 as evidence for a supernova connection (1999), Nature 401, 453
-
8.
Multiwavelength Observations of Dusty Star Formation at Low and High Redshift (2000), ApJ 544, 218
-
9.
The Stellar, Gas, and Dynamical Masses of Star-forming Galaxies at (2006), ApJ 646, 107
C.2. LRIS
-
1.
Observational Evidence from Supernovae for an Accelerating Universe and a Cosmological Constant (1998), AJ 116, 1009
-
2.
Measurements of and from 42 High-Redshift Supernovae (1999), ApJ 517, 565
-
3.
Type Ia Supernova Discoveries at from the Hubble Space Telescope: Evidence for Past Deceleration and Constraints on Dark Energy Evolution (2004), ApJ 607, 665
-
4.
The Supernova Legacy Survey: measurement of and from the first year data set (2006), A&A 447, 31
-
5.
High-redshift galaxies in the Hubble Deep Field: colour selection and star formation history to (1996), MNRAS 283, 1388
-
6.
Discovery of a supernova explosion at half the age of the universe (1998), Nature 391, 51
-
7.
Cosmological Results from High-z Supernovae (2003), ApJ 594, 1
-
8.
Lyman-Break Galaxies at and the Evolution of the Ultraviolet Luminosity Density at High Redshift (1999), ApJ 519, 1
-
9.
The Keck Low-Resolution Imaging Spectrometer (1995), PASP 107, 375
C.3. HIRES
-
1.
The Planet-Metallicity Correlation (2005), ApJ 622, 1102
-
2.
Spectroscopic Properties of Cool Stars (SPOCS). I. 1040 F, G, and K Dwarfs from Keck, Lick, and AAT Planet Search Programs (2005), ApJS 159, 141
-
3.
Attaining Doppler Precision of 3 m s-1 (1996), PASP 108, 500
-
4.
A Transiting “51 Peg-like” Planet (2000), ApJ 529, L41
-
5.
Catalog of Nearby Exoplanets (2006), ApJ 646, 505
-
6.
Planetary Candidates Observed by Kepler. III. Analysis of the First 16 Months of Data (2013), ApJS 204, 24
-
7.
Star-Formation Histories, Abundances, and Kinematics of Dwarf Galaxies in the Local Group (2009), ARA&A 47, 371
-
8.
The Deuterium Abundance toward Q1937-1009 (1998), ApJ 499, 699
-
9.
Planet Occurrence within 0.25 AU of Solar-type Stars from Kepler (2012), ApJS 201, 15
C.4. ESI
-
1.
Spectra and Hubble Space Telescope Light Curves of Six Type Ia Supernovae at and the Union2 Compilation (2010), ApJ 716, 712
-
2.
Observational Constraints on the Nature of Dark Energy: First Cosmological Results from the ESSENCE Supernova Survey (2007), ApJ 666, 694
-
3.
Evidence for Reionization at : Detection of a Gunn-Peterson Trough in a Quasar (2001), AJ 122, 2850
-
4.
The Farthest Known Supernova: Support for an Accelerating Universe and a Glimpse of the Epoch of Deceleration (2001), ApJ 560, 49
-
5.
A Survey of Quasars in the Sloan Digital Sky Survey. I. Discovery of Three New Quasars and the Spatial Density of Luminous Quasars at (2001), AJ 122, 2833
-
6.
Constraining the Evolution of the Ionizing Background and the Epoch of Reionization with Quasars. II. A Sample of 19 Quasars (2006), AJ 132, 117
-
7.
A Survey of Quasars in the Sloan Digital Sky Survey. II. Discovery of Three Additional Quasars at (2003), AJ 125, 1649
-
8.
The Observed Offset Distribution of Gamma-Ray Bursts from Their Host Galaxies: A Robust Clue to the Nature of the Progenitors (2002), AJ 123, 1111
-
9.
Damped Ly Systems (2005), ARA&A 43, 861
C.5. NIRC2
-
1.
Direct Imaging of Multiple Planets Orbiting the Star HR 8799 (2008), Science 322, 1348
-
2.
Measuring Distance and Properties of the Milky Way’s Central Supermassive Black Hole with Stellar Orbits (2008), ApJ 689, 1044-1062
-
3.
Optical Images of an Exosolar Planet 25 Light-Years from Earth (2008), Sci 322, 1345
-
4.
Confirmation of the Remarkable Compactness of Massive Quiescent Galaxies at : Early-Type Galaxies Did not Form in a Simple Monolithic Collapse (2008), ApJ 677, L5
-
5.
The First Measurement of Spectral Lines in a Short-Period Star Bound to the Galaxy’s Central Black Hole: A Paradox of Youth (2003), ApJ 586, L127
-
6.
Images of a fourth planet orbiting HR 8799 (2010), Nature 468, 1080
-
7.
A Close Look at Star Formation around Active Galactic Nuclei (2007), ApJ 671, 1388
-
8.
The W. M. Keck Observatory Laser Guide Star Adaptive Optics System: Overview (2006), PASP 118, 297
-
9.
The Hawaii Infrared Parallax Program. I. Ultracool Binaries and the L/T Transition (2012), ApJS 201, 19
C.6. NIRSPEC
-
1.
Type Ia Supernova Discoveries at from the Hubble Space Telescope: Evidence for Past Deceleration and Constraints on Dark Energy Evolution (2004), ApJ 607, 665
-
2.
The Farthest Known Supernova: Support for an Accelerating Universe and a Glimpse of the Epoch of Deceleration (2001), ApJ 560, 49
-
3.
The Mass-Metallicity Relation at (2006), ApJ 644, 813
-
4.
A Survey of Quasars in the Sloan Digital Sky Survey. I. Discovery of Three New Quasars and the Spatial Density of Luminous Quasars at (2001), AJ 122, 2833
-
5.
The Structure and Kinematics of the Circum-galactic Medium from Far-ultraviolet Spectra of 2–3 Galaxies (2010), ApJ 717, 289
-
6.
The Stellar, Gas, and Dynamical Masses of Star-forming Galaxies at (2006), ApJ 646, 107
-
7.
Toward Spectral Classification of L and T Dwarfs: Infrared and Optical Spectroscopy and Analysis (2002), ApJ 564, 466
-
8.
Multiwavelength Constraints on the Cosmic Star Formation History from Spectroscopy: The Rest-Frame Ultraviolet, H, and Infrared Luminosity Functions at Redshifts (2008), ApJS 175, 48
-
9.
H Observations of a Large Sample of Galaxies at : Implications for Star Formation in High-Redshift Galaxies (2006), ApJ 647, 128
C.7. DEIMOS
-
1.
The Supernova Legacy Survey: measurement of and from the first year data set (2006), A&A 447, 31
-
2.
New Hubble Space Telescope Discoveries of Type Ia Supernovae at : Narrowing Constraints on the Early Behavior of Dark Energy (2007), ApJ 659, 98
-
3.
Star Formation in AEGIS Field Galaxies since : The Dominance of Gradually Declining Star Formation, and the Main Sequence of Star-forming Galaxies (2007), ApJ 660, L43
-
4.
Observational Constraints on the Nature of Dark Energy: First Cosmological Results from the ESSENCE Supernova Survey (2007), ApJ 666, 694
-
5.
Cosmos Photometric Redshifts with 30-Bands for 2-deg2 (2009), ApJ 690, 1236
-
6.
The Kinematics of the Ultra-faint Milky Way Satellites: Solving the Missing Satellite Problem (2007), ApJ 670, 313
-
7.
The Mass Assembly History of Field Galaxies: Detection of an Evolving Mass Limit for Star-Forming Galaxies (2006), ApJ 651, 120
-
8.
Galaxy Stellar Mass Assembly Between from the S-COSMOS Survey (2010), ApJ 709, 644
-
9.
Metallicities of Galaxies in the GOODS-North Field (2004), ApJ 617, 240
C.8. OSIRIS
-
1.
The Kiloparsec-scale Kinematics of High-redshift Star-forming Galaxies (2009), ApJ 697, 2057
-
2.
Two ten-billion-solar-mass black holes at the centres of giant elliptical galaxies (2011), Nature 480, 215
-
3.
Clouds and Chemistry in the Atmosphere of Extrasolar Planet HR8799b (2011), ApJ 733, 65
-
4.
The Lick AGN Monitoring Project: The - Relation for Reverberation-mapped Active Galaxies (2010), ApJ 716, 269
-
5.
Near-infrared Spectroscopy of the Extrasolar Planet HR 8799 b (2010), ApJ 723, 850
-
6.
Dynamics of Galactic Disks and Mergers at : Spatially Resolved Spectroscopy with Keck Laser Guide Star Adaptive Optics (2009), ApJ 699, 421
-
7.
Integral Field Spectroscopy of High-Redshift Star-forming Galaxies with Laser-guided Adaptive Optics: Evidence for Dispersion-dominated Kinematics (2007), ApJ 669, 929
-
8.
The formation and assembly of a typical star-forming galaxy at redshift (2008), Nature 455, 775
-
9.
High Angular Resolution Integral-Field Spectroscopy of the Galaxy’s Nuclear Cluster: A Missing Stellar Cusp? (2009), ApJ 703, 1323
Appendix D Very Large Array
The National Radio Astronomy Observatory (NRAO) librarian(s) maintain a data base616161https://find.nrao.edu/papers/ of papers published using NRAO facilities. I am informed that librarians pore through papers in journals and use a uniform criterion for including papers in the NRAO data base. The classification is quite detailed (key projects, archival research, papers arising from surveys etc). Librarian(s) maintain a data base of papers published on data obtained from NRAO facilities. Two major surveys were undertaken with the VLA: Northern VLA Sky Survey (NVSS; eponymously the entire Northern Sky) and FIRST (conforming to the SDSS footprint of about 10,000 square degree of the Northern Galactic cap).
Circa mid April 2014 I downloaded from the NRAO database (mentioned above) the output of the following collections (relevant to the VLA): “VLA” (5665 papers), “eVLA” (268), “FIRST” (266), “NVSS” (442) and “Archival VLA” (608). The total number of papers of these data sets is 7249626262I verified that there are no overlapping papers between the data sets.. I applied the machinery developed for this paper to the NRAO papers. The citation flux curve for the five data sets is given in Figure 15 while the citation flux curves of the NVSS and FIRST can be found in Figure 16.


To start with, the two papers describing the surveys are the most cited papers in the approximately 30-year history of the VLA: NVSS is explicitly cited by 2664 papers whereas FIRST is cited by 1300 papers. NVSS was granted 2700 hours (Condon et al. 1998). The number of papers which made use of NVSS is, as of mid April 2014, 8249. The total VLA citations at the same epoch stand at 228,949. The VLA was officially commissioned in 1982. Assuming an efficiency factor of 0.,7 I find the mean citation production for the VLA is 1.16 per hour whereas that for NVSS (even after excluding citations to the NVSS paper itself) is 3.06 per hour.