Instability of insulators near quantum phase transitions
Abstract
Thin films of Amorphous indium oxide undergo a magnetic field driven superconducting to insulator quantum phase transition. In the insulating phase, the current-voltage characteristics show large current discontinuities due to overheating of electrons. We show that the onset voltage for the discontinuities vanishes as we approach the quantum critical point. As a result the insulating phase becomes unstable with respect to any applied voltage making it, at least experimentally, immeasurable. We emphasize that unlike previous reports of the absence of linear response near quantum phase transitions, in our system, the departure from equilibrium is discontinuous. Because the conditions for these discontinuities are satisfied in most insulators at low temperatures, and due to the decay of all characteristic energy scales near quantum phase transitions, we believe that this instability is general and should occur in various systems while approaching their quantum critical point. Accounting for this instability is crucial for determining the critical behavior of systems near the transition.
The superconducting insulator transition (SIT) Goldman and Markovic (1998); Gantmakher and Dolgopolov (2010), observed in highly disordered superconductors, is a quantum phase transition (QPT) Sondhi et al. (1997) driven by varying the magnetic field () Hebard and Paalanen (1990); Yazdani and Kapitulnik (1995); Baturina et al. (2004), disorder Shahar and Ovadyahu (1992), film thickness Haviland et al. (1989) or charge density Parendo et al. (2005).
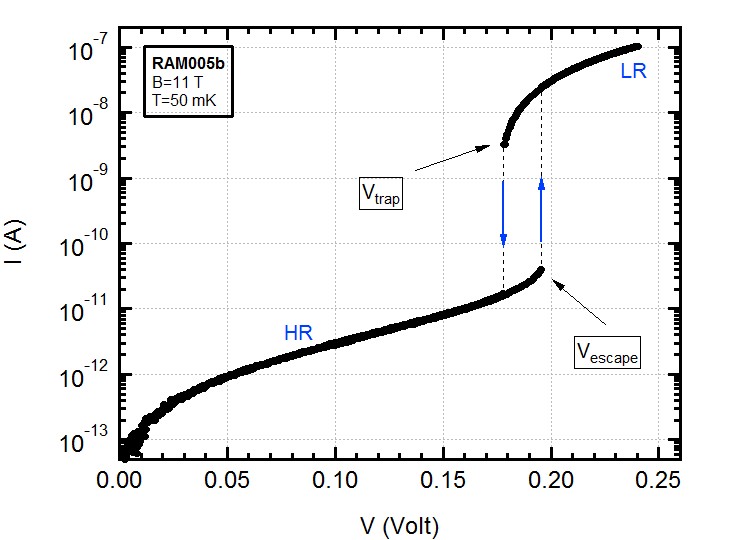
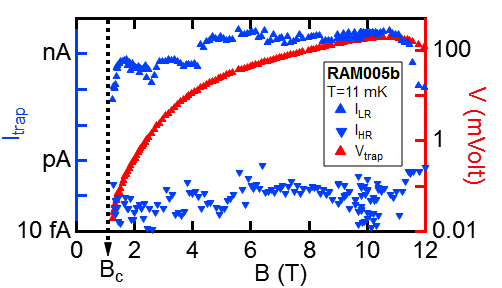
In the -driven SIT, beyond the critical (), Cooper-pairs persist and become spatially localized Feigel’man et al. (2010); Dubi et al. (2007); Gantmakher et al. (1996); Sambandamurthy et al. (2005); Nguyen et al. (2009); Sacépé et al. (2011); Sacépé et al. (2015), leading to a strongly insulating state Paalanen et al. (1992); Gantmakher et al. (1996); Sambandamurthy et al. (2004); Nguyen et al. (2009); Sacépé et al. (2008); Yazdani and Kapitulnik (1995). In this insulating state, at low ( mK), the current-voltage characteristics (’s) exhibit large -discontinuities () Sambandamurthy et al. (2005) (figure 1). The ’s can be separated into two regions, a high resistance (HR) state at low and a low resistance (LR) state at high . We denote the threshold where the HRLR (LRHR) occurs as ()
Recently Altshuler et al. showed that the ’s could be explained by a thermal bi-stability where the electrons can thermally decouple from the phonon bath resulting in a well defined electron () Altshuler et al. (2009). The central assumption of this model is that deviations from a linear result from an increase in . The steady state is determined by the heat-balance between the experimentally applied Joule-heating () and cooling via the phonons. This non-equilibrium state is analyzed by solving the heat-balance equation
| (1) |
where is the volume of the sample, is the electron-phonon coupling-strength, is an exponent that determines the power-law decay of the electron-phonon coupling as and , typical of insulators ( is the insulator’s activation energy and is typically ).
The central result of this model is that, below a critical phonon (), equation (1) has two stable solutions for . The ’s are a result of a change in that occurs when the electrons abruptly switch between the low solution, where the HR state exists, and the high solution. This electron-heating approach gained support from several experiments Ovadia et al. (2009); Kalok et al. (2010); Levinson et al. (2016).
At first sight, the far-from-equilibrium ’s and its underlying electron-phonon decoupling appear to be not relevant to the study of the equilibrium phases, and of the SIT itself. The main conclusion from the results presented in this Letter is that near the quantum critical point (QCP) of the SIT this is not the case. By systematically followed the – evolution of we show that vanishes as . Consequently, close enough to , the finite required for transport measurements will inevitably exceed , driving the system out of equilibrium with a discontinuous transition to the high state. The significance of the discontinuous departure from equilibrium is that, not only the equilibrium state cannot be measured but near the QCP, where like all other energy scales , it is not experimentally possible to extrapolate the equilibrium properties from the measurable .
Our data were obtained by measuring thin-films of amorphous indium-oxide. The films were deposited by e-gun evaporation of In2O3 onto a SiO2 substrate in an O2 rich environment. Both samples have a Hall-bar geometry, their lengths and widths are mm2 (sample RAM005b) and m2 (BT1c) and their thickness is nm (see section S2 Sup for a discussion about the contact). The data presented were measured in a two-probe dc configuration, which agrees with our 4-terminal measurements in their overlapping regime of applicability.
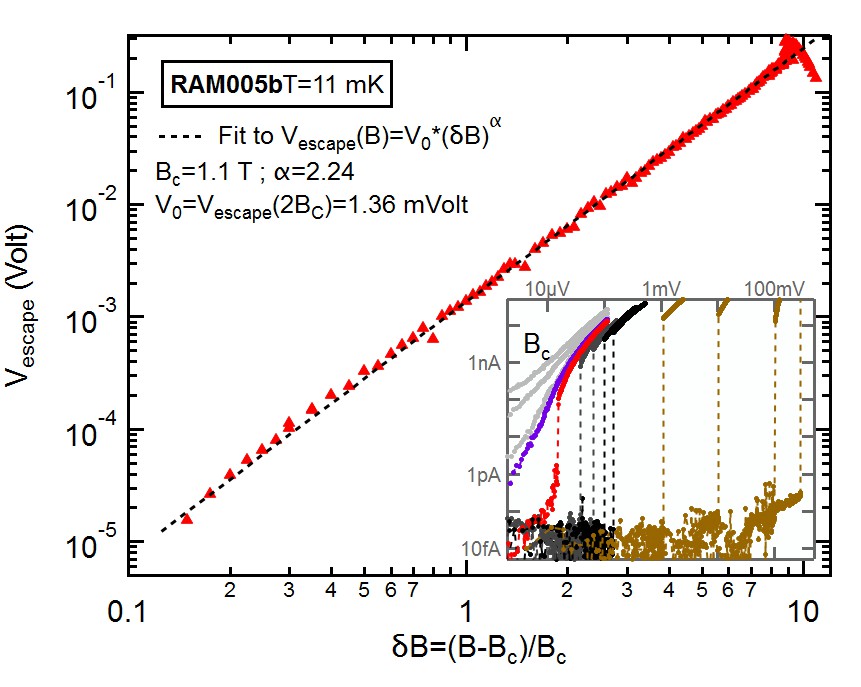
The main results of our work are summarized in figure 2, were we display vs. at our base mK. On this log-log plot follows a power-law that spans almost two decades in and four decades in , indicating that vanishes upon approaching ,
| (2) |
where is extracted using a power-law fit ( appears to be non-universal: it is sample and dependent).
Equation 2 reflects the inherent experimental difficulty one is faced when measuring equilibrium properties near . While conducting transport measurements, it is essential to apply a finite across the sample. This applied must exceed the noise present during the experiment (either instrumental or inherent such as Johnson-Nyquist noise) and must also be large enough to induce a measurable response from the sample (typically V). The vanishing of suggests a loosing cause: whatever small is, there will always be a range, close to the SIT, where it will exceed and drive the system out of equilibrium.
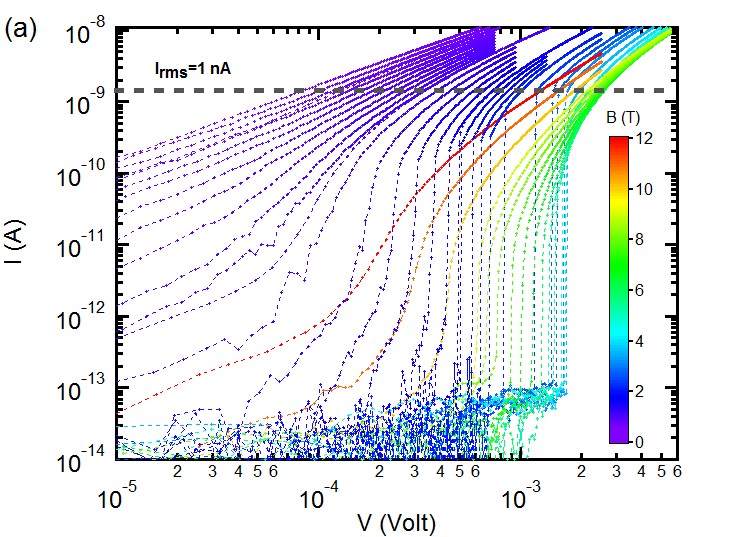
In the inset of figure 2 we display ’s from which the data of the main figure were extracted. Close to (black color) decreases down to T (red), which is the lowest where a discontinuity was observed (at =15V). According to the power-law fit of equation (2), TV, but, at T (purple) the data already appears continuous. A possible reason for this is that for this range, the measurement mK might become larger than . As we discuss in section S1 Sup this is unlikely. A more probable explanation is that the integrated voltage-noise surpasses , the ’s will appear continuous and measure only the LR state.
It is known that systems exhibit a non-linear response near QPT’s Sondhi et al. (1997); Green and Sondhi (2005); Hogan and Green (2008); Dalidovich and Phillips (2004) where, at , any finite will drive them out of equilibrium. The pivotal difference reported in this letter is that, not only our system has no linear response, but it departs from equilibrium in a discontinuous fashion. In the discussion section we present several consequences of this discontinuous response.
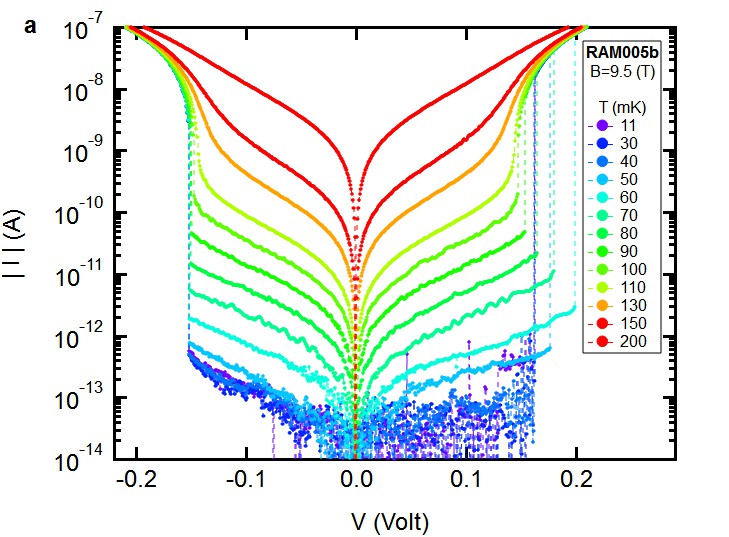
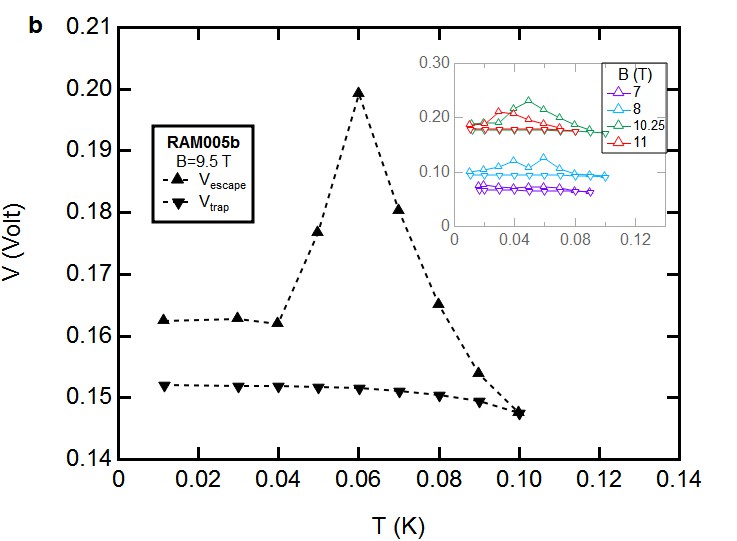
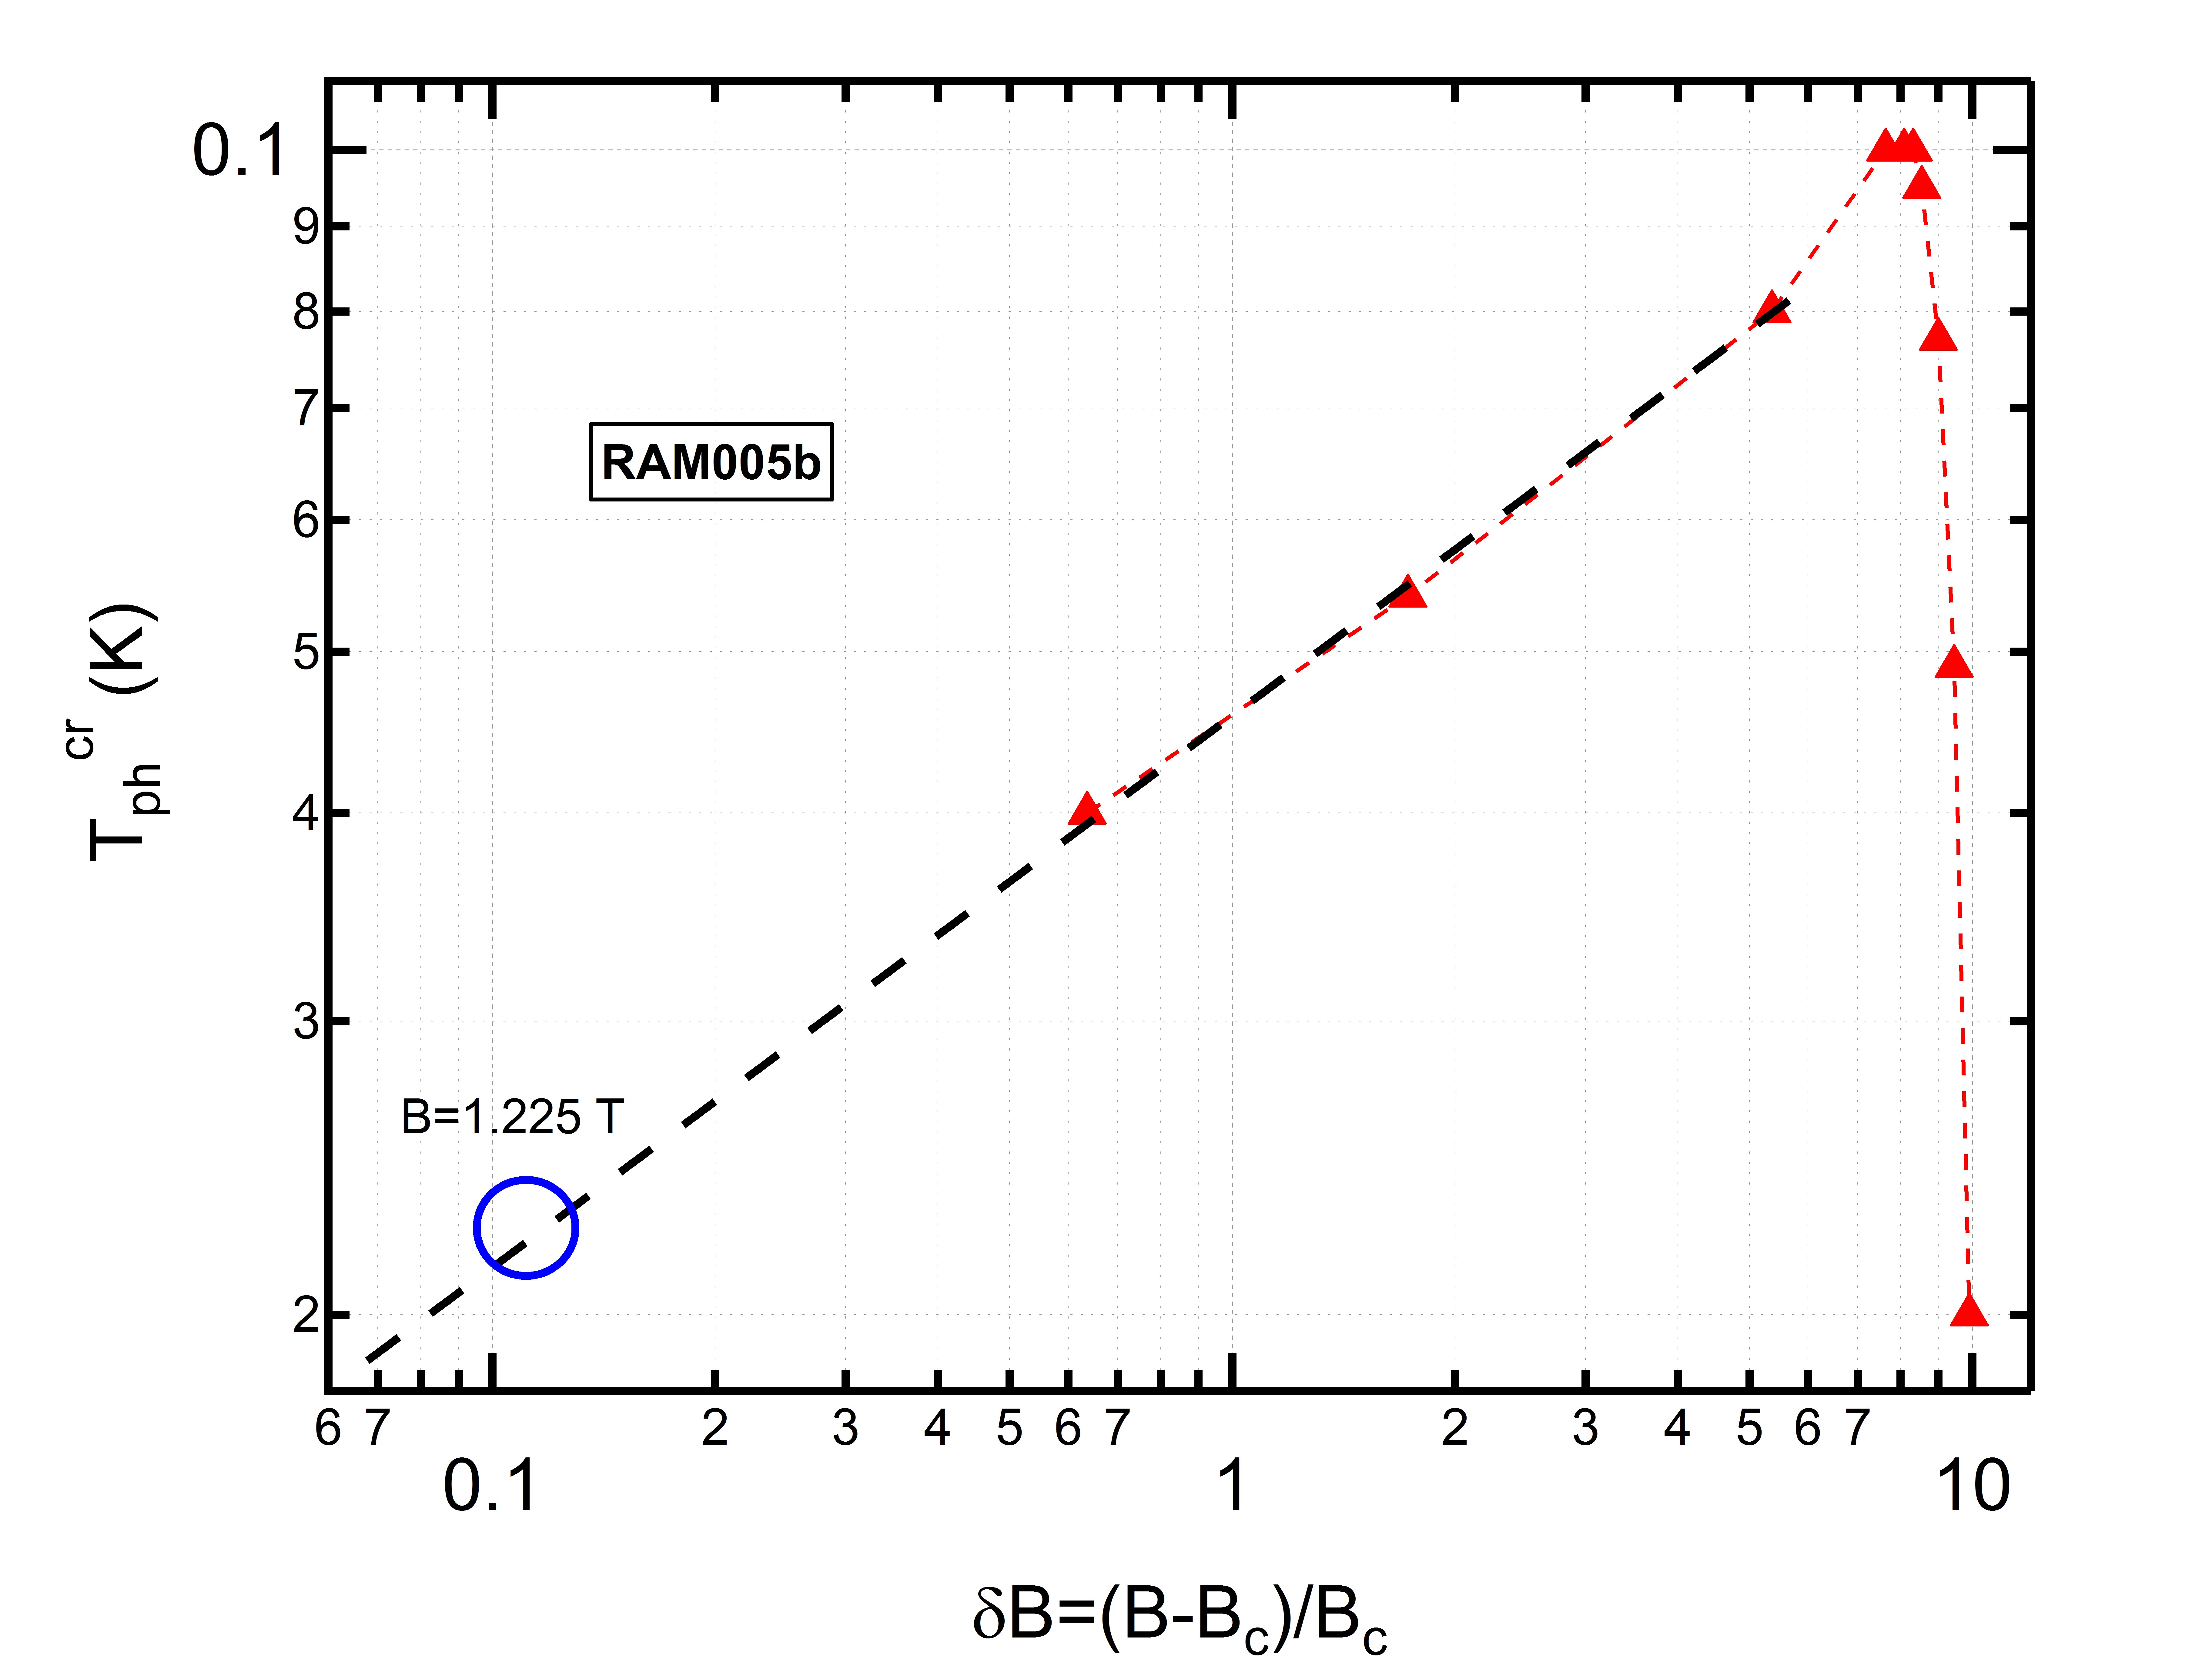
Because, strictly speaking, the QPT takes place at it is worthwhile to examine the evolution of . If increases sufficiently as , at low enough ’s, the HR state might span a large -interval and become measurable. In Figure 3a we display the ’s measured at T at different ’s. Below mK, the ’s become discontinuous. As predicted Altshuler et al. (2009), (the at ) is nearly independent of the phonon (). , on the other hand, initially increases as is reduced down to mK (green to light blue) as expected. As is further lowered (dark blue), the trend changes and begins to decrease. In figure 3b we display and (up and down pointing triangles respectively) vs . It appears that . In the inset of figure 3b we display and vs at various ’s. For all measured ’s, follows a similar pattern. These results suggest that lowering will not increase and make the HR state measurable. In the discussion we show that this dependence of can be explained by considering some inhomogeneity in the system.
An important question is how does the magnitude of the ’s evolve while approaching the QCP. If the ’s vanishes sufficiently fast, the transition from the LR to the HR states becomes practically continuous in the sense that one could extrapolate equilibrium, HR, properties from the LR state. The -dependence of the ’s at mK is displayed in figure 4 where we focus on the trapping side where the LRHR transition occurs. The blue triangles correspond to the left (blue) axis and represent on both sides of where upwards pointing triangles correspond to the last measured in the LR state before the jump () and downwards pointing triangles stand for , the first measured in the HR state (for most ’s was in the noise level). The red triangles mark and correspond to the right (red) axis. While vanishes rapidly over a vast range, the magnitude of the ’s does not seem to vary significantly. This observation has a great impact on the reliability of -bias transport measurements as we will argue in the discussion.
Discussion The data presented raise several points. We demonstrated above the instability of the insulating state near the SIT. It is interesting to consider the relevance of our findings to other systems exhibiting a QPT involving insulators such as the metal-insulator and the quantum Hall transitions. According to reference Altshuler et al. (2009), , guaranteeing its vanishing at the SIT. Because all relevant energy scales, including of the insulators, must vanish at all QCP, we expect similar inherent difficulties to arise in all QPT’s involving insulators. (provided that ). In sections S6 Sup we display preliminary results we obtained by measuring the ’s of a silicon MOSFET sample in the insulating phase near the metal-insulator transition. These results strongly support our claim as, similarly to the SIT data, they also show discontinuous ’s with vanishing while approaching the QPT.
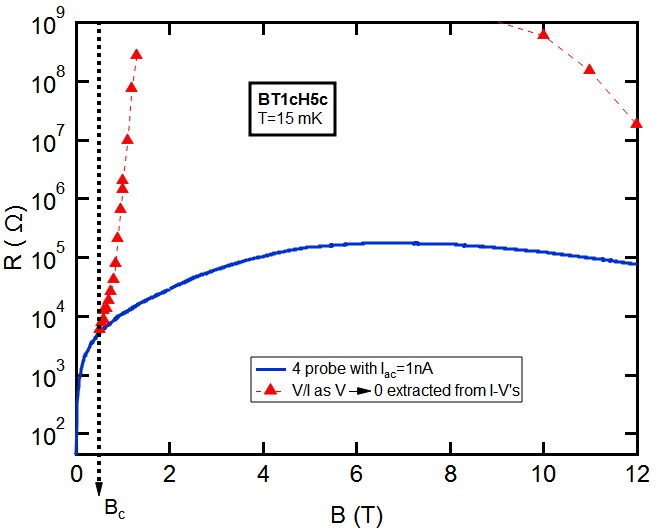
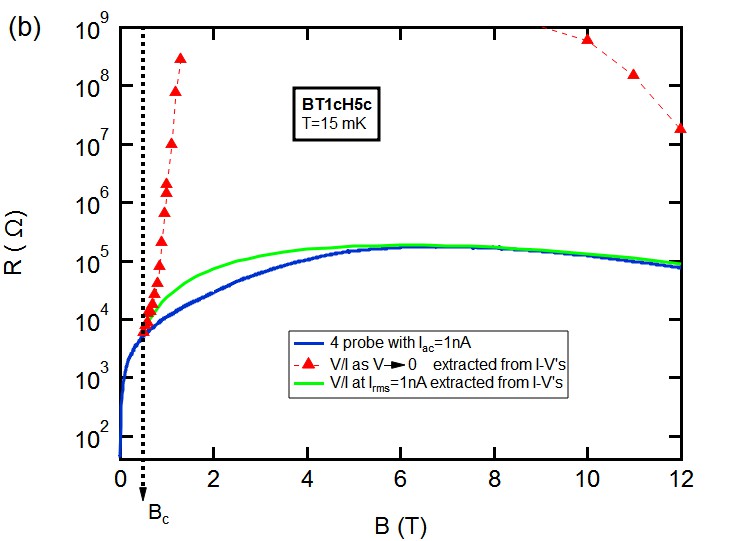
So far we have stated the difficulties in -biased measurements and showed that the close-to-equilibrium HR state can only be probed far from . It turns out that there are similarly severe implications regarding -biased, 4-terminal measurements. These are vividly illustrated in figure 5 where we plot data obtained from sample BT1c at mK. The red triangles are values extracted from the limit of two-probe DC ’s and represent our best estimation of the true Ohmic with the caveat that, close to , we probably probe the LR state. In contrast, the blue line is a result of a standard, low frequency (10 Hz), AC 4-probe measurement with nA Foo (a). A pronounced discrepancy reaching several orders of magnitude exists between the two types of measurement for . The roots of this discrepancy can be traced to figure 4. The 1 nA used in the 4-terminal measurement in figure 5 falls in the unstable regime of the ’s and far exceeds the maximum ’s allowed to observe the HR state. For sample BT1c nA is in the LR state for all (see figure S2a of Sup for the ’s).
The overwhelming discrepancy in ’s between the two types of measurement displayed in figure 5 emphasizes that, for insulators at low ’s, transport data without studying the ’s are unreliable. In sections S3 Sup we show that the 4-probe R can be extracted from the LR state, in S4 Sup we show that this discrepancy also occurs in larger samples, in S5 we discuss the 2 and 4 probe measurement configurations Sup .
A notable feature in Figure 3b is the non-monotonic -dependence of , which initially increases on lowering , reaches a maximum at mK, then decreases and eventually saturates at low . Altshuler et al. noted that the ’s occur within a bi-stability -interval (), , where and are the lower and upper bounds of and satisfying the parametric dependences:
| (3) |
Recalling that these equations imply that, as and , and . Our data show that, for mK, both and occur prematurely i.e. at the low limit of the . This can be understood by considering a mapping that we established between our non-equilibrium -discontinuities and first-order phase transitions in a Van der Waals liquid Doron et al. (2016), where the actual transition occurs not at the limit of stability but according to the Maxwell area-rule. Only in near-ideal samples where no nucleation centers are found, it is possible to observe a supercooled liquid close to the limit of stability Garside (1982). If is governed by a Maxwell-law equivalent, it is expected to increase upon cooling Foo (b). This is the case initially but, for mK (Figure 3b), an opposite trend develops.
These premature jumps can be explained by inhomogeneity in the samplesKravtsov (indications for non-structural inhomogeneity were reported in similar systems Sacépé et al. (2011); Kowal and Ovadyahu (2008, 1994); Ioffe and Gershenson (2012); Sacépé et al. (2008)). At low ’s, there is a competition between inefficient cooling via phonons and the small Joule-heating (due to the sample’s large ). While cooling is probably less sensitive to imperfections, heating may be affected near the impurities giving rise to ”hot spots” that act similarly to nucleation centers in the Van der Waals liquid.
We would like to note an earlier work Parendo et al. (2006) that remarks on the possibility that several observations near the SIT are due to electron heating, and shows that one cannot consider electric field and scaling independently. They did not consider discontinuous responses.
In summary, our findings questions the stability of an equilibrium, insulating, state bordering the SIT. Our main result is that , above which only the LR state persists, vanishes as we approach the QCP ( and ). This seemingly innocuous behavior has far-reaching consequences on transport: Because transport measurements require a finite in order to probe the sample, only the LR state can be accessed. In addition, any noise will already heat the electrons and drive the sample to the LR state. A central question that remains is whether, theoretically, there is a range where the HR state is stable.
Acknowledgements.
We are grateful to S. Kravchenko for providing a Si-MOSFET sample and to V. Kravtsov and I. Aleiner for fruitful discussions. This work was supported by the Israeli Science Foundation grant number 556/17.References
- Goldman and Markovic (1998) A. M. Goldman and N. Markovic, Phys. Today 51, 39 (1998).
- Gantmakher and Dolgopolov (2010) V. F. Gantmakher and V. T. Dolgopolov, Phys.-Usp. 53, 1 (2010).
- Sondhi et al. (1997) S. L. Sondhi, S. M. Girvin, J. P. Carini, and D. Shahar, Rev. Mod. Phys. 69, 315 (1997).
- Hebard and Paalanen (1990) A. F. Hebard and M. A. Paalanen, Phys. Rev. Lett. 65, 927 (1990).
- Yazdani and Kapitulnik (1995) A. Yazdani and A. Kapitulnik, Phys. Rev. Lett. 74, 3037 (1995).
- Baturina et al. (2004) T. I. Baturina, D. R. Islamov, J. Bentner, C. Strunk, M. R. Baklanov, and A. Satta, JETP Lett. 79, 337 (2004).
- Shahar and Ovadyahu (1992) D. Shahar and Z. Ovadyahu, Phys. Rev. B 46, 10917 (1992), URL http://link.aps.org/doi/10.1103/PhysRevB.46.10917.
- Haviland et al. (1989) D. B. Haviland, Y. Liu, and A. M. Goldman, Phys. Rev. Lett. 62, 2180 (1989).
- Parendo et al. (2005) K. A. Parendo, K. Tan, A. Bhattacharya, M. Eblen-Zayas, N. E. Staley, and A. M. Goldman, Phys. Rev. Lett. 94, 197004 (2005).
- Feigel’man et al. (2010) M. Feigel’man, L. Ioffe, V. Kravtsov, and E. Cuevas, Annals of Phys. 325, 1390 (2010).
- Dubi et al. (2007) Y. Dubi, Y. Meir, and Y. Avishai, Nature 449, 876 (2007).
- Gantmakher et al. (1996) V. F. Gantmakher, M. V. Golubkov, J. G. S. Lok, and A. K. Geim, JETP 82, 951 (1996).
- Sambandamurthy et al. (2005) G. Sambandamurthy, L. W. Engel, A. Johansson, E. Peled, and D. Shahar, Phys. Rev. Lett. 94, 017003 (2005).
- Nguyen et al. (2009) H. Q. Nguyen, S. M. Hollen, M. D. Stewart, J. Shainline, A. Yin, J. M. Xu, and J. M. Valles, Phys. Rev. Lett. 103, 157001 (2009).
- Sacépé et al. (2011) B. Sacépé, T. Dubouchet, C. Chapelier, M. Sanque, M. Ovadia, D. Shahar, M. Feigel’man, and L. Ioffe, Nat. Phys. 7, 239 (2011).
- Sacépé et al. (2015) B. Sacépé, J. Seidemann, M. Ovadia, I. Tamir, D. Shahar, C. Chapelier, C. Strunk, and B. Piot, Physical Review B 91, 220508 (2015).
- Paalanen et al. (1992) M. A. Paalanen, A. F. Hebard, and R. R. Ruel, Phys. Rev. Lett. 69, 1604 (1992).
- Sambandamurthy et al. (2004) G. Sambandamurthy, L. W. Engel, A. Johansson, and D. Shahar, Phys. Rev. Lett. 92, 107005 (2004).
- Sacépé et al. (2008) B. Sacépé, C. Chapelier, T. I. Baturina, V. M. Vinokur, M. R. Baklanov, and M. Sanquer, Phys. Rev. Lett. 101, 157006 (2008).
- Altshuler et al. (2009) B. L. Altshuler, V. E. Kravtsov, I. V. Lerner, and I. L. Aleiner, Phys. Rev. Lett. 102, 176803 (2009).
- Ovadia et al. (2009) M. Ovadia, B. Sacepe, and D. Shahar, Phys. Rev. Lett. 102, 176802 (2009).
- Kalok et al. (2010) D. Kalok, A. Bilusic, T. I. Baturina, V. M. Vinokur, and C. Strunk, arXiv (2010), eprint 1004.5153.v1.
- Levinson et al. (2016) T. Levinson, A. Doron, I. Tamir, G. C. Tewari, and D. Shahar, Physical Review B 94, 174204 (2016).
- (24) See supplemental material.
- Green and Sondhi (2005) A. G. Green and S. Sondhi, Physical review letters 95, 267001 (2005).
- Hogan and Green (2008) P. Hogan and A. Green, Physical Review B 78, 195104 (2008).
- Dalidovich and Phillips (2004) D. Dalidovich and P. Phillips, Physical review letters 93, 027004 (2004).
- Foo (a) For insulators one strives to minimize in order to avoid heating and non-linearities. For technical reasons is typically in the nA range.
- Doron et al. (2016) A. Doron, I. Tamir, S. Mitra, G. Zeltzer, M. Ovadia, and D. Shahar, Phys. Rev. Lett. 116, 057001 (2016), URL http://link.aps.org/doi/10.1103/PhysRevLett.116.057001.
- Garside (1982) J. Garside, in Biological mineralization and demineralization (Springer, 1982), pp. 23–35.
- Foo (b) In this analogy has a similar role, with an opposite -dependence, to the pressure where a first order transition occurs in a liquid Doron et al. (2016)).
- (32) V. Kravtsov, Private communication.
- Kowal and Ovadyahu (2008) D. Kowal and Z. Ovadyahu, Physica C: Superconductivity 468, 322 (2008).
- Kowal and Ovadyahu (1994) D. Kowal and Z. Ovadyahu, Solid state communications 90, 783 (1994).
- Ioffe and Gershenson (2012) L. B. Ioffe and M. E. Gershenson, Nature materials 11, 567 (2012).
- Parendo et al. (2006) K. A. Parendo, K. S. B. Tan, and A. Goldman, Physical Review B 74, 134517 (2006).
Supplemental material
for
Instability of insulators near quantum
phase transitions
S1 Near
In the inset of figure 2 of the main text we display ’s measured near , where below T the ’s seem continuous. A possible explanation that we raise is that, below this , the measurement mK might exceed the critical temperature above which there should be no discontinuity (). According to ref Altshuler et al. (2009), , where is the activation in the insulating phase. In addition, approaching the quantum critical point, all energy scales should go to zero, therefore as Sondhi et al. (1997). Therefore, if we assume that sufficiently close to , , where is a constant, we get that . In figure S1 we display vs (log-log) at various ’s. The dashed black line is a power-law fit for the lowest three data points ( and T respectively). Extrapolating it to T, we get that mK, higher than the measurement mK. Although this analysis is not rigorous, it does imply that a decrease in is not the cause of the continuous ’s below .
S2 Contacts
The contacts of sample RAM005b were prepared by pressed indium on a Au wire. While Indium is a type 1 superconductor the data presented in the manuscript was measured at ’s higher than of Indium (0.028 T, while the data is of T) therefore during these measurements, the contacts were in a normal state. The contacts of sample BT1c are Ti/Au pads (15nm Au over 10nm Ti), patterned via optical lithography and prepared prior to the deposition of the In2O3. In order to verify that contact resistance is negligible we compared 4-terminal and 2-terminal measurements at various ’s and in a range where both measurements are expected to yield similar results (M) and found that the discrepancies were negligible.
S3 Extracting the measured 4-probe results from the low resistive state of the ’
In figure 5 of the main text we display a large discrepancy between a 2-terminal measurement and a 4-terminal, -biased, measurement where we used a standard current of nA. Here we show that the low measured by 4-terminal is a results of heating where the injected current drives the sample to the low resistive (LR) state. Displayed in figure S2a are the ’s of sample BT1c, measured at mK at various ’s. The dashed black line marks nA. It can be seen that at ’s that exhibit a discontinuity this 1nA line crosses the LR state. In order to estimate the ”” of a biased measurement of nA from these dc ’s we used the simplest approximation of at . The result of this analysis is displayed as the green line in figure S2b, where the red and blue data are the same as in figure 5 of the main text. It can be seen that although this rough approximation does not exactly reproduce the 4-terminal result, it does predict similar ’s.
S4 Unavoidable ”transport catastrophe” in a larger sample
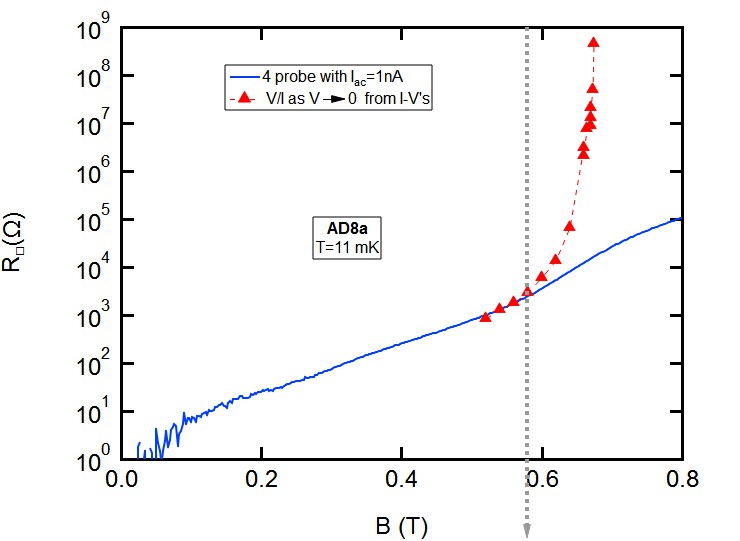
The cross section of sample BT1c (of figure 5 of the main text) is 100 times smaller than that of sample RAM005b (figures 1-4 of the main text), therefore passing the same in both samples results in a 100 times larger current density, J, in BT1c than in RAM005b. To show that the large discrepancy, displayed in figure 5 of the main text and figure S2b, is not due to the sample’s size we repeated these measurements on sample AD8a, which is of size 21 mm and 30 nm thick (therefore it’s cross section is twice as large as of sample RAM005b). In figure S3 we display the comparison between the 2-probe extracted from the linear part of the ’s (red triangles) and 4-probe using an excitation current of 1nA. The results are very similar to those displayed in figure 5 of the main text.
S5 2-terminal and 4-terminal measurement configurations
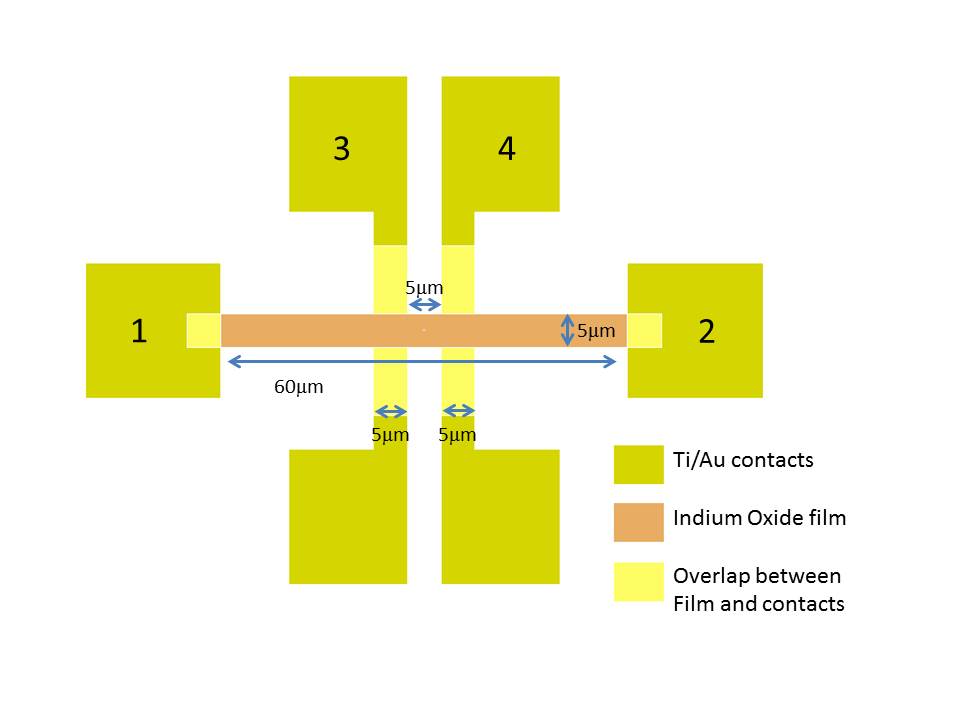
In figure S4 we display a sketch of sample BT1c. 4-terminal measurement were performed by passing an AC current between the far contacts (numbers 1 and 2 in the figure) while measuring the voltage drop across the center contacts (3 and 4). The 2 terminal measurements were performed by varying a DC bias between the far contacts (1 and 2) and measuring the resulting through the same contacts. The V/I data displayed in figure 5 of the main text and figure S2b were normalized by the number of squares. The reason we performed the 2 terminal measurements using the far contacts is to make sure that in both 4 and 2 terminal measurements the flows in the sample through the same path.
S6 ’s near the metal-insulator transition
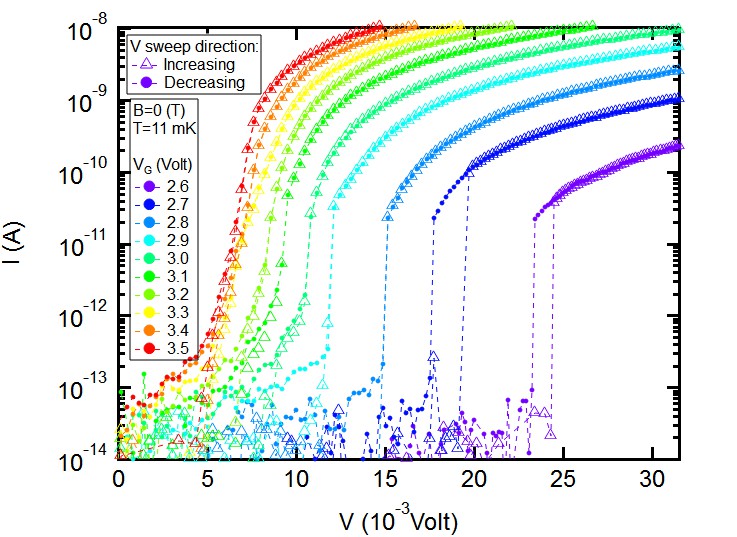
In the discussion section of the main-text we claim that the insulating instability is general and is also relevant to other insulators near quantum critical points. To verify this claim we measured a Silicon metal-oxide-semiconductor field-effect transistor (Si-MOSFET) in the insulating phase of the gate voltage () induced metal-insulator transition (MIT). In figure S5 we display the ’s of this Si-MOSFET at mK and where different colors mark different values of . The ’s are remarkably similar to those measured in the insulating phase near the SIT in the sense that there are large current discontinuities and that approaching the MIT these discontinuities appear at lower ’s. A full characterization of the discontinuities near the MIT will appear in a future publication.