Study of the process in the energy range GeV with the SND detector
Abstract
The process is studied in the energy range GeV using data with an integrated luminosity of 33 pb-1 accumulated by the SND detector at the collider VEPP-2000. The cross section is measured for the first time. The cross section has a threshold near 1.75 GeV. Its value is about 2 nb in the energy range GeV. The dominant intermediate state for the process is found to be .
pacs:
13.66.Bc 14.40.Be 13.40.Gp 12.40.VvI Introduction
This work continues the study of multiphoton processes in the center-of-mass (c.m.) energy domain GeV with the SND detector ompi ; etag ; etap ; eta . The main goal of these studies is the measurement of radiative decays of excited vector resonances of the , and families etag , as well as the search for rare processes of -even resonance production in the annihilation etap ; eta . While searching for the rare reactions mentioned above, hadronic processes containing -meson in the final state decaying into constitute a significant background (the branching fraction is pdg ). For example, the process ompi dominates in the five-photon final state and hinders the search for the radiative processes , .
The process studied in this work is important to search for the radiative processes and . A possible source of hadronic background in the final state is the process .
At energies below 2 GeV, the total cross section of annihilation into hadrons needed, for example, to calculate the running coupling constant of the electromagnetic interactions, is determined as a sum of exclusive hadronic cross sections. The process has not previously been measured and was not included in this sum. In this work we select this process for the first time and measure its cross section.
II Detector and experiment
The SND detector collects data at the collider VEPP-2000 VEPP2000 operating at c.m. energies GeV. This analysis uses data collected in 2010-2012. During the experiments, the energy range 1.05-2.00 GeV was scanned several times with a step of 20-25 MeV. Because of the smallness of statistics, we measure the cross section averaged over the energy intervals, listed in Table 1.
A detailed description of the SND detector is given in Refs. snd1 ; snd2 ; snd3 ; snd4 . The main part of this non-magnetic detector is a three-layer spherical electromagnetic calorimeter based on NaI(Tl) crystals. The solid angle coverage of the calorimeter is 95% of 4. Its energy resolution for photons is , and the angular resolution is about . Direction of charged particles are measured in a tracking system consisting of a nine-layer drift chamber and a proportional chamber with the signal readout from the cathode strips. The solid angle coverage of the tracking system is 94% of 4. From the outside the SND calorimeter is surrounded by a muon system. In this analysis, the muon system veto is used to suppress the cosmic-ray background.
Simulation of the signal and background processes is performed using Monte-Carlo generators that take into account initial-state radiative corrections calculated according to Ref. radcor . In particular, emission of an additional photon is simulated with the angular distribution according to Ref BM . Interactions of the particles produced in the annihilation with the detector material are modeled using the GEANT4 package GEANT4 . Simulation takes into account changes in the experimental conditions during the data taking, in particular, dead detector channels and variations of the beam-induced background. The beam background leads to the appearance of spurious photons and charged tracks in data events. To account for this effect in the simulation, special background events, recorded during the experiment with a random trigger, are used. Fired detector channels in these events are superimposed on the simulated events.
In this work, the process is studied in the channel . Since the final state for the process under study contains no charged particles, we use the process for normalization. As a result of the normalization a part of systematic uncertainties associated with the hardware event selection and spurious charged tracks from the beam background are canceled out. Accuracy of the luminosity measurement using the process is 2.2% ompi .
III Selection criteria
The selection of signal events is performed in two stages. Initially, events with exactly 7 photons with energy greater than 20 MeV, no charged particles, and for which the muon-system veto is not triggered, are selected. For these events, the following conditions on the total energy deposition in the calorimeter and on the total event momentum , calculated using energy depositions in calorimeter crystals, are imposed:
| (1) |
The transverse profile of the energy deposition in the calorimeter for reconstructed photons is required to be consistent with that expected for an electromagnetic shower xinm . The latter requirement provides separation of events with well isolated photons from those with merged photons or with clusters in the calorimeter produced by mesons.
The main background processes are the following: , , and with the decay . The process , having five photons in the final state, is a background source because of a relatively large cross section. Additional photons in events arise from splitting of electromagnetic showers, initial state radiation, and beam-induced background.
Further selection of events is based on kinematic fits, which use the measured photon angles and energies as input parameters. The fit is performed under the hypothesis that the seven-photon event proceed through the particular set of intermediate particles (with corresponding mass constraints), and satisfies energy-momentum conservation laws. As a result of the kinematic fit, photon energies are refined and the of the assumed kinematic hypothesis is calculated. First of all, the hypothesis is tested, and the condition is imposed. Then the photon pairs, candidates for the and mesons, are searched. It is required that the invariant mass of the candidate is in the range . Events with one meson candidate and two candidates are selected as possible signal events. To suppress the background from the processes , events containing three candidates are rejected. A kinematic fit is also performed to the hypothesis. All five-photon combinations with two -meson candidates are tested. Events with are rejected. For remaining events, a kinematic fit is performed to the hypothesis. The distributions for data and simulated events are shown in Figure 1.

Figure 2 shows the distributions of the two-photon invariant mass for and meson candidates for selected data and simulated events. It is evident from the distributions in Figs. 1 and 2 that most selected events arise from the process .


Figure 3 shows the distribution of the invariant mass () for 106 candidate events. The calculated background from the processes listed above is 9.2 events (3 events from , 3 events from , 2 events from , 1 event from ). To calculate the cross sections of these background processes, we use the results of Refs. BABAR6pi ; BABARomegapipi ; BABARKKpi ; etag and isotopic relations.
The histogram in Fig. 3 shows the simulated distribution for the sum of the signal and estimated background under the assumption that the signal is from the process . The simulated distribution is normalized to the number of selected data events. It is seen that at the existing statistical level these two contributions are sufficient to describe the distribution of selected candidate events.
For the final selection of events, the condition MeV is required for at least one combination in an event. This condition is satisfied by 62 events. Their distribution over the energy intervals is given in Table 1. The estimated number of background events is equal to 0.9. The systematic uncertainty of background calculation is taken to be 100%.
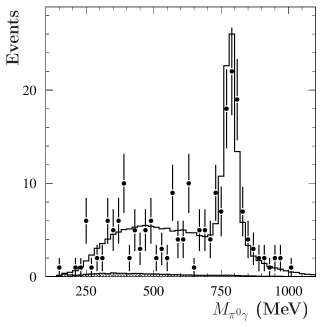
The spectrum of the invariant mass () for candidate events is shown in Fig. 4. The candidate with the maximal difference is used to calculate . For comparison, we also show the spectra for the simulated events of the process with the decay and of the process with uniform phase-space distribution of the final particles. It is evident that the data spectrum is consistent with the distribution for the model.

IV Detection efficiency
The detection efficiency for the events of the process is determined using MC simulation. The simulation takes into account the initial state radiative corrections radcor , in particular, the emission of additional photons.
The detection efficiency is determined as a function of two parameters: the c.m. energy and the energy of the additional photon emitted from the initial state. Figure 5 shows the dependence of the detection efficiency on for three representative c.m. energies.
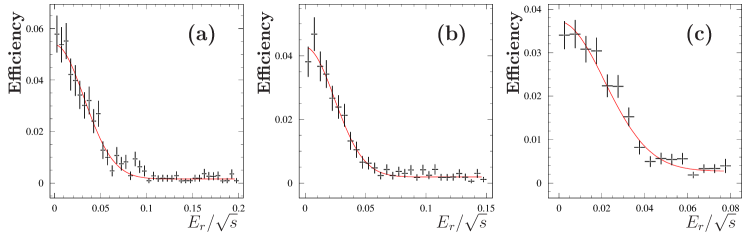
The values of the detection efficiency at averaged over the energy intervals are given in Table 1.
To estimate the systematic uncertainty of the detection efficiency determination, we use the results of Ref. etag where the difference in the detector responses between data and simulation for seven-photon events was studied. Based on this study, the systematic uncertainty on the detection efficiency is estimated to be 3%.
V Born cross section for the reaction
The visible cross section for the process is related to the Born cross section () by the following formula:
| (2) |
where is the so called radiator function describing the probability of radiating a certain energy fraction carried away by photons emitted from the initial state radcor , and is a product of branching fractions pdg . Equation (2) can be rewritten in the conventional form:
| (3) |
where the detection efficiency and the radiative correction are defined as follows:
| (4) |
| (5) |
Technically the experimental Born cross section is determined as follows. Using Eq. (2), the energy dependence of the measured visible cross section is fitted by a theoretical model that describes data reasonably well. Here , , and are respectively the number of selected data events, the number of background events, and the integrated luminosity for the -th energy interval. The fitted parameters of the theoretical model are used to calculate the radiative corrections. Then the experimental Born cross section is calculated using Eq.(3).
The energy dependence of the Born cross section for the process is parametrized according to the vector meson dominance model achasov assuming the intermediate state mechanism. The cross section is described by the contribution of only one resonance with the mass and width :
| (6) |
where is the cross section at and the function describes the energy dependence of the phase space volume of the final state. Far away from the threshold of the reaction , when we can neglect finite widths of the and resonances, coincides with the momentum.
Free fit parameters are , , and . The resulting curve is shown in Fig. 6 along with the values of the Born cross section calculated according to Eq.(3).
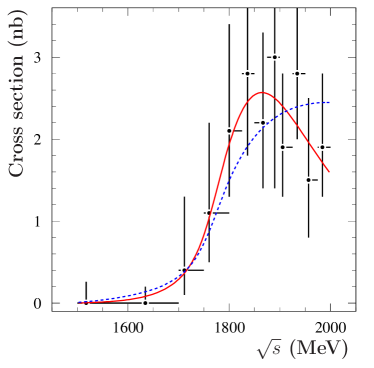
The obtained values of the mass and width of the resonance, MeV and MeV, are statistically consistent with the -resonance parameters pdg . We also perform a phase-space fit without a resonance contribution [ in Eq. (6)]. The fit shown in Fig. 6 by the dashed curve also describes data well. The significance of the resonance contribution estimated from the difference of the logarithmic likelihoods of the fits with and without resonance is about .
The numerical values of the Born cross section and radiative corrections are listed in Table 1. The total systematic uncertainty on the cross section is 4.2 %. It includes the systematic uncertainties on the detection efficiency(3%), luminosity measurement (2.2%), and radiative correction (2%). The latter is estimated by varying the fit parameters within their errors.
| (MeV) | (nb-1) | (%) | (nb) | |||
|---|---|---|---|---|---|---|
| 1500 1600 | 5888 | 0 | 0.02 | 2.85 | 0.779 | |
| 1600 1700 | 5004 | 0 | 0.21 | 4.03 | 0.815 | |
| 1700 1750 | 2261 | 1 | 0.13 | 4.25 | 0.813 | |
| 1750 1800 | 2392 | 3 | 0.09 | 4.29 | 0.810 | |
| 1800 1825 | 2373 | 6 | 0.09 | 4.61 | 0.823 | |
| 1825 1850 | 1897 | 7 | 0.05 | 5.02 | 0.841 | |
| 1850 1875 | 2527 | 8 | 0.06 | 5.34 | 0.855 | |
| 1875 1900 | 662 | 3 | 0.02 | 5.58 | 0.865 | |
| 1900 1925 | 3459 | 9 | 0.07 | 5.12 | 0.871 | |
| 1925 1950 | 2361 | 11 | 0.05 | 5.98 | 0.880 | |
| 1950 1975 | 2077 | 5 | 0.06 | 5.64 | 0.887 | |
| 1975 2000 | 2682 | 9 | 0.06 | 6.14 | 0.893 |
VI Conclusion
We have analyzed data collected in the experiment with the SND detector at the collider VEPP-2000 in the c.m. energy range from 1.05 to 2.00 GeV. In the seven-photon final state, events of the process have been separated. Most of these events come from the process . We have measured the cross section for this process for the first time. It has a threshold at 1.75 GeV. The cross section value in the energy range 1.8-2.0 GeV is about 2 nb, approximately 5% of the total hadronic cross section in this energy range. From the analysis of the invariant mass spectrum, it has been found that the dominant mechanism of the reaction is the intermediate state.
VII ACKNOWLEDGMENTS
Part of this work related to the photon reconstruction algorithm in the electromagnetic calorimeter for multiphoton events is supported by the Russian Science Foundation (project No. 14-50-00080).
References
- (1) M. N. Achasov et al. (SND Collaboration), Phys. Rev. D 88, 054013 (2013)
- (2) M. N. Achasov et al. (SND Collaboration), Phys. Rev. D 90, 032002 (2014).
- (3) M. N. Achasov et al. (SND Collaboration), Phys. Rev. D 91, 092010 (2015)
- (4) M. N. Achasov et al. (SND Collaboration), JETP Lett. 102, 266 (2015).
- (5) K. A. Olive et al. (Particle Data Group), Chin. Phys. C, 38, 090001 (2014).
- (6) A. Romanov et al., in Proceedings of Particle Accelerator Conference PAC 2013, Pasadena, CA USA, 2013, p.14.
- (7) M. N. Achasov et al., Nucl. Instrum. Methods Phys. Res., Sect. A 598, 31 (2009).
- (8) V. M. Aulchenko et al., Nucl. Instrum. Methods Phys. Res., Sect. A 598, 102 (2009).
- (9) A. Y. Barnyakov et al., JINST 9, C09023 (2014);A. Y. Barnyakov et al., Instrum. Exp. Tech. 58, 30 (2015).
- (10) V. M. Aulchenko et al., Nucl. Instrum. Methods Phys. Res., Sect. A 598, 340 (2009).
- (11) E. A. Kuraev and V. S. Fadin, Yad. Fiz. 41, 733 (1985) [Sov. J. Nucl. Phys. 41, 466 (1985)].
- (12) G. Bonneau and F. Martin, Nucl. Phys. B27, 381 (1971).
- (13) S. Agostinelli et al., Nucl. Instrum. Methods Phys. Res., Sect. A 506, 250 (2003).
- (14) A. V. Bozhenok, V. N. Ivanchenko, Z. K. Silagadze, Nucl. Instrum. Methods Phys. Res., Sect. A 379, 507 (1996).
- (15) B. Aubert et al. (BABAR Collaboration), Phys. Rev. D 73, 052003 (2006).
- (16) B. Aubert et al. (BABAR Collaboration), Phys. Rev. D 76, 092005 (2007); 77, 119902(E) (2008).
- (17) B. Aubert et al. (BABAB Collaboration), Phys. Rev. D 77, 092002 (2008).
- (18) N. N. Achasov and A. A. Kozhevnikov, Phys. Rev. D 55, 2663 (1997).