The hot Doradus and Maia stars
Abstract
The hot Doradus stars have multiple low frequencies characteristic of Dor or SPB variables, but are located between the red edge of the SPB and the blue edge of the Dor instability strips where all low-frequency modes are stable in current models of these stars. Though Sct stars also have low frequencies, there is no sign of high frequencies in hot Dor stars. We obtained spectra to refine the locations of some of these stars in the H-R diagram and conclude that these are, indeed, anomalous pulsating stars. The Maia variables have multiple high frequencies characteristic of Cep and Sct stars, but lie between the red edge of the Cep and the blue edge of the Sct instability strips. We compile a list of all Maia candidates and obtain spectra of two of these stars. Again, it seems likely that these are anomalous pulsating stars which are currently not understood.
keywords:
stars: oscillations – stars: variables: general1 Introduction
The Doradus variables are early F or late A stars which lie on or just above the main sequence and which vary in light with multiple frequencies in the range 0.3–5.0 d-1. The prototype of the class was discovered to be variable by Cousins & Warren (1963) and subsequently recognized as a new class of pulsating star by Balona et al. (1994). There are over 60 known Dor stars discovered by ground-based observations (Handler, 1999; Henry & Fekel, 2005; Henry et al., 2005; De Cat et al., 2006). Many hundreds more Dor stars have been discovered with the Kepler satellite (Balona et al., 2011a; Bradley et al., 2015).
The closely related Scuti variables are A–F stars which pulsate with multiple frequencies as high as 100 d-1, but also include the low frequencies found in Dor stars. Ground based observations are not sufficiently precise to detect these low frequencies, which is why Sct stars were originally thought to pulsate only in high-frequency modes, typically with frequencies d-1. Observations from space using the Kepler satellite show that, in fact, all Sct stars contain low frequencies (Balona, 2014). The low frequencies reach maximum amplitudes in the region overlapping the blue edge of the Dor instability strip. From the ground, Sct stars with both high and low frequencies, the “ Dor/ Sct hybrids”, are mostly seen in this region of the H-R diagram. This term arises from a misconception since low frequencies are nearly always detected in Sct stars given sufficient precision.
Whereas Sct stars contain both low and high frequencies, we define a Dor star by the presence of low frequencies and the absence of high frequencies. Pulsation in Dor stars is driven by the convective blocking mechanism (Guzik et al., 2000). Since this requires a convective envelope of sufficient depth, this mechanism cannot operate in stars hotter than late A or early F. The high-frequency pulsations in Sct stars are driven by the (opacity) mechanism operating in the He II ionization zone (Pamyatnykh, 2000). Models of non-rotating Sct stars indicate that only modes with frequencies higher than about 5 d-1 are driven. The mechanism driving the low frequencies is currently not understood (Balona et al., 2015b).
The location of Kepler Dor stars in the H-R diagram was investigated by Balona et al. (2011a). The blue edge of this sample of stars is well defined and agrees with the predictions of the convective blocking mechanism. It should be noted, however, that is often impossible to distinguish between pulsation and rotation for stars with only a few close peaks, and the sample is certainly contaminated with many non-pulsating spotted stars. It is thought that most cool stars, either fully convective or with a convective envelope like the Sun, will have spots on their surfaces. Over 500 stars of spectral types F–M are classified as rotational variables of this type (Strassmeier, 2009).
While the vast majority of Dor stars observed by Kepler are cooler than the granulation boundary (the division between stars with convective and radiative envelopes), as expected, there are a few anomalous stars observed by Kepler which have multiple low frequencies and no detectable high frequencies, but seem to be significantly hotter than the blue edge of the Dor instability strip. These hot Dor-like stars are discussed in Balona (2014). Note that Bradley et al. (2015) analysed a large number of faint Kepler targets and also found a few hot Dor candidates.
The presence of anomalous hot Dor variables clearly poses a problem as there is no known mechanism to drive these pulsations. The effective temperatures, , are derived from multiband Sloan photometry and listed in the Kepler Input Catalogue (KIC, Brown et al. 2011). However, the KIC photometry does not include measurements in the UV and the derived are not reliable for B-type stars. It is possible that the for anomalous hot Dor stars are in error. They could, in fact, be normal Dor stars or SPB stars. The SPB variables are mid- to late-B stars which pulsate in multiple low frequencies driven by the mechanism due to the opacity bump of iron-group elements. Their light curves closely resemble those of Dor stars.
The cool edge of the SPB instability strip is at about 11500 K and the hot edge of the Sct instability strip is at about 8500 K. Between these two instability strips no pulsating star is expected to be found. However, there have been persistent reports of stars with high frequencies, typical of SPB or Sct variables, located in this region of the H-R diagram and termed “Maia variables”. Mowlavi et al. (2013) have found what appears to be several examples of this class in photometric observations of the young open cluster NGC 3766. They discovered a large population (36 stars) of new variable stars between the red edge of the SPB instability strip and the blue edge of the Sct instability strip. Most stars have periods in the range 0.1–0.7 d, with amplitudes between 1–4 mmag. About 20 percent of stars in this region of the H-R diagram were found to be variable. More recently, Balona et al. (2015a) have re-analysed the Kepler B stars and found many stars with well-determined in this region of the H-R diagram.
Apart from the low frequencies in Sct stars, the hot Dor stars and the Maia variables provide clear challenges to our current understanding of stellar pulsation. The aim of this paper is to report and analyse new spectroscopic observations of some of these stars in the Kepler field. Our aim is to determine whether or not the effective temperatures of these stars are in error and to decide whether they may possibly be explained as composite stars.
2 Spectroscopic observations
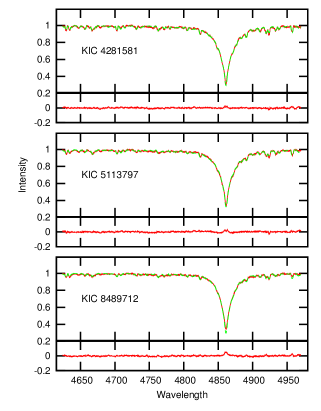
Spectra for three stars, KIC 4281581, KIC 5113797 and KIC 8489712, were obtained in 2014 March at the Special Astrophysical Observatory (SAO) of the Russian Academy of Sciences with the MSS spectrograph attached to the 6-m telescope (BTA). The detector is a 2K4K CCD. The spectra cover the wavelength range 4430–4985 Å with .
The analysis was carried out in a semi-automatic manner with the latest version of SME (Valenti & Piskunov, 1996). It is sometimes difficult to find a suitable fit to the core of the hydrogen line profiles, which is quite sensitive to the effective temperature and the projected rotational velocity. Observed and fitted spectra of these stars are shown in Fig. 1.
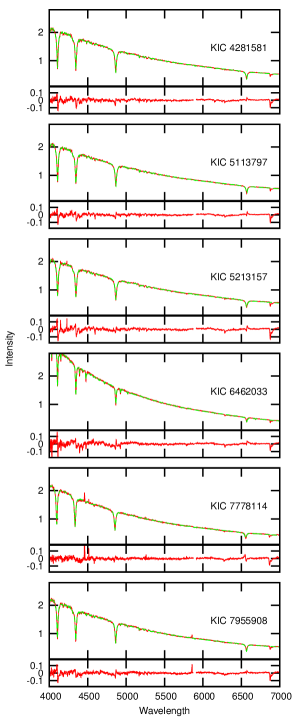
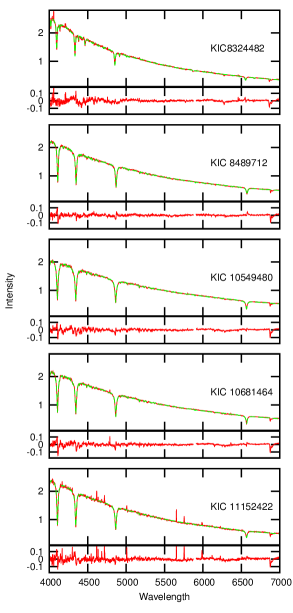
Low resolution spectra were obtained on 2015 September 23–24 with the Himalaya Faint Object Spectrograph and Camera (HFOSC) mounted on the 2.0-m Himalayan Chandra Telescope (HCT) operated by the Indian Institute of Astrophysics (IIA), Bangalore. The detector is a 2K2K SITe CCD. Most of the spectra cover the wavelength range 3800–7000 Å with a spectral resolution . A few spectra were obtained in the wavelength region 5800–8350 Å with .
The spectra were analysed using ULySS (University of Lyon spectroscopic software, Koleva et al. 2009) which can also be used for the determination of the stellar atmospheric parameters. A series of modelled spectra is generated based on an empirical library and compared with the observed spectrum. The sum of the squares of the differences between the observed and modelled spectrum is minimized to obtain the best fitting parameters. The selection of the empirical library depends upon the coverage of the stellar parameters and the spectral resolution. For our analysis, the MILES interpolator (Prugniel et al., 2011), based on the MILES library (Sánchez-Blázquez et al., 2006) was used. The resolution of the MILES spectra, , closely matches with that of the spectra obtained with HFOSC at HCT. The observed and fitted spectra are shown in Figs. 2 and 3.
The derived stellar parameters are listed in Table 1 for those stars that we classified as anomalous hot Dor stars and in Table 2 for stars which could be assigned normal variability types, either SPB or Sct.
| KIC | Sp. | Kp | [Fe/H] | Ref | Period | ||||||
|---|---|---|---|---|---|---|---|---|---|---|---|
| type | mag | K | dex | K | dex | dex | km s-1 | d | |||
| 4934767 | 11.24 | 9870 | 4.25 | 1.44 | |||||||
| 5113797 | 9.15 | 8280 | 3.83 | 7710 | 3.5 | -0.3 | 137 | 1 | 1.83 | 2.418a | |
| 8700 | 4.5 | -0.4 | 2 | 0.90 | |||||||
| A3IV-V | 8100 | 4.0 | 112 | 3 | |||||||
| 5213157 | 11.94 | 8460 | 3.81 | 8700 | 4.5 | -0.3 | 2 | 0.90 | 0.5452b | ||
| 5429163 | A5V | 9.72 | 8220 | 4.02 | 8100 | 4.0 | -0.1 | 163 | 3 | 1.31 | |
| 7694191 | 10.78 | 8000 | 3.54 | 1.83 | 0.3762c | ||||||
| 7767565 | Am | 9.32 | 7800 | 3.8 | 0.4 | 65 | 3 | 1.51 | |||
| 7778114 | 11.98 | 8890 | 4.11 | 9500 | 4.1 | -0.5 | 2 | 1.50 | |||
| 8489712 | A2IVs | 8.62 | 8490 | 3.52 | 8150 | 3.0 | -0.3 | 120 | 1 | 2.60 | |
| 8650 | 3.4 | -0.7 | 2 | 2.20 | |||||||
| 8800 | 3.5 | 0.1 | 126 | 3 | |||||||
| 8270 | 2.9 | -0.6 | 119 | 4 | |||||||
| 8523871 | 12.36 | 8390 | 4.45 | 0.84 | |||||||
| 10096499 | A3V | 6.92 | 7920 | 4.13 | 7960 | 3.3 | 0.0 | 90 | 4 | 2.21 | |
| 10549480 | A2 | 9.75 | 8580 | 3.95 | 8900 | 4.6 | -0.4 | 2 | 0.80 | 0.9579c | |
| 10681464 | 11.48 | 8970 | 4.02 | 8900 | 4.5 | -0.3 | 2 | 1.00 | 0.8599b | ||
| HD 148542 | A3IV | 6.03 | 8470 | 92 | 6,7 | 2.04 |
| KIC | Sp. | Kp | [Fe/H] | Ref | Period | Type | ||||||
|---|---|---|---|---|---|---|---|---|---|---|---|---|
| type | mag | K | dex | K | dex | dex | km s-1 | d | ||||
| 3756846 | 15.75 | 11000 | 3.94 | 2.08 | SPB | |||||||
| 4281581 | 9.40 | 8290 | 3.84 | 8090 | 3.5 | -0.1 | 113 | 1 | 1.93 | Sct? | ||
| 8900 | 4.5 | -0.3 | 2 | 1.00 | ||||||||
| A3IV-Vs | 8200 | 3.9 | 105 | 3 | ||||||||
| 6462033 | 10.72 | 8530 | 4.32 | 18400 | 4.2 | -0.3 | 2 | 3.00 | 0.6994b | SPB | ||
| 7150 | 4.3 | 90 | 5 | |||||||||
| 7955898 | 12.32 | 8680 | 3.65 | 8300 | 3.7 | -0.5 | 2 | 1.70 | 0.8132b | Sct? | ||
| 8324482 | A0 | 11.61 | 8300 | 3.82 | 18900 | 4.2 | -0.5 | 2 | 3.00 | SPB | ||
| 11152422 | 15.00 | 9290 | 4.02 | 9000 | 4.0 | -1.4 | 2 | 1.40 | Sct? |
3 Stellar parameters
It should be noted that the KIC effective temperatures for A stars are remarkably consistent with those derived from high-dispersion spectroscopy. From 107 stars with both KIC and spectroscopic parameters, Balona et al. (2015b) found “ that spectroscopic estimates of of A stars are systematically 144 K higher than those in the KIC (the corrected KIC values are shown in Tables 1 and 2). Moreover, the standard deviation for is 150 K from spectroscopy and 200 K for the KIC value. The KIC effective temperature is thus quite sufficient to distinguish between normal Dor stars and hot Dor variables. However, there is a problem with the KIC value of for the B stars. B stars can easily be assigned temperatures within the A star region. What is required is simply to distinguish between an A star and a B star, and this is easily done with low-dispersion spectra by looking for the presence of He I lines.
Stellar parameters determined from the low-dispersion HFOSC spectra have typical errors as follows: K, dex, [Fe/H] = 0.13. Parameters from the MSS observations have the following typical errors: K, dex, [Fe/H] = 0.1. These are certainly sufficient to locate a star in the H-R diagram with enough precision for our purposes. In addition to our spectroscopic results, Tables 1 and 2 also list spectroscopic parameters derived from the literature.
4 The hot Dor stars
Most of the hot Dor star candidates listed in Table 1 are from Balona (2014). Also shown are additional candidates selected from Kepler Dor stars that are hotter than the granulation boundary. Antonello et al. (2006) discovered line profile variations in HD 148542 (HR 6139) that can be explained by prograde g-modes similar to those observed in SPB stars, though it has a spectral type of A2V. This star can also be considered a candidate hot Dor variable.
HD 208727 was reported as an anomalous pulsator, but Kallinger et al. (2002) found it to be a rotational variable with a period of 0.317 d. Other candidates such as HD 29573 and CrB (Percy & Wilson, 2000) are most likely rotational variables as well, but further observations are required.
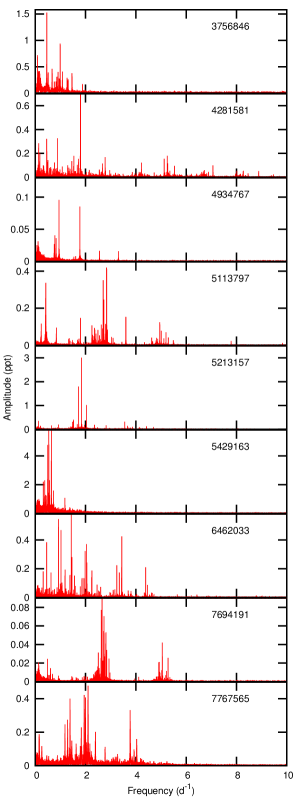
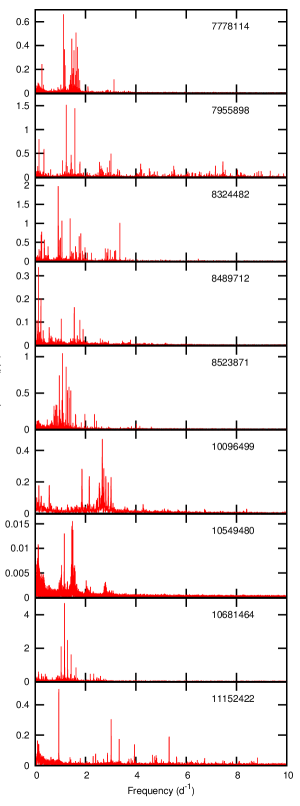
The periodograms of the long-cadence (30-min exposures) of these stars and other stars are shown in Figs. 4 and 5. Note that in long-cadence data a frequency, , above 24 d-1 appears as a peak at approximately d-1. If the data were taken at strictly exact time intervals, it would not be possible to discern any frequencies higher than 24 d-1. Fortunately this is not the case and it is indeed possible to identify frequencies higher than this value if the amplitudes are sufficiently high (Murphy et al., 2013). Examination of the long-cadence periodograms show that no such peaks are visible. Moreover, short-cadence data are available for KIC 5113797, 8489712 and 10549480 and it is clear that high frequencies are absent in these three stars.
In Table 2 we show stars which are probably SPB or Sct variables. KIC 4281581, KIC 7955898 and KIC 11152422 have some very low-amplitude peaks in the high-frequency range (Figs. 4, 5) and are possibly Sct variables. KIC 3756846, 6462033, 8324482 are hot enough to be classified as SPB stars.
For KIC 8489712 there is quite a large discrepancy between the [Fe/H] value from Tkachenko et al. (2013) and from Niemczura et al. (2015). The difference in line strengths between the two abundance values is large, so either there is a mistake in one of these measurements or the star is a spectrum variable. Our measurements support the lower metallicity.
KIC 5113797, which is close to the open cluster NGC 6819, appears to show one flare (Balona, 2015) and is also an X-ray source (Gosnell et al., 2012).
The largest discrepancy in Table 2 occurs for KIC 6462033 where we find K, but Ulusoy et al. (2014) find K. Our spectrum shows strong He I 4437 and He I 4471 which can only occur in a B star, so the difference is very puzzling. The field is slightly crowded, but KIC 6462033 is by far the brightest star in the field. The available photometry gives which would also indicate a B star rather than a mid-A star.
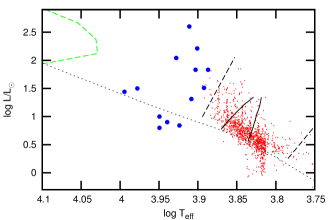
The results in Table 1 mostly confirm that the stars are indeed significantly hotter than the blue edge of the known Dor stars. Using values of , and [Fe/H], the luminosity may be estimated using the relationship in Torres et al. (2010). For those stars without spectroscopic estimates, we use the values listed in the KIC. The location of these stars in the theoretical H-R diagram is shown in Fig. 6. The red and blue edges of the Dor instability strips shown in this figure were both calculated using time-dependent theories of convection. In the calculations by Dupret et al. (2004), the location of the instability strip depends on the choice of mixing length parameter, . Here we show the edges calculated with for modes with spherical harmonic . The strip moves towards cooler temperatures for smaller values of . The red and blue edges calculated by Xiong et al. (2016) are for and use a different non-local, time-dependent convection theory. The differences in location of the red and blue edges is quite remarkable and illustrates our poor understanding of convection and how it interacts with pulsation. As can be seen, the hot Dor stars are located outside the blue edge of the Dor instability strip and the red edge of the SPB instability strip.
5 Maia variables
Reports of pulsating stars between the blue edge of the Sct instability strip and the red edge of the SPB instability strip have been reported from time to time. Struve (1955) suggested the possibility of a new class of variables on the basis of radial velocity observations of the late B star Maia, a member of the Pleiades. Later, Struve et al. (1957) disclaimed such variability in Maia. Since that time, several attempts have been made to detect periodic variability in stars lying in this region of the H-R diagram, without success (McNamara, 1985; Scholz et al., 1998; Lehmann et al., 1995). The situation is confusing because in these searches no distinction was made between high and low frequencies. Some variable stars lying in this region are probably best explained as rotational variables, as mentioned above.
Pulsation at high frequencies (i.e. higher than about 5 d-1) are expected in the Sct stars but also among the Cep variables. These are typically O9–B3 stars where the pulsations are driven by the ionization of metals of the iron group elements (Dziembowski & Pamiatnykh, 1993). We define Maia variables as stars lying between the red edge of the Cep instability strip and the blue edge of the Sct instability strip which show multiple high frequencies. Models indicate that such stars should not exist in this region.
One such star, Dra, is classified as A0 III with a period of about 53 min and very small amplitude. This may be considered as a good example of a Maia variable (Kallinger et al., 2004). Degroote et al. (2009) and Balona et al. (2011b) found examples of B-type stars with high frequencies and low amplitudes which are significantly cooler than the red edge of the Cep instability strip. These may also be considered as Maia candidates.
A list of Maia candidates compiled from the literature is given in Table 3. The atmospheric parameters of the presumed Maia variables observed by CoRoT, (CoRoT 102729531, 102771057, 102790063, 102861067, Degroote et al. 2009) were obtained from Strömgren photometry without the index. Subsequently, spectroscopic observations have shown that these are mid-A stars (Sebastian et al., 2012). Therefore they are probably just normal Sct variables. Table 3 lists the five remaining CoRoT Maia candidates without spectral classifications. Better estimates of the stellar parameters are required to decide whether they are Maia variables or normal Sct stars.
| Name | Sp. | V | Ref | |||
|---|---|---|---|---|---|---|
| type | mag | K | km s-1 | |||
| Dra | A0III | 3.68 | 10100 | 2.68 | 26 | 1 |
| HD 121190 | B9V | 12200 | 1.96 | 118 | 4,5 | |
| HD 189637 | 10.86 | 19000 | 2.96 | 2 | ||
| HD 234893 | B5V | 9.33 | 14700 | 2.87 | 130 | 2 |
| HD 234999 | B9 | 9.09 | 11150 | 2.08 | 103 | 2 |
| HD 251584 | B9 | 11.12 | 2 | |||
| HD 253107 | B1V | 10.37 | 17600 | 2 | ||
| CoRoT 102862454 | 3 | |||||
| CoRoT 102790331 | 3 | |||||
| CoRoT 102848985 | 3 | |||||
| CoRoT 102922479 | 3 | |||||
| CoRoT 102850576 | 3 | |||||
| CoRoT 102850502 | 3 | |||||
| KIC 2987640 | 12.64 | 11000 | 1.87 | 2 | ||
| KIC 3343239 | 14.42 | 10691 | 1.97 | 2 | ||
| KIC 3459297 | 12.55 | 10600 | 1.14 | 2 | ||
| KIC 3756031 | B5IV-V | 10.00 | 16000 | 3.21 | 31 | 2 |
| KIC 4939281 | 12.08 | 18900 | 3.08 | 2 | ||
| KIC 8714886 | 10.95 | 19000 | 2.96 | 2 | ||
| KIC 10285114 | 11.23 | 18200 | 2.74 | 2 | ||
| KIC 11454304 | 12.95 | 17500 | 3.22 | 2 | ||
| KIC 11973705 | B8.5V/IV | 9.12 | 11150 | 2.11 | 103 | 2 |
| KIC 12258330 | B5V | 9.52 | 14700 | 2.88 | 130 | 2 |
| EPIC 202061002 | B9 | 12.40 | 9790 | 1.09 | 2 | |
| EPIC 202061129 | B9 | 14.01 | 9600 | 2 | ||
| EPIC 202061131 | B5 | 14.23 | 14200 | 2 | ||
| EPIC 202062129 | B.. | 11.62 | 18000 | 2 |
| Name | Sp. | V | Ref | |||
|---|---|---|---|---|---|---|
| type | mag | K | km s-1 | |||
| NGC 3766-50 | 11.08 | 16600 | 3.04 | 5 | ||
| NGC 3766-58 | 11.22 | 17200 | 2.96 | 5 | ||
| NGC 3766-59 | 11.25 | 16500 | 2.95 | 5 | ||
| NGC 3766-60 | 11.28 | 16500 | 2.93 | 5 | ||
| NGC 3766-62 | 11.39 | 16500 | 2.87 | 5 | ||
| NGC 3766-68 | 11.49 | 16300 | 2.81 | 5 | ||
| NGC 3766-69 | 11.50 | 15600 | 2.80 | 5 | ||
| NGC 3766-71 | 11.56 | 16600 | 2.77 | 5 | ||
| NGC 3766-78 | 11.67 | 16500 | 2.70 | 5 | ||
| NGC 3766-79 | 11.72 | 16000 | 2.67 | 5 | ||
| NGC 3766-83 | 11.77 | 15800 | 2.64 | 5 | ||
| NGC 3766-94 | 11.92 | 14600 | 2.55 | 5 | ||
| NGC 3766-105 | 12.11 | 15500 | 2.43 | 5 | ||
| NGC 3766-106 | 12.14 | 15800 | 2.42 | 5 | ||
| NGC 3766-112 | 12.20 | 15600 | 2.38 | 5 | ||
| NGC 3766-135 | 12.51 | 14500 | 2.19 | 5 | ||
| NGC 3766-136 | 12.53 | 13300 | 2.18 | 5 | ||
| NGC 3766-142 | 12.65 | 14700 | 2.10 | 5 | ||
| NGC 3766-144 | 12.61 | 12200 | 2.10 | 5 | ||
| NGC 3766-145 | 12.68 | 14200 | 2.09 | 5 | ||
| NGC 3766-147 | 12.74 | 12900 | 2.04 | 5 | ||
| NGC 3766-149 | 12.74 | 13700 | 2.05 | 5 | ||
| NGC 3766-161 | 12.86 | 13800 | 1.97 | 5 | ||
| NGC 3766-167 | 12.90 | 12900 | 1.95 | 5 | ||
| NGC 3766-170 | 12.92 | 14000 | 1.93 | 5 | ||
| NGC 3766-175 | 12.96 | 14000 | 1.91 | 5 | ||
| NGC 3766-194 | 13.10 | 13200 | 1.82 | 5 | ||
| NGC 3766-236 | 13.39 | 12300 | 1.65 | 5 | ||
| NGC 3766-259 | 13.56 | 12000 | 1.54 | 5 | ||
| NGC 3766-278 | 13.72 | 10300 | 1.45 | 5 | ||
| NGC 1893-V60 | 14.53 | 9730 | 1.61 | 6 | ||
| NGC 1893-V70 | 14.51 | 9700 | 1.61 | 6 | ||
| NGC 1893-V71 | 14.44 | 12400 | 1.86 | 6 | ||
| NGC 1893-V72 | 14.21 | 9900 | 1.75 | 6 | ||
| NGC 1893-V74 | 14.22 | 10700 | 1.82 | 6 | ||
| NGC 1893-V79 | 14.71 | 11400 | 1.67 | 6 | ||
| NGC 1893-V81 | 14.17 | 12300 | 1.95 | 6 | ||
| NGC 1893-V84 | 14.66 | 11500 | 1.75 | 6 | ||
| NGC 1893-V89 | 14.24 | 11000 | 1.86 | 6 | ||
| NGC 1893-V90 | 14.65 | 11200 | 1.73 | 6 | ||
| NGC 1893-V91 | 14.56 | 12000 | 1.79 | 6 | ||
| NGC 1893-V98 | 14.72 | 11000 | 1.64 | 6 | ||
| NGC 1893-V102 | 14.38 | 9750 | 1.65 | 6 | ||
| NGC 1893-V109 | 14.61 | 11700 | 1.75 | 6 | ||
| NGC 1893-V123 | 14.45 | 9620 | 1.64 | 6 | ||
| NGC 1893-V129 | 14.39 | 9620 | 1.63 | 6 | ||
| NGC 1893-V145 | 13.97 | 11500 | 1.99 | 6 |
Estimation of atmospheric parameters in stars with spectral types between late B and early A is difficult. In this region the strength of the Balmer lines reaches a maximum. Since the effective temperature is estimated by fitting the H or H line profiles, the value of is uncertain. For this reason, the discovery of possible Maia candidates in open clusters, such as NGC 3766 (Mowlavi et al., 2013) and NGC 1893 (Lata et al., 2014), is very important because the position of the star along the main sequence is a much better indicator of .
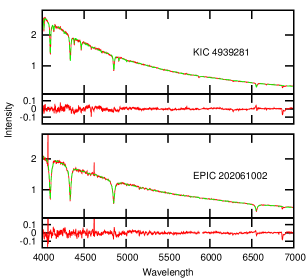
We observed two Maia candidates, EPIC 202061002 and KIC 4939281 (Balona et al., 2015a) with the HFOSC. These spectra are shown in Fig. 7. For EPIC 202061002 the best fit gives , , [Fe/H] =. For KIC 4939281, , , [Fe/H] =. KIC 4939281 is just outside the Cep instability strip and is perhaps better classified as a Cep variable.
Mowlavi et al. (2013) divides the stars in NGC 3766 into five variability groups. The 13 stars in Group 1 are mostly monoperiodic. Although they classified these stars as SPB variables, they may just as well be rotational variables. The 36 stars in Group 2 have periods in the range d. Of these, 23 stars are monoperiodic, 11 biperiodic and 2 have three frequencies. These stars fall between the SPB and Sct stars and are thus good candidates for Maia variables. However, the monoperiodic stars with periods longer than about 0.5 d can be considered as possible rotational variables. In Table 3 those stars which have periods too short to be due to rotation are listed. The other Groups consist of Sct and Dor stars.
We assume a distance modulus of mag and colour excess E(B-V) = 0.22 mag for NGC 3766 (McSwain et al., 2008). Given the apparent magnitude and assuming uniform reddening, we can determine the absolute magnitude, . The observed main sequence is well-defined and represents an isochrone of about 2.5 Myr (McSwain et al., 2008). We can fit an isochrone of this age and solar abundance using the models in Bressan et al. (2012). From the isochrone we can derive as a function of colour index and from . We used the bolometric correction as a function of by Torres (2010). The resulting values of and are shown in Table 3.
Among the 104 variables in NGC 1893 found by Lata et al. (2014), 17 stars could be classified as Maia variables on the basis of their locations in the H-R diagram and their short periods. These stars are listed in Table 3 with effective temperatures and luminosities taken from their paper. Except for a few stars with periods close to 0.5 d, the periods are too short to be due to rotation.
It should be noted that both Mowlavi et al. (2013) and Lata et al. (2014) provide no details regarding the significance of the detected periods or the alias structure. Results are presented in the form of phased light curves which, unfortunately, hides these details. It would have been far better to present the periodograms, which would enable a much more precise visual picture of the frequency structure and noise level in these data.
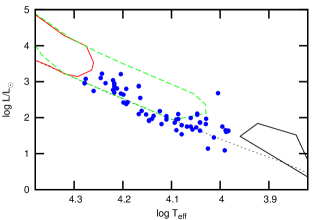
In Fig. 8 we show the location of the Maia candidates in the H-R diagram with respect to the Cep, SPB and Sct instability strips. While it is possible that hotter stars may be re-classified as Cep variables and the cooler stars as Sct variables, there still remains a considerable number of stars for which such a re-classification is unlikely. High-dispersion spectroscopic observations of these stars should clarify whether or not they are composite. In the meanwhile, it is probable that a re-evaluation of the physics on which current models are based may be required.
6 Discussion
It has been clear ever since the advent of high-precision photometry from space, that there is a serious problem with current models of pulsating stars in the upper main sequence. Models of Sct stars predict that only frequencies higher than about 5 d-1 are unstable, yet all Sct stars, when observed with sufficient precision, show unexplained multiple low frequencies (Balona, 2014; Balona et al., 2015b). In addition, there is a growing realization that other types of pulsating stars exist in the upper main sequence, besides the Sct, Cep and SPB variables. Furthermore, there is evidence that the atmospheres of A and B stars are more complex than previously thought. Here we refer to indications of superflares on A stars (Balona, 2013) and starspots on both A and B stars (Balona, 2016).
We need to remember that a large fraction of stars will show variability at the rotational frequency. In the past, the presence of spots or co-rotating features in upper main sequence stars has been thought unlikely because radiative envelopes cannot support a magnetic field. This view needs to be reconsidered in the light of the fact that nearly half of all A and B stars show what appears to be rotational modulation when observed with sufficient photometric precision (Balona, 2013, 2016). Mis-classification of rotational modulation as pulsation certainly adds to the confusion.
In this paper we describe two types on anomalous pulsating stars. The hot Dor variables have multiple low frequencies, but no high frequencies, and lie between the red edge of the SPB and the blue edge of the Dor instability strip. The Maia variables have multiple high frequencies and lie between the red edge of the Cep and the blue edge of the Sct instability strips. Current models are unable to account for pulsations in either of these two classes, adding to the problems of pulsation in the upper main sequence.
We observed several hot Dor candidates spectroscopically to verify their effective temperatures. In most cases the results confirm the anomalous nature of these objects. Two Maia candidates were also observed. These results, together with the anomalous cluster stars observed by Mowlavi et al. (2013) and Lata et al. (2014) and several well-observed brighter stars, leave little doubt that these two kinds of anomalous pulsating stars do exist.
One possible explanation for the hot Dor stars is that they are rapidly-rotating SPB stars, as suggested by Salmon et al. (2014) and Balona et al. (2015a). In a rapidly-rotating star, the equator is darker than the poles. If the star is observed equator-on, it will appear cooler than if it is observed pole-on. It is conceivable that such stars will appear to lie outside the red edge of the SPB instability strip and be seen as hot Dor variables. In that case, all hot Dor variables should have large projected rotational velocities, . The mean for B5–B9 main sequence stars (the typical spectral type range of SPB variables) is km s-1 as derived from the catalogue of Glebocki & Gnacinski (2005). The mean value of the 6 stars in Table 1 with known projected rotational velocities is km s-1, which does not lend any support to this idea. In any case, it is difficult to see how rotation can move the apparent location of an SPB star to a location near the hot end of the Dor instability strip, where most of these stars appear to lie (see Fig. 6). In fact, Salmon et al. (2014) found only a slight decrease in the apparent effective temperature of rotating stars as a result of gravity darkening.
A similar explanation could be proposed for the Maia variables, i.e. that they are rapidly-rotating Cep stars observed nearly equator-on. The mean projected rotational velocity for O9–B3 main sequence stars (the typical spectral type range of Cep variables) is km s-1 as derived from the catalogue of Glebocki & Gnacinski (2005). On the other hand, the mean value for the 7 stars in Table 3 is 92 km s-1, which does not support this idea. Furthermore, it is difficult to understand how rotation can make a O9–B3 Cep star to appear as an late B or early A star, as many Maia variables appear to be.
One can also assume that these stars are composite, which was proposed by Balona et al. (2011b). In the case of a hot Dor star the system would consist of a non-pulsating early A or B star and a cool Doradus companion. Because of the large luminosity difference, it would be difficult to detect the Dor companion in the composite spectrum. This possibility certainly should be investigated using high-dispersion, high signal-to-noise, spectroscopy. We found no evidence of a cool companion in any of the stars that were observed. A similar explanation can be proposed for Maia variables. In that case they need to be Cep stars with a cool, though fairly luminous non-pulsating companion or else a Sct star with a B-type companion. This explanation does not seem plausible in the light of the numerous Maia candidates found in NGC 3766 (as many as 20 percent of the stars in the corresponding magnitude range, Mowlavi et al. 2013) and in NGC 1893 (Lata et al., 2014).
We conclude that the most probable explanation should be sought in a revision of opacities (Colgan et al., 2016; Moravveji, 2016). In the light of the complexity of early-type atmospheres, a temperature inversion in the upper atmosphere may exist. In this case a modification of the outer boundary condition in pulsating models should perhaps be considered. Finally, it might be worth exploring the possibility of sub-surface convection zones in intermediate mass stars as was done by Cantiello et al. (2009) for massive stars.
Acknowledgments
This work has been done under the Indo-South Africa project DST/INT/SA/P-02.
This paper includes data collected by the Kepler mission. Funding for the Kepler mission is provided by the NASA Science Mission directorate. The authors wish to thank the Kepler team for their generosity in allowing the data to be released and for their outstanding efforts which have made these results possible.
Much of the data presented in this paper were obtained from the Mikulski Archive for Space Telescopes (MAST). STScI is operated by the Association of Universities for Research in Astronomy, Inc., under NASA contract NAS5-26555. Support for MAST for non-HST data is provided by the NASA Office of Space Science via grant NNX09AF08G and by other grants and contracts.
LAB wishes to thank the South African Astronomical Observatory and the National Research Foundation for financial support. SJ and ES acknowledges the grants INT/RFBR/P-118 and RFBR Grant No. 12-02-92693-IND_a jointly funded by DST Govt of India and Russian Academy of Science, Russia. Observations on the SAO RAS 6-meter telescope are carried out with financial support from the Ministry of Education and Science of the Russian Federation (agreement No. 14.619.21.0004, project ID RFMEFI61914X0004). ES is thankful to the Russian Science Foundation (grant No. 14-50-00043) for financial support of this study.
References
- Aerts & Kolenberg (2005) Aerts C., Kolenberg K., 2005, A&A, 431, 615
- Antonello et al. (2006) Antonello E., Mantegazza L., Rainer M., Miglio A., 2006, A&A, 445, L15
- Balona (2013) Balona L. A., 2013, MNRAS, 431, 2240
- Balona (2014) —, 2014, MNRAS, 437, 1476
- Balona (2015) —, 2015, MNRAS, 447, 2714
- Balona (2016) —, 2016, MNRAS, 457, 3724
- Balona et al. (2015a) Balona L. A., Baran A. S., Daszyńska-Daszkiewicz J., De Cat P., 2015a, MNRAS, 451, 1445
- Balona et al. (2015b) Balona L. A., Daszyńska-Daszkiewicz J., Pamyatnykh A. A., 2015b, MNRAS, 452, 3073
- Balona et al. (2011a) Balona L. A., Guzik J. A., Uytterhoeven K., Smith J. C., Tenenbaum P., Twicken J. D., 2011a, MNRAS, 415, 3531
- Balona et al. (1994) Balona L. A., Krisciunas K., Cousins A. W. J., 1994, MNRAS, 270, 905
- Balona et al. (2011b) Balona L. A., Pigulski A., Cat P. D., Handler G., Gutiérrez-Soto J., Engelbrecht C. A., Frescura F., Briquet M., Cuypers J., Daszyńska-Daszkiewicz J., Degroote P., Dukes R. J., Garcia R. A., Green E. M., Heber U., Kawaler S. D., Lehmann H., Leroy B., Molenda-Żaaowicz J., Neiner C., Noels A., Nuspl J., Østensen R., Pricopi D., Roxburgh I., Salmon S., Smith M. A., Suárez J. C., Suran M., Szabó R., Uytterhoeven K., Christensen-Dalsgaard J., Kjeldsen H., Caldwell D. A., Girouard F. R., Sanderfer D. T., 2011b, MNRAS, 413, 2403
- Bertelli et al. (2008) Bertelli G., Girardi L., Marigo P., Nasi E., 2008, A&A, 484, 815
- Bradley et al. (2015) Bradley P. A., Guzik J. A., Miles L. F., Uytterhoeven K., Jackiewicz J., Kinemuchi K., 2015, AJ, 149, 68
- Bressan et al. (2012) Bressan A., Marigo P., Girardi L., Salasnich B., Dal Cero C., Rubele S., Nanni A., 2012, MNRAS, 427, 127
- Brown et al. (2011) Brown T. M., Latham D. W., Everett M. E., Esquerdo G. A., 2011, AJ, 142, 112
- Cantiello et al. (2009) Cantiello M., Langer N., Brott I., de Koter A., Shore S. N., Vink J. S., Voegler A., Lennon D. J., Yoon S., 2009, A&A, 499, 279
- Colgan et al. (2016) Colgan J., Kilcrease D. P., Magee N. H., Sherrill M. E., Abdallah Jr. J., Hakel P., Fontes C. J., Guzik J. A., Mussack K. A., 2016, ApJ, 817, 116
- Cousins & Warren (1963) Cousins A. W. J., Warren P. R., 1963, Monthly Notes of the Astronomical Society of South Africa, 22, 65
- De Cat et al. (2006) De Cat P., Eyer L., Cuypers J., Aerts C., Vandenbussche B., Uytterhoeven K., Reyniers K., Kolenberg K., Groenewegen M., Raskin G., Maas T., Jankov S., 2006, A&A, 449, 281
- Degroote et al. (2009) Degroote P., Aerts C., Ollivier M., Miglio A., Debosscher J., Cuypers J., Briquet M., Montalbán J., Thoul A., Noels A., De Cat P., Balaguer-Núñez L., Maceroni C., Ribas I., Auvergne M., Baglin A., Deleuil M., Weiss W. W., Jorda L., Baudin F., Samadi R., 2009, A&A, 506, 471
- Dupret et al. (2004) Dupret M., Grigahcène A., Garrido R., Gabriel M., Scuflaire R., 2004, A&A, 414, L17
- Dziembowski & Pamiatnykh (1993) Dziembowski W. A., Pamiatnykh A. A., 1993, MNRAS, 262, 204
- Glebocki & Gnacinski (2005) Glebocki R., Gnacinski P., 2005, VizieR Online Data Catalog, 3244
- Gosnell et al. (2012) Gosnell N. M., Pooley D., Geller A. M., Kalirai J., Mathieu R. D., Frinchaboy P., Ramirez-Ruiz E., 2012, ApJ, 745, 57
- Guzik et al. (2000) Guzik J. A., Kaye A. B., Bradley P. A., Cox A. N., Neuforge C., 2000, ApJ, 542, L57
- Handler (1999) Handler G., 1999, MNRAS, 309, L19
- Henry & Fekel (2005) Henry G. W., Fekel F. C., 2005, AJ, 129, 2026
- Henry et al. (2005) Henry G. W., Fekel F. C., Henry S. M., 2005, AJ, 129, 2815
- Kallinger et al. (2004) Kallinger T., Iliev I., Lehmann H., Weiss W. W., 2004, in IAU Symposium, Vol. 224, The A-Star Puzzle, J. Zverko, J. Ziznovsky, S. J. Adelman, & W. W. Weiss, ed., pp. 848–852
- Kallinger et al. (2002) Kallinger T., Reegen P., Weiss W. W., 2002, A&A, 388, L37
- Koleva et al. (2009) Koleva M., Prugniel P., Bouchard A., Wu Y., 2009, A&A, 501, 1269
- Lata et al. (2014) Lata S., Yadav R. K., Pandey A. K., Richichi A., Eswaraiah C., Kumar B., Kappelmann N., Sharma S., 2014, MNRAS, 442, 273
- Lehmann et al. (1995) Lehmann H., Scholz G., Hildebrandt G., Klose S., Panov K. P., Reimann H.-G., Woche M., Ziener R., 1995, A&A, 300, 783
- McDonald et al. (2012) McDonald I., Zijlstra A. A., Boyer M. L., 2012, MNRAS, 427, 343
- McNamara (1985) McNamara B. J., 1985, ApJ, 289, 213
- McSwain et al. (2008) McSwain M. V., Huang W., Gies D. R., Grundstrom E. D., Townsend R. H. D., 2008, ApJ, 672, 590
- Moravveji (2016) Moravveji E., 2016, MNRAS, 455, L67
- Mowlavi et al. (2013) Mowlavi N., Barblan F., Saesen S., Eyer L., 2013, A&A, 554, A108
- Murphy et al. (2013) Murphy S. J., Shibahashi H., Kurtz D. W., 2013, MNRAS, 430, 2986
- Nielsen et al. (2013) Nielsen M. B., Gizon L., Schunker H., Karoff C., 2013, A&A, 557, L10
- Niemczura et al. (2015) Niemczura E., Murphy S. J., Smalley B., Uytterhoeven K., Pigulski A., Lehmann H., Bowman D. M., Catanzaro G., van Aarle E., Bloemen S., Briquet M., De Cat P., Drobek D., Eyer L., Gameiro J. F. S., Gorlova N., Kamiński K., Lampens P., Marcos-Arenal P., Pápics P. I., Vandenbussche B., Van Winckel H., Stȩślicki M., Fagas M., 2015, MNRAS, 450, 2764
- Pamyatnykh (2000) Pamyatnykh A. A., 2000, in Astronomical Society of the Pacific Conference Series, Vol. 210, Delta Scuti and Related Stars, Breger M., Montgomery M., eds., p. 215
- Percy & Wilson (2000) Percy J. R., Wilson J. B., 2000, PASP, 112, 846
- Prugniel et al. (2011) Prugniel P., Vauglin I., Koleva M., 2011, A&A, 531, A165
- Reinhold et al. (2013) Reinhold T., Reiners A., Basri G., 2013, A&A, 560, A4
- Salmon et al. (2014) Salmon S. J. A. J., Montalbán J., Reese D. R., Dupret M.-A., Eggenberger P., 2014, A&A, 569, A18
- Sánchez-Blázquez et al. (2006) Sánchez-Blázquez P., Peletier R. F., Jiménez-Vicente J., Cardiel N., Cenarro A. J., Falcón-Barroso J., Gorgas J., Selam S., Vazdekis A., 2006, MNRAS, 371, 703
- Scholz et al. (1998) Scholz G., Lehmann H., Hildebrandt G., Panov K., Iliev L., 1998, A&A, 337, 447
- Sebastian et al. (2012) Sebastian D., Guenther E. W., Schaffenroth V., Gandolfi D., Geier S., Heber U., Deleuil M., Moutou C., 2012, A&A, 541, A34
- Strassmeier (2009) Strassmeier K. G., 2009, A&A Rev., 17, 251
- Struve (1955) Struve O., 1955, S&T, 14, 461
- Struve et al. (1957) Struve O., Sahade J., Lynds C. R., Huang S. S., 1957, ApJ, 125, 115
- Tkachenko et al. (2013) Tkachenko A., Lehmann H., Smalley B., Uytterhoeven K., 2013, MNRAS, 431, 3685
- Torres (2010) Torres G., 2010, AJ, 140, 1158
- Torres et al. (2010) Torres G., Andersen J., Giménez A., 2010, A&A Rev., 18, 67
- Ulusoy et al. (2014) Ulusoy C., Stateva I., Iliev I. K., Ulaş B., 2014, New A, 30, 28
- Valenti & Piskunov (1996) Valenti J. A., Piskunov N., 1996, A&AS, 118, 595
- Xiong et al. (2016) Xiong D. R., Deng L., Zhang C., Wang K., 2016, MNRAS, 457, 3163