Non-equilibrium fractional quantum Hall states visualized by optically detected MRI
Abstract
Using photoluminescence microscopy enhanced by MRI, we visualize in real space both electron and nuclear polarization occurring in non-equilibrium FQH liquids. We observe stripe-like regions comprising FQH excited states which discretely form when the FQH liquid is excited by a source-drain current. These regions are topologically protected and deformable, and give rise to bidirectionally polarized nuclear spins as spin-resolved electrons flow across their boundaries.
pacs:
73.43.-f, 78.67.-n, 76.60.-k, 42.30.-dThe study of nuclear spins in semiconductor materials has become increasingly relevant as both a tool for probing the properties of electrons in semiconductors tycko ; barrett ; gammon ; kuzma ; kikkawa ; salis ; kumada ; freytag ; smet ; tiemann ; kronmuller ; kronmuller99 , and a means for developing understanding of quantum information processing kane ; vandersypen ; yusa ; petta ; koppens ; childress . These studies were enabled by unconventional nuclear magnetic resonance (NMR) in which nuclear polarization is detected via resistance or optical response of samples, i.e. resistively or optically detected NMR.
In particular, resisitively detected NMR has been a powerful tool for studying fractional quantum Hall (FQH) states kronmuller ; kronmuller99 ; freytag ; smet ; kumada ; tiemann . FQH states form in a strongly interacting 2D electron system under a perpendicular magnetic field at fractional values of the Landau level filling factor tsui . The FQH state is a type of topological state of matter, and owes its energetic stability to its boundaries, i.e. edge states, which exist between the bulk state and the surrounding vacuum wen . In the trivial case, e.g., , the 2D bulk of FQH states is gapped by electron-spin- (Zeeman energy) and Coulomb-interaction-induced energy gaps tsui . However, there also are non-trivial FQH states, e.g. , for which the gap can be closed at a certain critical magnetic field under which the non-magnetic (unpolarized) and perfect ferromagnetic (polarized) phases, corresponding to electron spin polarizations of and , respectively, are degenerate; this leads to a first-order phase transition and the formation of magnetic domains hayakawa . For slightly lower (higher) than , the ferromagnetic (non-magnetic) phase becomes the ground state.
Near the phase transition, it is known that longitudinal resistance is dramatically increased in response to a large source-drain current kumada ; freytag ; smet ; tiemann ; kronmuller ; kronmuller99 ; yusa bringing the system out of equilibrium. This enhancement is understood in conjunction with the nuclear spin polarization , as confirmed by resistively detected NMRkronmuller99 . However, the underlying mechanism behind the enhancement and the associated has been unknown for decades despite its importance and versatility. In this Letter, we examine the origins of this intriguing effect in relation to the topological stability of the non-equilibrium FQH state. Using photoluminescence (PL) microscopy enhanced by magnetic resonance imaging (MRI), we visualize in real space both electron and nuclear polarization occurring in non-equilibrium FQH liquids. In response to a perturbation, we show the discrete transformation of the topologically protected FQH liquid into stripe-like regions comprising FQH excited states. These regions constitute topologically protected structures across which spin-resolved electrons flow to generate bidirectionally polarized nuclear spins. These findings demonstrate powerful and sensitive microscopic visualization tools for exploring spin-related phenomena and furthering understanding of semiconductor physics.
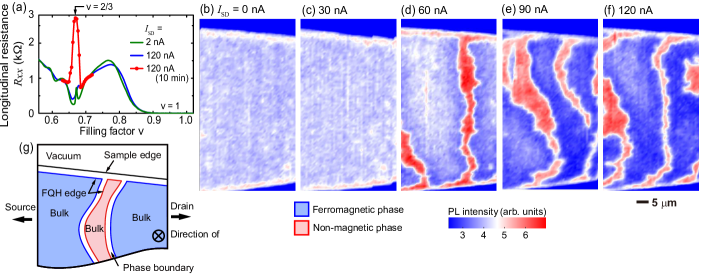
First, we confirmed the previously reported enhancement using a -nm-wide GaAs/AlGaAs quantum well (QW) sample containing a FQH liquid SI . Under the small perturbation of an alternating source-drain current ( nA, Hz) at approximately , , becomes low [Fig. 1(a), green line] with a small peak due to the phase transitionkronmuller ; kronmuller99 . In contrast, under large perturbation ( = nA), is dramatically increased in the steady state [Fig. 1(a), red line], similar to previous reports kumada ; freytag ; smet ; tiemann ; kronmuller ; kronmuller99 ; yusa .
Under these non-equilibrium conditions we obtained real-space images of FQH liquids [Figs. 1(b)1(f)] under varied -induced perturbations at T via polarization-sensitive scanning optical microscopy and spectroscopy of the sample’s PL hayakawa ; SI . The PL intensity from the singlet charged excitons yusaPRL ; wojs used to construct these images is primarily anti-correlated with the local hayakawa . Therefore, non-magnetic and ferromagnetic phases are distinguished by strong and weak PL intensities, respectively hayakawa . Because the ground state at () is a ferromagnetic phase, the PL of the entire region is uniformly low (blue) for low perturbation [ nA; Figs. 1(b) and 1(c)]. Gapless edge channels at the bulk-vacuum interface protect the gapped bulk FQH liquid, although its electrochemical potential is far from equilibrium owing to the Hall voltage, . For high perturbation, high-PL-intensity regions (red) appear (determined to indicate a non-magnetic phase based on their spectra hayakawa ) and bridge both sides of the sample. Importantly, these stripe-shaped structures comprising the excited FQH liquid extend over a macroscopic scale and are topologically protected at their boundaries; because the boundary of two coexisting phases requires spin flips, the exchange interaction induces an energy barrier at the boundary shibata , producing a new type of edge [Fig. 1(g)]. Through these exchange-interaction-induced edges, electrons injected from an electrode can return to the electrode (backscattering along the boundary), contributing to a non-zero [Fig. 1(a)].
This backscattering creates a local electrochemical potential difference across the two phases, generating potential steps at each phase boundary that descend monotonically in the direction opposing the conventional current. The reasonably well-reproducible stripe patterns SI indicate that these potential steps are comparable to fluctuations in the sample’s intrinsic random potential (eV hayakawa ; SI ). This, in turn, suggests that the backscattering rate at a boundary is using Landauer-Büttiker formalism datta , even without considering the internal structures of the ferromagnetic- and non-magnetic-phase edge states, which remain unclear bid ; wu . Note that there are spin-resolved electrons flowing along the edges, and almost all the electrons must cross phase boundaries to contribute to (forward scattering across the boundary), with half undergoing spin flipping.
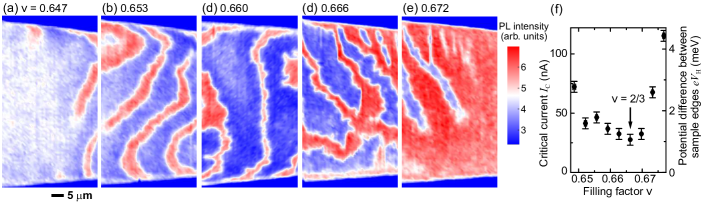
Such structures can be observed over a relatively wide range of [Figs. 2(a)2(e)], unlike the phase transition (hayakawa ). At , the areas of the two phases are almost equal, owing to the phase transition [Fig. 2(d)], and the minimum current (critical current; ) required to excite the stripe patterns is at a minimum [Fig. 2(f)]. For , the stripes are in the excited, i.e., non-magnetic (ferromagnetic) phase [Figs. 2(a)2(c) and 2(e)]. On either side of , increases sharply; thus, corresponds to the minimum energy required to flip a large amount of electron spins simultaneously to form the energetically unfavorable long-range-ordered structures.
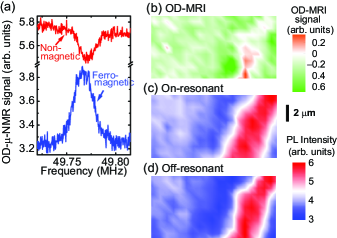
enhancement caused by backscattering is known to be linked to nuclear spin polarization as mentioned above freytag ; smet ; tiemann ; kronmuller99 ; yusa . Thus, we performed optically detected microscopic NMR (OD--NMR) to examine the relation between these stripe structures and . The -PL intensity was measured while irradiating the sample with continuous wave r.f. from a two-turn coil wrapped around the sample. The OD--NMR [Fig. 3(a)] is the -PL intensity plotted as a function of the irradiating r.f. frequency. This spectrum measured in the ferromagnetic (non-magnetic) phase shows a clear resonant peak (dip) corresponding to 75As nuclei [Fig. 3(a)]. The -kHz frequency difference between the peak and dip is caused by the difference in between and , respectively, which is consistent with the Knight shift obtained via resistively detected NMR yusaCondMat . The optically detected MRI (OD-MRI) image [Fig. 3(b)] shows the PL-intensity map corresponding to that collected during the on-resonant r.f. [Fig. 3(c)] minus that collected during the off-resonant r.f. [Fig. 3(d)]. In other words, this image displays the spatial distribution in the sizes of resonant PL peak (green regions) and dip (orange region) occurring in the ferromagnetic and non-magnetic phases, respectively [Fig. 3(b)].
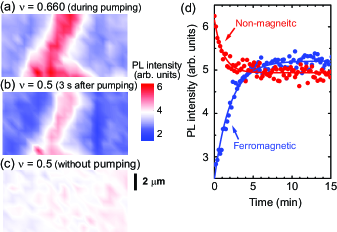
The PL images around contain contributions from the spatial distributions of both and . To extract the contribution of alone, we performed pump-probe imaging at , where is homogeneously tiemann . The pump-probe images shown in Figs. 4(a) and 4(b), were obtained via the following procedure: (i) The -PL collection spot was moved to an initial point; (ii) The pump condition was set ( for min with nA); (iii) The -PL spectrum was obtained; (iv) The probe condition ( with nA) was set; (v) After s, the -PL spectrum was obtained; and (vi) The collection spot was moved to the next point. We repeated this procedure while raster scanning the sample to construct the images under the pump [Fig. 4(a)] and probe [Fig. 4(b)] conditions. A stripe structure, which is generated by pumping the current at nA and [Fig. 4(a)], remains visible s after current deactivation () and changing to [Fig. 4(b)]. Under this condition, does not contribute significantly to the spatial pattern. Rather, the pattern seen here results from the remaining . A sufficient pause with no current pumping causes the pattern to disappear [Fig. 4(c)]. The longitudinal relaxation time of the nuclear spins at is estimated to be on the order of a minute, based on the PL time dependence measured at two fixed points in the two phases [Fig. 4(d)].
Both OD-MRI and pump-probe imaging clearly show that the nuclear spins are polarized on both sides of the phase boundaries, but with opposite polarities. This asymmetry across the boundary is expected for forward-scattering electrons contributing to which flip their spins after crossing into an adjacent domain. We conclude, therefore, that is parallel (anti-parallel) to in the non-magnetic (ferromagnetic) phase. These images also reveal that within m of the boundary tends to be slightly, yet noticeably, stronger than that far from the boundary [Figs. 3(b) and 4(b)], a tendency clearly visible in many of the PL images having stripes. We reason that this behavior is due to diffusion with a typical diffusion length of m. We cite the spatial distribution of as likely having a stabilizing effect on the stripe shapes over time. The generation of also modifies the electrochemical potential landscape via the Overhauser effect, which in turn modifies the rates of backscattering along the stripe boundaries.
The findings presented here give insight into the qualities of dynamic nuclear polarization (DNP) generated in non-trivial FQH liquids. The important role of topological protection in non-equilibrium phenomena of these liquids is also illuminated. At the same time, this study offers a form of MRI which surpasses conventional techniques in its sensitivity to polarization magnitude and direction and its spatial resolution. We believe these findings and methods are directly relevant to efforts in quantum engineering based on DNP, and to topological materials, extending to fractional topological insulators levin and topological quantum computation kitaev .
Acknowledgements.
The authors are grateful to N. Shibata, K. Muraki, K. Nomura, N. Kumada, and T. Fujisawa for discussions, and to Y. Hirayama and M. Matsuura for experimental support. This work was supported by the Mitsubishi Foundation, and a Grant-in-Aid for Scientific Research (no. 24241039) from the Ministry of Education, Culture, Sports, Science, and Technology (MEXT), Japan. J.N.M. was supported by a Grant-in-Aid from MEXT and the Marubun Research Promotion Foundation. J. H. was supported by a Grant-in-Aid from the Tohoku University International Advanced Research and Education Organization.References
- (1) R. Tycko, S. E. Barrett, G. Dabbagh, L. N. Pfeiffer, and K. W. West, Science 268, 1460 (1995).
- (2) S. E. Barrett, G. Dabbagh, L. N. Pfeiffer, K. W. West, and R. Tycko, Phys. Rev. Lett. 74, 5112 (1995).
- (3) D. Gammon, S. W. Brown, E. S. Snow, T. A. Kennedy, D. S. Katzer, and D. Park, Science 277, 85 (1997).
- (4) N. N. Kuzma, P. Khandelwal, S. E. Barrett, L. N. Pfeiffer, and K. W. West, Science 281, 686 (1998).
- (5) J. M. Kikkawa and D. D. Awschalom, Science 287, 473 (2000).
- (6) G. Salis, D. T. Fuchs, J. M. Kikkawa, D. D. Awschalom, Y. Ohno, and H. Ohno, Phys. Rev. Lett. 86, 2677 (2001).
- (7) S. Kronmüler, W. Dietsche, J. Weis, K. von Klitzing, W. Wegscheider, and M. Bichler, Phys. Rev. Lett. 81, 2526 (1998).
- (8) S. Kronmüller, W. Dietsche, K. von Klitzing, G. Denninger, W. Wegscheider, and M. Bichler, Phys. Rev. Lett. 82, 4070 (1999).
- (9) J. H. Smet, R. A. Deutschmann, W. Wegscheider, G. Abstreiter, and K. von Klitzing, Phys. Rev. Lett. 86, 2412 (2001).
- (10) N. Freytag, Y. Tokunaga, M. Horvatić, C. Berthier, M. Shayegan, and L. P. Lévy, Phys. Rev. Lett. 87, 136801 (2001).
- (11) N. Kumada, K. Muraki, and Y. Hirayama, Science 313, 329 (2006).
- (12) L. Tiemann, G. Gamez, N. Kumada, and K. Muraki, Science 335, 828 (2012).
- (13) B. E. Kane, Nature 393, 133 (1998).
- (14) L. M. K. Vandersypen, M. Steffen, G. Breyta, C. S. Yannoni, M. H. Sherwood, and I. L. Chuang, Nature 414, 883 (2001).
- (15) G. Yusa, K. Muraki, K. Takashina, K. Hashimoto, and Y. Hirayama, Nature 434, 1001 (2005).
- (16) J. R. Petta, A. C. Johnson, J. M. Taylor, E. A. Laird, A. Yacoby, M. D. Lukin, C. M. Marcus, M. P. Hanson, and A. C. Gossard, Science 309, 2180 (2005).
- (17) F. H. L. Koppens, J. A. Folk, J. M. Elzerman, R. Hanson, L. H. Willems van Beveren, I. T. Vink, H. P. Tranitz, W. Wegscheider, L. P. Kouwenhoven, and L. M. K. Vandersypen, Science 309, 1346 (2005).
- (18) L. Childress, M. V. Gurudev Dutt, J. M. Taylor, A. S. Zibrov, F. Jelezko, J. Wrachtrup, P. R. Hemmer, and M. D. Lukin, Science 314, 281 (2006).
- (19) D. C. Tsui, H. L. Stormer, and A. C. Gossard, Phys. Rev. Lett. 48, 1559 (1982).
- (20) X. G. Wen, Phys. Rev. Lett. 64, 2206 (1990).
- (21) J. Hayakawa, K. Muraki, and G. Yusa, Nat. Nano. 8, 31 (2013).
- (22) See Supplemental Material on (i) experimental details, (ii) morphology reproducibility and potential landscape.
- (23) G. Yusa, H. Shtrikman, and I. Bar-Joseph, Phys. Rev. Lett. 87, 216402 (2001).
- (24) A. Wójs, J. J. Quinn, and P. Hawrylak, Phys. Rev. B 62, 4630 (2000).
- (25) N. Shibata and K. Nomura, Phys. Soc. Jpn. 76, 103711 (2007).
- (26) S. Datta, Electron Transport in Mesoscopic Systems (Cambridge Univ. Press, Cambridge, 1995).
- (27) A. Bid, N. Ofek, H. Inoue, M. Heiblum, C. L. Kane, V. Umansky, and D. Mahalu, Nature 466, 585 (2010).
- (28) Y.-H. Wu, G. J. Sreejith, and J. K. Jain, Phys. Rev. B 86, 115127 (2012).
- (29) G. Yusa, N. Kumada, K. Muraki, and Y. Hirayama, arXiv:cond-mat http://arxiv.org/abs/cond-mat/0510310 (2005).
- (30) M. Levin and A. Stern, Phys. Rev. Lett. 103, 196803 (2009).
- (31) A. Y. Kitaev, Ann. Phys. 303, 2 (2003).