Water, methanol and dense gas tracers in the local ULIRG Arp 220: Results from the new SEPIA Band 5 Science Verification campaign
Abstract
We present a line survey of the ultra-luminous infrared galaxy Arp 220, taken with the newly installed SEPIA Band 5 instrument on APEX. We illustrate the capacity of SEPIA to detect the 183.3 GHz H2O 31,3-22,0 line against the atmospheric H2O absorption feature. We confirm the previous detection of the HCN(21) line, and detect new transitions of standard dense gas tracers such as HNC(21), HCO+(21), CS(43), C34S(43), HC3N(20-19). We also detect HCN(21) v2=1 and the 193.5 GHz methanol (43) group for the first time. The absence of time variations in the megamaser water line compared to previous observations seems to rule out an AGN nuclear origin for the line. It could, on the contrary, favor a thermal origin instead, but also possibly be a sign that the megamaser emission is associated with star-forming cores washed-out in the beam. We finally discuss how the new transitions of HCN, HNC, HCO+ refine our knowledge of the ISM physical conditions in Arp 220.
keywords:
galaxies: ISM – galaxies: individual: Arp220 – galaxies: starburst – ISM: molecules –1 Introduction
Arp 220 is one of the nearest (z=0.018) ultra-luminous infrared galaxy (LIR 1012 ). Many studies have analysed its massive molecular component and the physical conditions powering its intense infrared (IR) luminosity. Diffuse (e.g., low-J CO) and dense (HCN, HNC, HCO+) gas tracers have been detected (Krips et al., 2008; Imanishi et al., 2010; Greve et al., 2009, hereafter K08, I10 and G09), providing us with estimates of the molecular gas masses and densities. Physical conditions of the interstellar medium (ISM) can also be probed using maser (Microwave Amplified Stimulated Emission Radiation) emission (Lo, 2005). Even if the 22 GHz water megamaser emission has been detected in more than 150 extragalactic objects so far (it usually arises from Active galactic nucleus (AGN) central engines in Seyfert 2 or LINER galaxies; e.g. Braatz et al., 1996; Lo, 2005), this line was not detected towards Arp 220. Instead, Arp 220 exhibits OH megamaser emission (Rovilos et al., 2003). Using the IRAM 30-m telescope, Cernicharo et al. (2006) (hereafter C06) have detected the H2O(31,3-22,0) line at 183.3 GHz. The line, originating from a transition at a low energy level above ground state, is of sufficient luminosity to be classified as a megamaser. Given the absence of the 22 GHz water emission, they suggest that the 183 GHz emission is arising from the relatively spatially extended starburst (from about 106 star-forming cores) as opposed to denser molecular gas in the AGN nuclei.
The SEPIA (Swedish-European Southern Observatory PI receiver for APEX) Band 5 (159211 GHz) instrument is a dual polarization two-sideband receiver based on the ALMA Band 5 receivers (Billade et al., 2012). The Science Verification (SV) campaign was carried out on the Atacama Pathfinder Experiment (APEX) antenna in 2015. The galaxy Arp 220 was observed as part of the SV campaign because of its importance as a local benchmark for high-redshift galaxies. The goals of the following analysis are to i) compare the H2O(31,3-22,0) and HCN(21) lines observed with SEPIA Band 5 with previous observations in Arp 220 in order to test the calibration of the instrument and monitor the water line emission, ii) target millimeter wavelength CH3OH maser emission and analyse new transitions of standard dense gas tracers such as HNC, CS, HC3N or CH3CN now accessible with SEPIA Band 5. We describe the observations and data reduction technique in 2 and present a detailed overview of the various lines detected in 3. We analyse the observations in 4.
| Setup | Line | rest a | Vel. Offset b | FWHM | Tpeak c | Sdv | Previous measurements (d) | ||
|---|---|---|---|---|---|---|---|---|---|
| (GHz) | (km s-1) | (km s-1) | (mK) | (Jy km s-1) | (107 K km s-1 pc2) | FWHM | |||
| Tuning 1 e | HCN(21) | 177.26 | +99 13 | 452 25 | 9.6 0.4 | 157 11 | 80 6 | 530 20 | 88 26 |
| HCO+(21) | 178.37 | 0 g | 484 25 f | 4.6 0.3 | 79 7 | 40 3 | - | - | |
| Tuning 2 f | HNC(21) | 181.32 | +80 11 | 484 25 | 6.6 0.3 | 116 8 | 57 4 | - | - |
| HC3N(2019) | 181.94 | +84 29 | 262 54 | 1.9 0.2 | 18 4 | 9 2 | - | - | |
| H2O(31,322,0) | 183.31 | +67 14 | 332 31 | 4.1 0.3 | 50 6 | 24 3 | 310 | 25 | |
| C34S(43) | 192.82 | +128 42 | 495 92 | 1.3 0.1 | 23 5 | 10 2 | - | - | |
| CH3OH(43) | 193.45 | +25 27 | 333 42 | 2.0 0.2 | 23 5 | 10 2 | - | - | |
| CS(43) | 195.95 | +60 12 | 418 25 | 4.0 0.2 | 60 5 | 25 2 | - | - | |
-
Notes –
(a) z=0.018 (b) Velocity Offset of the fitted peak with the systemic velocity (c) in T scale (d) Same units. References: K08 and C06 (e) Frequency ranges observed = [172.2-176.2 GHz] (LSB) and [184.2-188.2 GHz] (USB) (f) Frequency ranges observed = [177.1-181.1 GHz] (LSB) and [189.1-193.1 GHz] (USB) (g) The HCO+(21) line is blended with the HCN(21) v2=1 line. The central velocity and width of the HCO+ line are fixed for the fitting.
2 Observations and data reduction
SEPIA Band 5 covers the frequency range 159211 GHz. The lower and upper sideband (LSB and USB) are separated by 12 GHz. Each sideband is recorded by 2 XFFTS (eXtended bandwidth Fast Fourier Transform Spectrometer) units of 2.5 GHz each, with a 1 GHz overlap. The spectral resolution of the data can reach up to 0.065 km s-1 and the beam size is 35″ (equivalent to 12.7 kpc for Arp 220). We use a Jy/K factor of 34 to convert between antenna temperature T and flux density111http://www.eso.org/sci/activities/apexsv/sepia/sepia-band-5.html. We refer to Billade et al. (2012) and Immer et al (in prep) for more details on the receiver. The performance of the instrument will be presented in a future paper. We conducted observations towards Arp 220 (Project ID: 095.F-9801; PI: Galametz) using the wobbler switch mode in 2015 July and September with a precipitable water vapour (pwv) 0.7 mm. The observations were carried out for a total time of 6.2 hours, with 2.8 hours on source. Pointings were regularly checked on Carina and a calibration scan was taken every 10 min. Data were reduced using CLASS/Gildas222Gildas Continuum and Line Analysis Single-dish Software, http://www.iram.fr/IRAMFR/GILDAS. We removed a linear baseline from each individual spectrum before averaging the data. The rms reached for the water and HCN observations are 0.7 mK and 1.2 mK respectively, at a 50 km s-1 resolution.
|
|
|
3 Overview of the detected lines
In this section, we present the lines detected by SEPIA Band 5 receiver toward Arp 220.
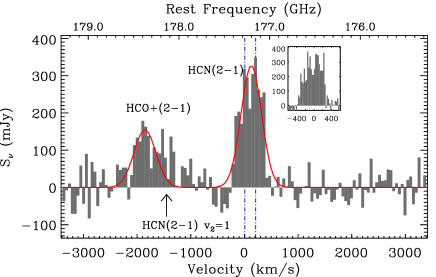
We show the spectra in Fig. 1 and describe the lines in order of decreasing peak temperature.
We provide the parameters of the Gaussian fits of the lines in Table 1. Note, however, that
some of the lines have broad non-Gaussian profiles.
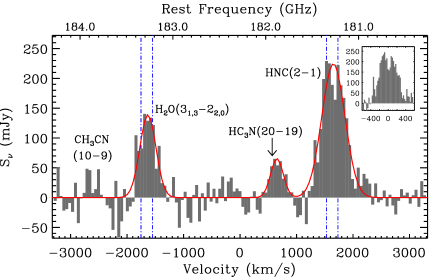
HCN and HNC - The hydrogen cyanide and isocyanide are very sensitive tracers of the dense molecular phase. The HCN luminosity is in particular used as a robust proxy for the star formation rate (e.g. Privon et al., 2015). Both HCN and HNC have been widely observed in Arp 220. HCN(21) is the strongest line in our observations. Its line width (452 km s-1) is consistent with that of the HCN(32) line estimated by C06 but smaller than the linewidth of the HCN(21) already observed by K08. The two HCN(21) flux densities, however, match within the uncertainties (Table 1). The right side of the HCN profile looks truncated. The width of the HNC(21) line is more consistent with the HCN linewidths estimated in K08. Its peak temperature is 1.5 times lower than that of HCN(21) (see 4.3). Both HCN and HNC exhibit a double-peak profile. The HCN(21) line has a stronger peak at higher velocities (+170 km s-1 shift compared to the systemic velocity). This asymmetry has already been found for HCN in the 32 and 43 transitions while the 10 line shows two symmetric peaks. On the contrary, the HNC(21) line shows a stronger peak at lower velocities (50 km s-1 shift compared to the systemic velocity) already observed in the 10 transition. Arp 220 possesses two nuclei, each of them being separated by about 1″ and resolved in the radio continuum at 1 and 6mm by Sakamoto et al. (1999) and Rodríguez-Rico et al. (2005). Our observations could indicate that a larger fraction of the HCN emission is arising from the red-shifted eastern nucleus (as already suggested by I10) and that a larger fraction of the HNC emission is arising from the blue-shifted western nucleus. However, recent observations of HCN with ALMA have shown that a double-peak velocity profile is observed towards each individual nucleus (Scoville et al., 2015; Martín et al., 2016). The double-peak profiles are thus probably linked with self- and continuum absorption along the line of sight. Follow-up imaging with ALMA would help disentangle the two effects in the future, when Band 5 becomes available on ALMA.
HCO+ - The formylium line traces gas 100-500 times denser than the low-J CO. Graciá-Carpio et al. (2006) suggested HCO+ as a more robust dense gas tracer in (U)LIRGs than HCN because of the enhanced HCN-to-CO ratio of these galaxies linked with IR pumping or chemical enhancement. Previous observations of HCO+ in Arp 220 in the 10, 32 and 43 transitions are reported in Graciá-Carpio et al. (2006), G09, I10 and Aladro et al. (2015). We detect HCO+(21) (rest = 178.4 GHz) for the first time toward Arp 220 (Fig. 1, top). The HCO+ line is blended with the HCN(21) line in its v2=1 vibrational state (rest = 178.1 GHz; HCNvib-to-HCN(21) line ratio 0.5). In order to properly fit the HCO+ profile, we thus use a Gaussian positioned at the expected frequency of the line and assume a similar width as the well constrained HNC line (i.e. 484 km s-1). We find a peak temperature of 4.6 mK (0.16 Jy), twice lower than that of HCN.
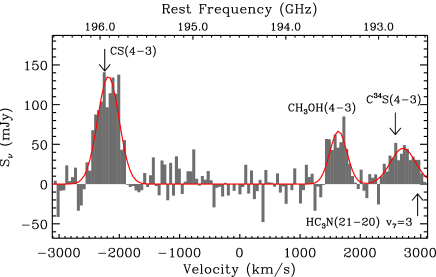
CS - Up to the 43 transition, the carbon monosulfide molecule traces gas densities of 105-106 cm-3 while higher transitions trace densities 106 cm-3 (Bayet et al., 2009; Shirley, 2015). In contrast with HCN or HNC, CS seems to be less affected by radiative excitation from X-ray dominated regions (XDRs) or by IR pumping (Meijerink et al., 2007). Previous observations of CS(21), (32), (54) and (76) toward Arp 220 are reported in G09 and Aladro et al. (2015). For the first time, the CS(43) line (rest = 195.9 GHz) is prominently detected in Arp 220 (Fig. 1, bottom). Its width is three times larger than the average line width of CS(43) lines observed in local (D 10Mpc) galaxies (Bayet et al., 2009). The CS(43) profile resembles the asymmetric broad profiles already observed in other transitions, with a redshifted stronger component (G09). The asymmetry could, as for HCN, be the sign of self-absorption: Scoville et al. (2015) also detected a double-peak profile in the CS line in both nuclei with ALMA. Zhang et al. (2014) have shown that a strong correlation (that extends over eight orders of magnitude) exists between the CS luminosity and the IR luminosity, making the CS luminosity an excellent proxy of the star formation rate. In Arp 220, the L’CS(7-6)-to-L’CS(4-3) ratio is equal to 0.76. Using the calibration of Zhang et al. (2014), this leads to a LIR estimate of 1.61012 , consistent with the LIR determined by Rangwala et al. (2011) using Herschel/SPIRE data (i.e. 1.81012 ). The relation linking LCS(4-3) and LIR can now be calibrated with SEPIA Band 5.
H2O - Submillimeter water line emission is considered to be an important gas cooling mechanisms in warm molecular clouds and the H2O line (rest = 183.3 GHz) only requires moderate densities (n(H2) = 104105 cm-3) and low temperatures (T40K) to be excited (Cernicharo et al., 1994). We confirm the detection of H2O(33,122,0) emission in Arp 220 (Fig. 1; middle), with a peak flux of 0.14 Jy and a width at half-power of 33231 km s-1. These values are consistent with the peak flux (0.17 Jy) and width at half-power (310 km s-1) obtained with IRAM data by C06 (see section 4.1 for further analysis).
CH3OH - Extragalactic methanol maser emission has been detected toward many objects (Henkel et al., 1987; Sjouwerman et al., 2010). In particular, millimeter methanol transitions are known to be sensitive (but sometimes degenerate) tracers of temperature and density. Millimeter CH3OH emission has been detected in Arp 220 by Martín et al. (2011), particularly the 54 group (241.8 GHz). Salter et al. (2008) also report an absorption feature from the 6.7 GHz methanol line. Our SEPIA observations give us an access to the 193.5 GHz methanol (43) group (Fig. 1, bottom). The peak flux is 68 mJy. The water and methanol lines have similar widths (equal to 333 km s-1 for CH3OH). We note that this is at the lower end of the line width range (280 to 590 km s-1) estimated from thermal molecules in Arp 220 by G09.
HC3N - Molecules from the cyanopolyyne family like HC3N are standard tracers of the dense gas in Galactic star forming regions but are also detected in extragalactic environments (Aladro et al., 2011; Lindberg et al., 2011) in many transitions (from 98 to 2827). Arp 220 is one of the very few “HC3N-luminous” galaxies (i.e. that the HC3N(109) line intensity is at least 15 of the HCN(10) line intensity; Aalto et al., 2002; Martín et al., 2011). The HC3N(2019) line is narrow and detected at 16% of the HNC(21) luminosity. Its profile looks symmetric but its peak is shifted. This is consistent with the assymetry observed in the 109 transition by Aalto et al. (2002) and could suggest that most of the emission emerges from the eastern nucleus.
C34S - We observe a strong and broad C34S(43) line at 192.8 GHz. The line is unfortunately at the edge of the velocity range observed. A HC3N vibrationally excited line resides in a similar frequency range (192.6 GHz; see Fig. 1, bottom)). Vibrationally excited emission of this species was already reported in Martín et al. (2011). The line should not contribute significantly due to its high energy level.
CH3CN - In Arp 220, the acetonitrile line was detected in both the ground and vibrationally excited states by Martín et al. (2011). Our observations cover the CH3CN(109) transition, for which we do not have a clear detection (2-; Fig. 1, middle). It is then difficult to say if the line is double-peaked as the HCN line.
4 Analysis
This section presents a first analysis of the data focused on the water, methanol, HCN, HNC and HCO+ lines. A more detailed analysis of the present and complementary datasets will be presented in a following paper.
4.1 Nature of the 183 GHz water emission
The 183 GHz H2O(33,122,0) line was observed by C06. Its intense luminosity suggested a megamaser (i.e. 106 times the luminosity of Galactic analogues) origin. We re-observe the H2O line to monitor its possible time variation if it is excited by AGN activity. We derive the isotropic line luminosity using:
| (1) |
with z being the redshift of the source, obs the rest frequency of the line, D the distance to the source and S dv the integrated flux density. We find an isotropic luminosity of 4.6 104 . This is million times more luminous than the typical 10-3 Galactic 22 GHz maser emission (Genzel & Downes, 1977). In Galactic targets, maser emission is typically stronger at 22 GHz compared to 183 GHz. Our detection is thus also more than a million times more luminous than the typical Galactic 183 GHz maser emission. It is also 2-3 orders of magnitude higher than 22 GHz masers detected in active galaxies (Braatz et al., 1996, among others). The Seyfert 2 galaxy NGC 3079 was the first extragalactic object where 183 GHz water emission was observed (Humphreys et al., 2005). The line was narrow ( 50 km s-1), and interpreted as arising from a portion of the AGN central engine. In contrast, the 183 GHz water line in Arp 220 is much broader than Galactic 183 GHz analogues (Waters et al., 1980) or than in NGC 3079. It has a profile similar to the HCN or HNC lines (the FWHM is 1.4 times narrower for H2O) that could suggest a thermal origin. The single-dish observations do not allow to disentangle between an extended/thermal and a nuclear/maser origin. AGN water megamasers at 22 GHz typically vary by factors of a few. Yet, we do not find variation between the 183 GHz water emission measured in 2005 by C06 and with SEPIA in 2015: the line has a similar width and luminosity. This lack of variability probably argues against the emission originating from an AGN nuclei in Arp 220 and provides weight to the proposal by C06 that the water megamaser emission in Arp 220 is associated with star formation and arises from individual cores (estimated at 106 by C06). The variabilities in these individual cores could then be washed-out in a single-dish spectrum. OH megamasers are, in the same way, not commonly reported to be highly variable in single-dish studies (variability 30%; e.g. Darling & Giovanelli, 2002). More SEPIA observations are needed to monitor possible variations in the water line. We finally note that González-Alfonso et al. (2012) suggested that the extreme H2O abundances in Arp 220 could also be the result of a hot core chemistry (i.e. characterized by the evaporation of icy grain mantles; see Charnley, 1995, among others).
4.2 Nature of the 193.5 GHz methanol emission
Extragalactic methanol maser emission was only classified as megamaser in NGC 1068 (84.5 GHz; Wang et al., 2014) and Arp 220 (36.2 and 37.7 GHz; Chen et al., 2015). We find an isotropic line luminosity of 2.30.3 104 for the 193.5 GHz methanol line, here again suggesting a megamaser origin. The luminosity is 9 orders of magnitude higher than typical Galactic or Large Magellanic Cloud methanol masers (Breen et al., 2010; Ellingsen et al., 2010). The line is much broader than typical extragalactic methanol masers or than the megamaser emission detected in Arp 220 by Chen et al. (2015), which could also favor a thermal origin. We note that the luminosity of the CH3OH(2k1k) line (7.5 107 K km s-1 pc2; Aladro et al., 2015) is lower than the luminosity of the 43 transition. In LTE conditions, the CH3OH(43) is expected to be more difficult to excite than the lower transitions if it was resulting from a pure thermal excitation. We cannot, however, rule out a thermal origin in the case of highly non-LTE excitation conditions. Getting more CH3OH lines at other frequencies would be necessary to understand the origin of the emission.
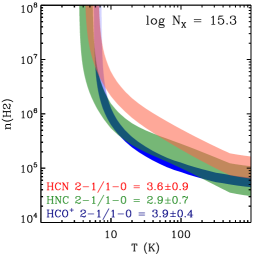
4.3 Line ratios and excitation conditions
Figure 2 shows the HCN, HNC, HCO+ and CS spectral line energy distributions (SLEDs). Fluxes are gathered from this work, Aalto et al. (2009) and G09 (we use the rms weighted averages of the reported line luminosities). Arp 220 is one of the few objects where the HNC/HCN(10) and (32) line ratios are close or above unity (Huettemeister et al., 1995, G09). In contrast, we find a HNC/HCN(21) luminosity ratio well below unity (0.7) that suggests a more standard HNC chemistry. A proper HNC(21) survey would help assess how the HNC/HCN(21) ratio in Arp 220 compares with other nearby galaxies. We use the non-LTE radiative transfer code Radex (van der Tak et al., 2007) to generate diagnostic plots of the HCN, HNC and HCO+ 21/10 ratios for various kinetic temperatures and H2 number densities. We simply assume here that the CMB 2.73 K emission dominates the background emission in the mm regime. Figure 2 shows the T-n(H2) parameter spaces covered by the 2/10 ratios if we assume the column density derived by Rangwala et al. (2011) from HCN high-J absorption lines, i.e. 21015 cm-2. We find that the domains covered by the 3 species barely overlap. Increasing the background blackbody temperature shifts all solutions to lower T and n(H2) but do not make the domains converge. A solution domain is reached when we assume higher column densities (1016 cm-2). It requires lower n(H2) (105 cm-3) than those derived in Rangwala et al. (2011), but similarly high temperatures ( 300 K). Another solution domain is reached for n(H2)107 cm-3 but the temperatures (10K) requested are too low to be realistic (much lower than the temperature of the dust in Arp 220). G09 and I10 have showed that using HCO+ line ratios results in n(H2) estimates 1-2 orders of magnitude lower than those derived from HCN. In contrast, our moderate HCN/HCO+(21) line ratio does not lead to such a strong discrepancy. We note however that the estimated HCO+(21) flux is high (Figure 2, left). Because the HCN(21) v2=1 line partly contributes to the flux, the HCO+(21) flux estimate is uncertain and should probably be considered as an upper limit.
The high HCN(21/10) renders the ratios difficult to reconcile with our simple model. In fact, many additional physical processes are at work in Arp 220. First, its HCN emission is thought to be enhanced via IR pumping. Rangwala et al. (2011) suggested, for instance, that the HCN high-J absorption lines might be populated via an IR pumping of the vibrational states. Vibrationally excited HCN is indeed observed toward Arp 220 (Aalto et al., 2015; Martín et al., 2016) and our detection of the HCN(21) v2=1 line is an additional sign that IR pumping processes are at work in Arp 220. These processes should also affect the HNC line, as suggested by Aalto et al. (2007). Second, our simple model neglects the effects of a hot dust background that could be non negligible (even on the line ratios) in extreme environments such as Arp 220 (Tunnard & Greve, 2016). Finally, the double-peak profiles of the HCN and HNC lines are strong signs of self- and continuum absorption whose effects on the various transitions of the lines still need to be properly quantified (Papadopoulos et al., 2010; Rangwala et al., 2015; Martín et al., 2016). These processes will be investigated and integrated in a more complex modelling in a following paper.

|
|
5 Conclusions
The paper presents new observations toward Arp 220 using the SEPIA Band 5 instrument on APEX. We demonstrate the capacity of SEPIA to observe the 183 GHz water and 193.5 GHz methanol lines in this extreme extragalactic environment. Their luminosities classify them as megamaser but the absence of variation in the water line could rule out an AGN nuclei origin. SEPIA is an ideal instrument to monitor variations of maser lines. Our observations complement the low-J SLEDs of standard molecular species, with lines such as HCN(21), HNC(21) and HCO+(21) or CS(43) lines. Arp 220 exhibits a more standard HNC/HCN(21) (1) and moderate HCN/HCO+(21) line ratio compared to other transitions. The HCN and HNC lines exhibit double-peak profiles probably linked with self- and continuum absorption. New transitions of HC3N and CH3CN and a vibrational excited HCN line are also detected with the instrument.
Acknowledgments
We would like to thank the referee for his/her very useful comments and suggestions and both the SEPIA team and the APEX operating team onsite for their hard work in making the SEPIA commissioning a success. APEX is a collaboration between the Max-Planck-Institut fur Radioastronomie, the European Southern Observatory (ESO), and the Onsala Space Observatory. SEPIA is a collaboration between Sweden and ESO. Z.Y.Z. acknowledges support from the European Research Council (Advanced Grant COSMICISM).
References
- Aalto et al. (2015) Aalto S. et al., 2015, A&A, 584, A42
- Aalto et al. (2002) Aalto S., Polatidis A. G., Hüttemeister S., Curran S. J., 2002, A&A, 381, 783
- Aalto et al. (2009) Aalto S., Wilner D., Spaans M., Wiedner M. C., Sakamoto K., Black J. H., Caldas M., 2009, A&A, 493, 481
- Aalto et al. (2007) Aalto S., et al., 2007, A&A, 464, 193
- Aladro et al. (2015) Aladro R. et al., 2015, A&A, 579, A101
- Aladro et al. (2011) Aladro R., Martín-Pintado J., Martín S., Mauersberger R., Bayet E., 2011, A&A, 525, A89
- Bayet et al. (2009) Bayet E., et al., 2009, ApJ, 707, 126
- Billade et al. (2012) Billade B. et al., 2012, Terahertz Science and Technology, Volume:2, Issue: 2
- Braatz et al. (1996) Braatz J. A., Wilson A. S., Henkel C., 1996, ApJS, 106, 51
- Breen et al. (2010) Breen S. L., Ellingsen S. P., Caswell J. L., Lewis B. E., 2010, MNRAS, 401, 2219
- Cernicharo et al. (1994) Cernicharo J., Gonzalez-Alfonso E., Alcolea J., Bachiller R., John D., 1994, ApJ, 432, L59
- Cernicharo et al. (2006) Cernicharo J., Pardo J. R., Weiss A., 2006, ApJ, 646, L49
- Charnley (1995) Charnley S. B., 1995, Ap&SS, 224, 251
- Chen et al. (2015) Chen X., Ellingsen S. P., Baan W. A., Qiao H.-H., Li J., An T., Breen S. L., 2015, ApJ, 800, L2
- Darling & Giovanelli (2002) Darling J., Giovanelli R., 2002, ApJ, 569, L87
- Ellingsen et al. (2010) Ellingsen S. P., Breen S. L., Caswell J. L., Quinn L. J., Fuller G. A., 2010, MNRAS, 404, 779
- Genzel & Downes (1977) Genzel R., Downes D., 1977, A&AS, 30, 145
- González-Alfonso et al. (2012) González-Alfonso E. et al., 2012, A&A, 541, A4
- Graciá-Carpio et al. (2006) Graciá-Carpio J., García-Burillo S., Planesas P., Colina L., 2006, ApJ, 640, L135
- Greve et al. (2009) Greve T. R., Papadopoulos P. P., Gao Y., Radford S. J. E., 2009, ApJ, 692, 1432
- Henkel et al. (1987) Henkel C., Jacq T., Mauersberger R., Menten K. M., Steppe H., 1987, A&A, 188, L1
- Huettemeister et al. (1995) Huettemeister S., Henkel C., Mauersberger R., Brouillet N., Wiklind T., Millar T. J., 1995, A&A, 295, 571
- Humphreys et al. (2005) Humphreys E. M. L., Greenhill L. J., Reid M. J., Beuther H., Moran J. M., Gurwell M., et al., 2005, ApJ, 634, L133
- Imanishi et al. (2010) Imanishi M., Nakanishi K., Yamada M., Tamura Y., Kohno K., 2010, PASJ, 62, 201
- Krips et al. (2008) Krips M., Neri R., García-Burillo S., Martín S., Combes F., Graciá-Carpio J., Eckart A., 2008, ApJ, 677, 262
- Lindberg et al. (2011) Lindberg J. E., Aalto S., Costagliola F., Pérez-Beaupuits J.-P., Monje R., Muller S., 2011, A&A, 527, A150
- Lo (2005) Lo K. Y., 2005, ARAA, 43, 625
- Martín et al. (2016) Martín S., Aalto S., Sakamoto K., González-Alfonso E., Muller S., Henkel C., et al., 2016, arXiv:1603.01291
- Martín et al. (2011) Martín S. et al., 2011, A&A, 527, A36
- Meijerink et al. (2007) Meijerink R., Spaans M., Israel F. P., 2007, A&A, 461, 793
- Papadopoulos et al. (2010) Papadopoulos P. P., Isaak K., van der Werf P., 2010, ApJ, 711, 757
- Privon et al. (2015) Privon G. C., Herrero-Illana R., Evans A. S., Iwasawa K., Perez-Torres M. A., Armus L., et al., 2015, ApJ, 814, 39
- Rangwala et al. (2011) Rangwala N. et al., 2011, ApJ, 743, 94
- Rangwala et al. (2015) Rangwala N., Maloney P. R., Wilson C. D., Glenn J., Kamenetzky J., Spinoglio L., 2015, ApJ, 806, 17
- Rodríguez-Rico et al. (2005) Rodríguez-Rico C. A., Goss W. M., Viallefond F., Zhao J.-H., Gómez Y., Anantharamaiah K. R., 2005, ApJ, 633, 198
- Rovilos et al. (2003) Rovilos E., Diamond P. J., Lonsdale C. J., Lonsdale C. J., Smith H. E., 2003, MNRAS, 342, 373
- Sakamoto et al. (1999) Sakamoto K., Scoville N. Z., Yun M. S., Crosas M., Genzel R., Tacconi L. J., 1999, ApJ, 514, 68
- Salter et al. (2008) Salter C. J., Ghosh T., Catinella B., Lebron M., Lerner M. S., Minchin R., Momjian E., 2008, AJ, 136, 389
- Scoville et al. (2015) Scoville N., et al., 2015, ApJ, 800, 70
- Shirley (2015) Shirley Y. L., 2015, PASP, 127, 299
- Sjouwerman et al. (2010) Sjouwerman L. O., Murray C. E., Pihlström Y. M., Fish V. L., Araya E. D., 2010, ApJ, 724, L158
- Tunnard & Greve (2016) Tunnard R., Greve T. R., 2016, ApJ, 819, 161
- van der Tak et al. (2007) van der Tak F. F. S., Black J. H., Schöier F. L., Jansen D. J., van Dishoeck E. F., 2007, A&A, 468, 627
- Wang et al. (2014) Wang J., Zhang J., Gao Y., Zhang Z.-Y., Li D., Fang M., Shi Y., 2014, Nature Communications, 5, 5449
- Waters et al. (1980) Waters J. W. et al., 1980, ApJ, 235, 57
- Zhang et al. (2014) Zhang Z.-Y., Gao Y., Henkel C., Zhao Y., Wang J., Menten K. M., Güsten R., 2014, ApJ, 784, L31