,
Optical properties of superconducting EuFe2(As1-xPx)2
Abstract
We present a broadband optical-conductivity study of superconducting single-crystalline EuFe2(As1-xPx)2 with three different substitutional levels. We analyze the normal-state electrodynamics by decomposing the conductivity spectra using a Drude-Lorentz model with two Drude terms representing two groups of carriers with different scattering rates. The analysis reveals that the scattering rate of at least one of the Drude components develops linearly with temperature for each doping level. This points towards strong electron-electron correlations and a non-Fermi-liquid behavior in the P-substituted superconducting Eu-122 pnictides. We also detect a transfer of the spectral weight from mid-infrared to higher frequencies and assign it to the Hund’s-rule coupling between itinerant and localized carriers. The conductivity spectra below the superconducting transition show no sharp features to be associated with the dirty-limit superconducting BCS gaps. We interpret these results in terms of clean-limit superconductivity in EuFe2(As1-xPx)2. The best parametrization fit can be achieved using a two-gap model. We find that the larger gap at the hole pockets of the Fermi surface is likely to be isotropic, while the smaller gap at the electron pockets is anisotropic or even nodal.
I Introduction
Among the superconducting iron pnictides, the so-called 122-family (Fe2As2 with =Ba, Sr, Ca, Eu) is the most studied composition. The superconductivity in this family can be achieved not only by doping the antiferromagnetic parent compounds with charge carriers, but also by pressure, either external or chemical Miclea2008 ; Ren2009 . Substituting As by isoelectric P is often considered as a “clean” route towards superconductivity VanderBeek2010 because in this case the conducting Fe layers remain undisturbed, the quasiparticle scattering is presumably not increased by the presence of dopants, and hence the inherent superconducting properties manifest themselves in the most vivid way. Indeed, most convincing experimental evidence for such remarkable properties as the presence of a quantum critical point (QCP) beneath the superconducting dome Shibauchi2014 ; Hashimoto2012 or the existence of the line nodes in the superconducting gap Hashimoto2010 have been obtained on P-substituted BaFe2As2.
Among the 122-family, the Eu-based systems are of particular interest because of their unique properties originating from the strong local-moment magnetism of the Eu2+ ions Jiang2009 ; Zapf2011 ; Zapf2013 ; Zapf2014 ; Nandi2014a ; Cao2011 ; Jeevan2011 ; KrugvonNidda2012 . More investigations on EuFe2(As1-xPx)2 are currently highly desirable to further examine the impact of the Eu2+ magnetism on electronic properties and to eventually compare the Eu-based systems with other members of the Fe2As2 family in this regard. In order to fulfill this task, we performed an optical investigation of EuFe2(As1-xPx)2. Optical spectroscopy is a proven powerful tool to gain insight into the electrodynamics of correlated-electron materials in general Basov2011 and of iron pnictides in particular Charnukha2014 .
II Experiment
We investigated EuFe2(As1-xPx)2 single crystals with three different levels of phosphorus content (, , and ). The samples with and (P015, P021) were grown at Zhejiang University in Hangzhou, China, via spontaneous nucleations, similar to the previous report Jiang2009 , but using Fe(As1-xPx) as the self flux. The sample (P0165) was synthesized at Göttingen University in Germany utilizing the Bridgeman method Jeevan2011 . The chemical compositions were found by energy-dispersive x-ray spectroscopy.
The dc resistivity measurements were made in a standard four-probe geometry using a home-built cryogenic setup. The magnetization measurements were performed in a Quantum Design MPMS T system in the static mode. All measurements presented in this article, including resistivity, magnetization, and optical reflectivity, were performed for the ab plane of EuFe2(As1-xPx)2 crystals (the “in-plane” geometry).
The optical reflectivity, , was investigated for temperatures between and K over a wide frequency range from to cm-1. Additionally, reflectivity measurements up to cm-1 were performed on sample P015 at room-temperature. Measurements at far-infrared frequencies (FIR, cm-1) were carried out with a Bruker IFS 113v Fourier-transform infrared (FTIR) spectrometer utilizing several beam-splitters and bolometric detectors operating at 4.2 and 1.3 K. For referencing, in situ gold coating of the samples was performed in this frequency range. At higher frequencies (i.e. in the mid- and near-infrared as well as in the visible ranges; MIR, NIR, VIS; cm-1) the measurements were conducted using a Bruker Hyperion infrared microscope attached to a Bruker Vertex 80v FTIR spectrometer. Freshly evaporated gold mirrors acted as references in MIR and NIR, protected silver mirrors were used in the VIS range.
The Kramers-Kronig analysis of the reflectivity spectra was performed in two stages. For the initial transformation, the measured spectra were extrapolated to infinite frequency using first the room-temperature measurements on P015 up to cm-1 and then the standard free-electron behavior, . Using the room-temperature data from one of the samples at these high frequencies is justified by the fact that has neither temperature nor doping-level dependence at cm-1, see Fig. 2. At this stage, the zero-frequency extrapolations were made using the Hagen-Rubens relation, , in the normal (metallic) state and in the superconducting state. The optical conductivity spectra, , obtained from this initial Kramers-Kronig transformation were subsequently fitted together with the measured using the Drude-Lorentz model discussed below. For the final Kramers-Kronig transformation, the free-electron behavior at and the low-frequency extrapolations of were replaced by the results obtained from this fit. The experimental data below 200 cm-1 were moderately smoothed prior to the initial transformation to avoid excessive noise in the optical conductivity at low frequencies.
III Resistivity and magnetic susceptibility
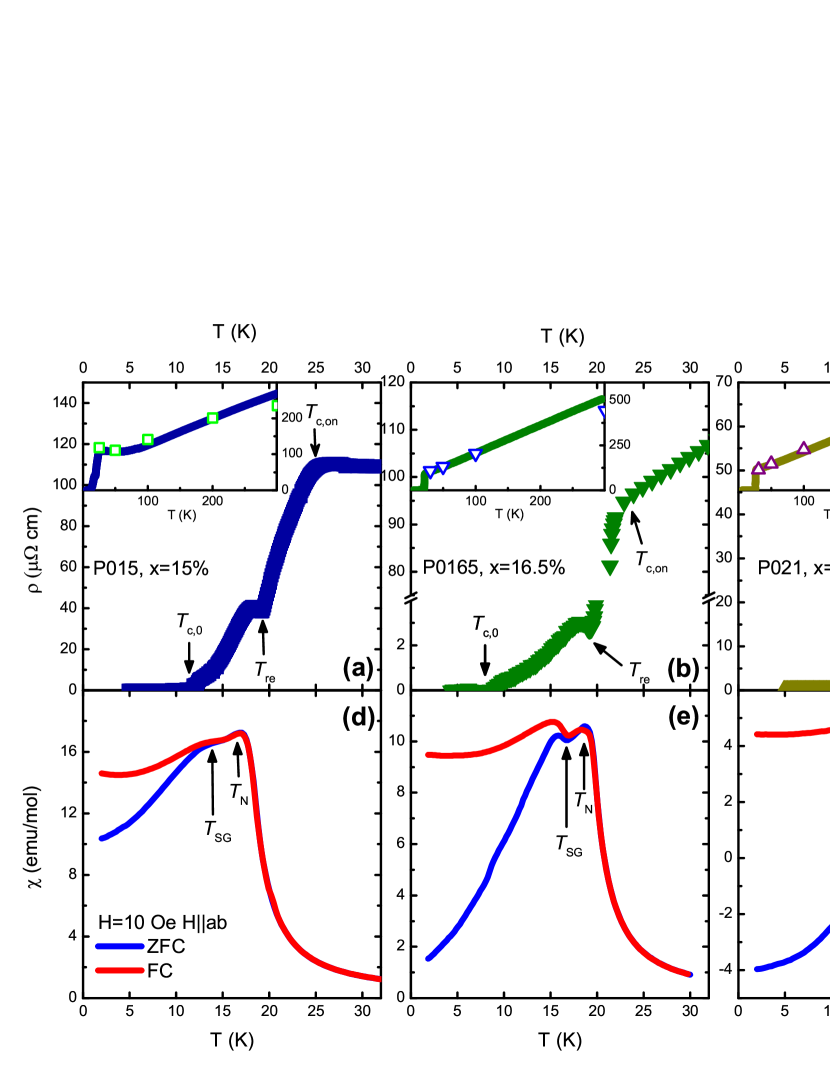
Fig. 1 shows temperature variation of the in-plane resistivity and the molar magnetic susceptibility for the samples investigated. At high temperatures, all three samples exhibit resistivity linear in temperature. For samples P0165 and P021, this linearity persists down to the onset of superconductivity. For P015, however, the resistivity levels off below 75 K and stays constant until superconductivity sets in. Such behavior of resistivity in P015 is reminiscent of resistivity in strongly underdoped EuFe2(As1-xPx)2, where the spin-density-wave (SDW) ordering of the Fe2+ moments is responsible for the leveling off the curve Jeevan2011 . According to Ref. Jeevan2011 , the doping level of the crystal and the temperature, where the leveling-off happens, appear to be too high to make the SDW-formation scenario probable. A detailed transport study of EuFe2(As1-xPx)2 under hydrostatic pressure Tokiwa2012 puts the P015 sample in a range of the phasediagram where the SDW transition still appears in the temperature range where we observe the anomaly. However, in contrast to Ref. Tokiwa2012 we cannot identify any discontinuity in the resistivity of P015, that could be assigned to a SDW transition.
As one can see from the panels (a-c) of Fig. 1, the three samples show onsets of superconductivity at K, K, and K, respectively.
Both specimens, P015 and P0165, have a rather broad superconducting transition affected by a pronounced resistivity re-entrance around K. This re-entrant resistivity is a well-known phenomenon for Eu-based 122 iron pnictides; it stems from ordering of the Eu2+ moments at K, which has no significant doping dependence for underdoped and superconducting samples Zapf2013 ; Jiao2012 ; Cao2012 . The P021 sample exhibits the highest and reaches zero resistance at 25 K, i.e. well above the Eu-ordering temperature. Thus, superconductivity is fully developed at 19 K and no re-entrance of resistivity is observed. A summary on the transition temperatures, resistivity values at 300 K and the residual resistivity ratios (RRR) for the investigated samples is given in Table 1.
Panels (d-f) of Fig. 1 display the results of the in-plane magnetization measurements, performed in the static (dc) mode. All three samples exhibit a complex magnetic behavior, which is typical for the Eu-122 family Zapf2011 ; Zapf2013 ; Jeevan2011 . In the case of samples P015 and P0165, two clear humps can be resolved in the zero-field-cooled (ZFC) and field-cooled (FC) curves. It has been shown, that the feature at can be assigned to the magnetic ordering of the Eu2+ moments with strong ferromagnetic component out of plane Nandi2014 ; Zapf2011 ; Zapf2013 . The dip at preceding the second hump is identified as a transition to an in-plane glass-like behavior of the Eu spins Zapf2013 .
Although according to Figs. 1 (d-f) a negative in-plane signal, typical for diamagnetism, is only seen in P021, we are confident that bulk superconductivity develops in all three samples. Measurements of the static magnetic susceptibility with the field applied perpendicular to the ab-plane (i.e. when the screening currents flow within this plane) do show a strong diamagnetic signal also in the samples P015 and P0165 (not displayed). Furthermore, it was demonstrated recently that P0165 exhibits a strong diamagnetic signal in the measurements of the in-plane dynamic magnetic susceptibility with a large constant magnetic field applied to suppress the ordering of the Eu2+ moments Zapf2013 .
IV Optics: the normal state
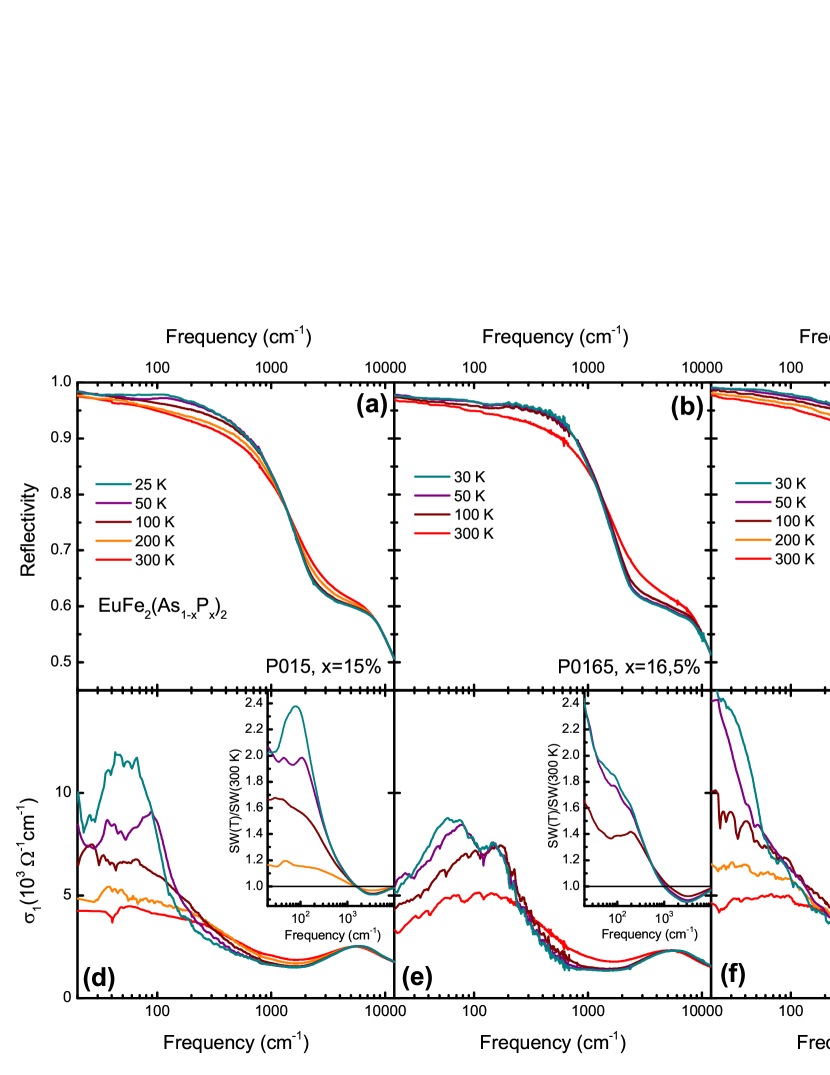
Panels (a-c) of Fig. 2 display the normal-state in-plane reflectivity of the investigated samples. All three compounds demonstrate a qualitatively similar temperature evolution of . The reflectivity in the FIR range increases with lowering temperature, indicating the metallic nature of our samples. Oppositely, the reflectivity at MIR frequencies ( cm-1) decreases as temperature goes down. This behavior is usually ascribed to electron correlations arising from the Hund’s-rule coupling of electrons Haule2009 ; Medici2011 . For all three crystals, there is a narrow region of frequencies (around cm-1) where is nearly temperature independent. Apart from these common features, there is one important difference between the reflectivity spectra of the samples: while the FIR reflectivity is monotonic in frequency at any temperature for P021, the curves of the two other samples exhibit a non-monotonic frequency behavior at K for P0165 and at for P015.
The real part of the optical conductivity, , obtained via the Kramers-Kronig transformation, is shown in the bottom panels of Fig. 2. The non-monotonic FIR reflectivity in P015 and P0165 manifest itself in as very broad modes dominating the FIR conductivity. As one can see from Fig. 2, the development of the FIR mode has no systematic doping dependence. Thus, we can conclude that the appearance of the modes is a sample-related issue. In case of P015 we can speculate wether the FIR anomaly below K is due to a possible SDW transition discussed for this sample in the previous section. However, comparing the spectra to previous optical studies on electron or hole underdoped BaFe2As2 that clearly show a SDW transition, we notice that below T a common feature is a pile up of spectral weight (SW) at approximately cm-1 while at lower frequencies the spectra get suppressed, irrespective of doping type or level Nakajima2010 ; Nakajima2012 ; Dai2012 . Hence, the mismatch in energy scale of our FIR feature together with the absence of any sharp feature in the resistivity in Fig. 1 (a) enables us to conclude, that this FIR peculiarity in P015 is not related to a SDW ordering. In case of the P0165 sample, the same argument holds. We want to point out that the observation of similar modes in the FIR in iron pnictides is by far not exceptional. There are reports of FIR modes in hole-doped Kwon2012 ; Dai2012 , and electron-doped Ba- Lobo2010 ; VanHeumen2009 , even in the parent compound Charnukha2013 . For all these reports we can not see a systematic doping level dependence and there are also reports where any comparable feature is absent (e.g. Ref.’s Barisic2010 ; Dai2013a ; Nakajima2010 ). Even though the interpretation of these modes range from pseudogap to low lying interband transitions, we find, that due to the non-systematic appearance, localization of itinerant carriers induced by impurities Anderson1958 is the most probable origin of the modes, as already suggested in Refs. Lobo2010 ; Charnukha2013 ; Cheng2011 .
Typical metallic behavior of the optical conductivity, i.e. a monotonic narrowing of the zero-frequency-centered Drude-like mode with decreasing temperature, is clearly visible only for sample P021. In P0165 and P015, the temperature development of the Drude response is perturbed by the localization modes. Nevertheless, the zero-frequency limit of the optical conductivity, , nicely follows the dc data for all the samples at any temperature, as it can be seen from the inserts of Figs. 1 (a-c).
We now calculate the frequency-dependent spectral weight defined as:
| (1) |
For temperatures in the normal state, the spectral weight normalized to the spectral weight at K is displayed in the insets of Figs. 2 (d-f). The general trends of the spectral-weight behavior are the same for all three samples, although the localization modes affect the normalized spectral weight at low frequencies, where it stays above 1 and is maximal at the lowest temperatures. In the MIR range, the temperature-dependent spectral weight is below its room-temperature values; the lower the temperature, the more pronounced the losses are. After passing a minimum at cm-1, the normalized spectral weight increases again. Only at frequencies above cm-1 the spectral weight becomes eventually conserved (within an uncertainty of %) for all the samples. The presence of the spectral-weight transfer up to such high energies is an important feature of iron pnictides and is ascribed to correlation effects, e.g. to the Hund’s rule correlations mentioned above Barisic2010 ; Wang2011 ; Schafgans2012 . In this regard, the members of the Eu-122 family, investigated in this work, behave very similarly to many other pnictides.
In order to get insight in the mechanisms contributing to the frequency-dependent optical response, one needs to decompose the measured spectra into a number of simple terms. We fitted our experimental spectra in a standard way – by a sum of Drude and Lorentz terms. For the complex optical conductivity, the model reads as Dressel2002 :
| (2) |
Here is the plasma frequency of each term, is the resonance frequency of each Lorentz term, and denotes the scattering rates of free carriers in the case of Drude terms and introduces a damping for each Lorentz oscillator.
Because of the multiband nature of iron pnictides, there are many ways to decompose their optical spectra, as it has been already discussed e.g. in Ref. Zapf2015 . We use a model that captures all major spectral features, but still keeps the number of free parameters as small as possible. It has been shown that a Drude-Lorentz model with two Drude components provides an adequate description for the optical response of many iron pnictides Wu2010b ; Wu2009 . For the 122 family, it is well established, that one of the two Drude components is rather broad in frequency (large ) and the other one is quite narrow (small ). Sometimes, the broad component is replaced by an overdamped Lorentzian. The broad term is usually associated with the hole pockets of the Fermi surface, while the narrow Drude component is normally assigned to the electron pockets Barisic2010 ; Zapf2015 ; Moon2010 ; Nakajima2010 ; Dai2013a . This assignment is based on the differences in scattering rates of the two carrier types found in pnictides by Hall measurements: holes posses a rather large , while electrons scatter much less frequently, i.e. their is smaller Fang2009 . Thereafter, we abbreviate the broad and the narrow Drude components as BD and ND, respectively. The fit parameters of the Drude components for the lowest normal-state temperatures of all three samples are given in Table 1.
In addition to the two Drude terms, a number of Lorentzians are necessary to fit the experimental spectra properly. We use a broad Lorentzian (MIRL) to describe the flat MIR background, which was previously reported in a number of 122 compounds and which is believed to be due to an interband-transition band located at around cm-1 Zapf2015 ; Marsik2013 . Another Lorentz term, marked as “HUND”, is used to fit a pronounced broad interband-transition band located around cm-1. Both bands display a strong temperature dependence, which is believed to stem from a strong renormalization by Hund’s-rule coupling effects Charnukha2014 . Additionally, we need to use a few temperature-independent modes at higher frequencies. Let us note, that the optical conductivity was fitted together with the measured reflectivity in order to provide the most consistent description of the experimental spectra.
For sample P021, the described model is sufficient for an adequate description of the experiment [see Fig. 3 (c)]. For the two other samples, we had to introduce more terms to describe the localization bands. In the case of sample P015, one additional Lorentzian (LOC) in the FIR range was sufficient [Fig. 3 (a)]. For P0165, we had to introduce two Lorentzians (LOC and LOC2) and to omit the BD term at all temperatures [Fig. 3 (b)], as otherwise no reasonable description was possible Note1. This indicates that localization effects are particularly strong in P0165.
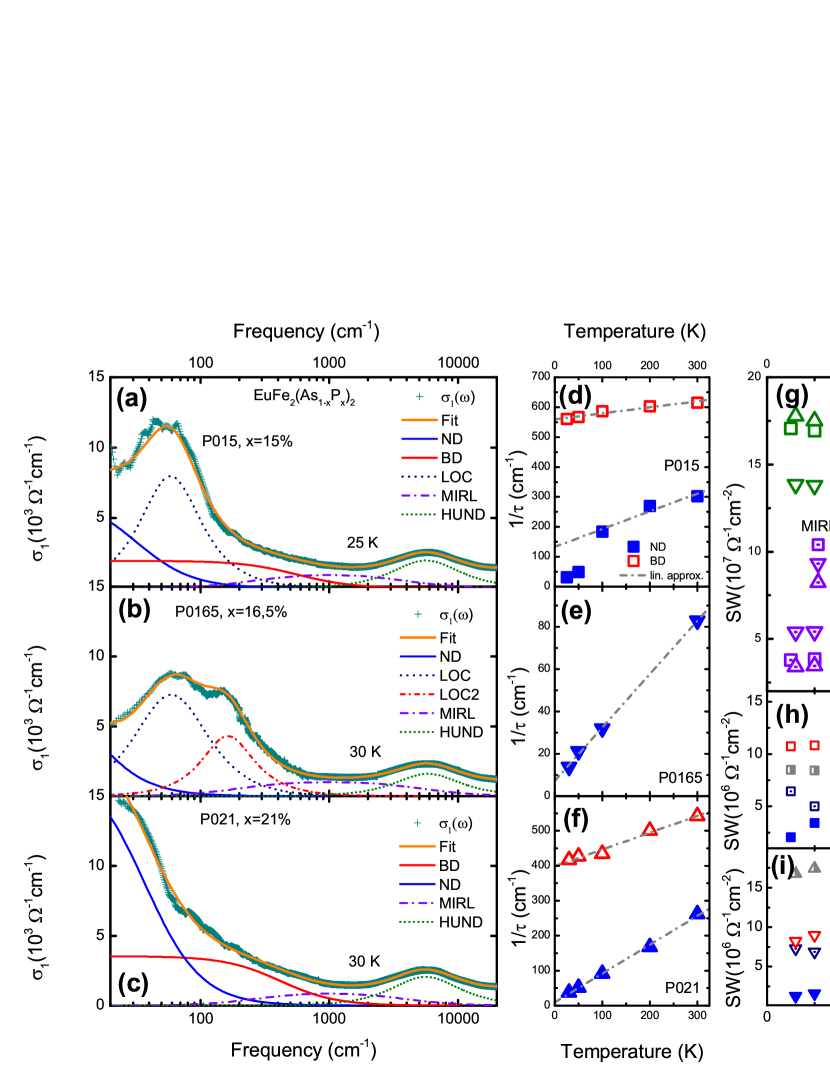
We now discuss the temperature changes in the single terms of Eqn. 2. First, we discuss the scattering rates of the Drude terms shown in the middle panels of Fig. 3. In P021, the scattering rate of both, broad and narrow, Drude terms is linear in temperature. The same behavior is visible in the only (narrow) Drude component of P0165. This observation together with the -linear resistivity provides a strong evidence for non-Fermi-liquid behavior which might be caused by strong magnetic fluctuations around a possible QCP beneath the superconducting dome. Indications for such QCP have been observed by other experimental methods Maiwald2012 ; Cao2010 . Also, a similar -linear scattering rate has been reported in hole and electron doped Ba-based pnictides of the 122 family Dai2013a ; Lee2015 , yet only for the ND component. The reason for the fact that we also observe -linear scattering for the BD component possibly is related to the difference in substitution method. Hence, it would be interesting to compare our finding to an equivalent study on BaFe2(As1-xPx)2. However, to our knowledge there is to date no temperature dependent optical investigation on P-substituted Ba-122 that utilizes the Drude-Lorentz model to decompose the spectra.
In sample P015, the -linear scattering rate at K is only observed for the BD component, while of the ND component is not linear at K. At K, the localization mode (LOC) appears in the conductivity spectra and obviously affects the temperature behavior of the ND scattering rate: of the ND term collapses, implying that the carriers scatter less. The resistivity of this sample shows a flattening at low temperatures, as seen in the inset of Fig. 1 (a). Since with being the carrier density, and since the BD scattering rate is linear in temperature, the simultaneous flattening of the curve and collapsing of the ND term can not be consistently understood, if remains constant. However, in our case is not constant, because some electrons get localized. As one can see from Fig. 3 (h), the sum of the spectral weights of the ND and LOC terms remains basically constant as a function of temperature. The spectral weight and therefore the number of carriers contributing to the BD term are also temperature independent. Thus, it is evident that only the carriers from the ND term are affected by the localization effects.
It is likely that the remaining free carriers of the ND term scatter less because the contribution of the electron-electron interactions to the scattering processes becomes reduced with decreasing the number of free carriers. Alternatively, the reduction of the ND scattering rate below K can be explained as if the localization mode and the ND term stem from two different electron bands, which can not be distinguished at elevated temperatures.
In sample P0165, the spectral weight developments in the FIR region (Fig. 3 (i)) reveal a spectral-weight transfer to lower frequencies (LOC2 to LOC) with decreasing temperature, reminiscent of a Drude behavior with collapsing scattering rate. It is important to note, that the spectral weight of the ND term and of the sum of the spectral weights of the localization modes stay constant as a function of temperature. The LOC localization mode in P0165 (as well as in P015) softens with decreasing temperature, while the center frequency of the LOC2 mode stays the same at all temperatures.
| Quantity | P015 | P0165 | P021 |
|---|---|---|---|
| K (cm) | 268 | 507 | 351 |
| RRR | 2.5 | 5.3 | 4.2 |
| (K) | 25 | 22 | 27 |
| (K) | 11.5 | 9 | 25 |
| BD (cm | 8079 | - | 9404 |
| BD (cm | 560 | - | 416 |
| ND (cm | 3540 | 2767 | 6235 |
| ND (cm | 32 | 14 | 37 |
| (cm | 56 ( 5) | - | 63 ( 3) |
| (cm | 12( 5) | - | 11( 3) |
| (nm) | 355 | - | 345 |
Thus, all three samples demonstrate at least one Drude band with a directly observable -linear scattering rate. This signals the importance of electron-electron interactions in Eu-based pnictides of the 122 family. The localization effects in P015 and P0165 samples strongly affect the optical conductivity and possibly mask the linearity of in other Drude bands. The question remains, why the resistivity of the P015 sample only (Fig. 1 (a)) is affected by the localization effects. This can be explained considering the fact, that the localization effects in P015 appear to be moderate and only affect the carriers when their thermal energy falls below K. In P0165, however, the localization of a part of the carriers persists up to room temperature, while the remaining itinerant carriers follow the observed NFL behavior.
In the MIR and NIR spectral ranges, all three samples display a spectral-weight transfer from the MIRL interband transition to the HUND mode upon cooling (Fig. 3 (g)). This is a general observation in iron pnictides and is usually associated to electron correlations originating from the Hund’s-rule coupling between itinerant and localized electrons Wang2011 ; Schafgans2012 .
V Optics: superconducting state
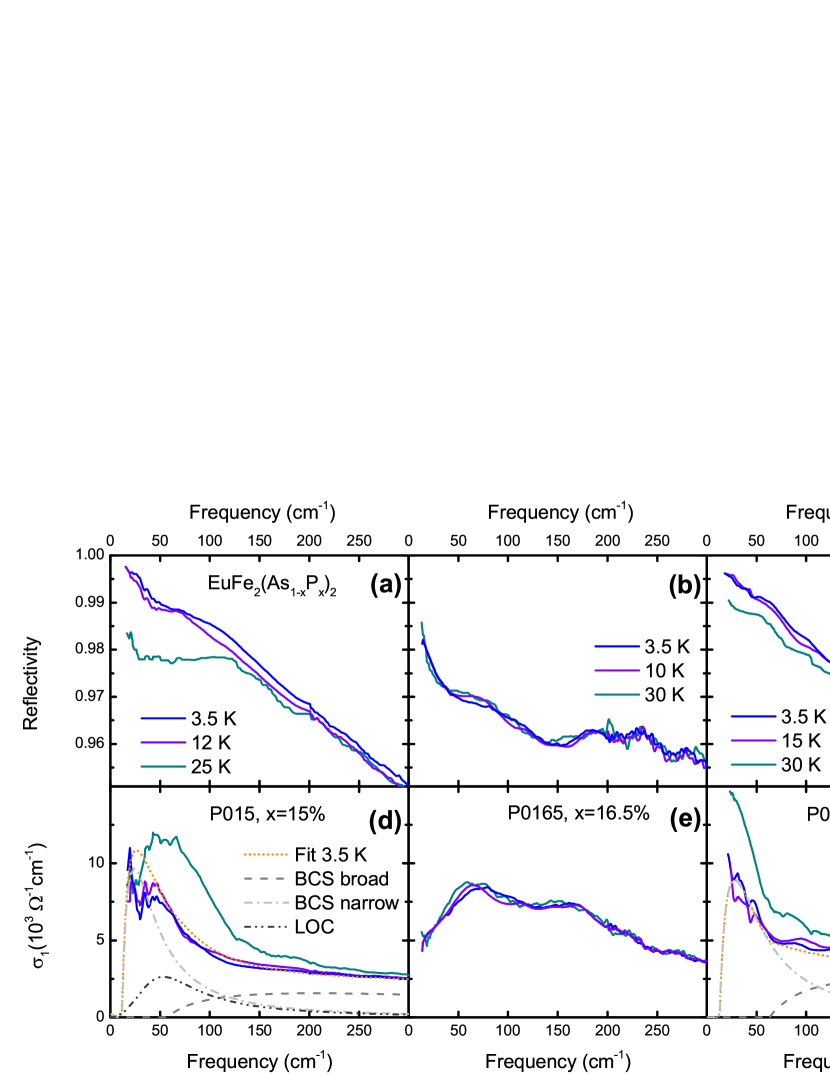
In Fig. 4 (a-c) we show the reflectivity of the investigated samples for two temperatures below the superconducting transition and one temperature right above . Unlike in the reflectivity spectra of superconducting EuFe2(As0.82P0.18)2 previously published in Ref.Wu2011 Note2, we do not see any sharp upturns in the reflectivity, which would indicate positions of dirty-limit isotropic superconducting gaps Tinkham ; Dressel2002 . Neither a full 100% reflectivity is observed. Consequently, the conductivity spectra do not show any sharp gap-like edge either, as seen in Fig. 4 (d-f).
For homogenous single-phase superconductors, there are two possible reasons why no clear signatures of a superconducting gap are observed. The first option is a strong gap anisotropy, preferably with nodes: optical transitions of the nodal quasiparticles do not allow the gap features to manifest themselves in the optical conductivity Basov2005 , which is a momentum-averaged response. The second possibility is superconductivity in the clean limit. In this case, the scattering rate of the quasiparticles is much smaller than the superconducting gap, . As a consequence, at frequencies around is very close to zero already in the normal state, thus no gap feature can be detected in the optical-conductivity spectra in the superconducting state Kamaras1990 . Below, we argue that realization of both, the clean-limit superconductivity and the gap anisotropy, are likely in EuFe2(As1-xPx)2. Let us note that our optical measurements, performed above and below , show that the ordering of the Eu magnetic moments at does not affect the optical conductivity, in agreement with previous optical studies on the parent compound Wu2009 ; Zapf2015 ; Moon2010 . Thus, influence of the Eu-moments ordering on the optical-gap feature is very unlikely.
Although a full multiband Eliashberg analysis is the most adequate approach for fitting the optical conductivity of iron pnictides in the superconducting state Charnukha2011 , application of this method requires advanced theoretical methods and goes beyond our capability. During the last years, it has been shown by different groups Wu2010b ; Kim2010 ; Maksimov2011a ; Dai2013b that applying a relatively simple model Zimmermann1991 , which parameterizes the optical response of a BCS superconductor, is often sufficient in order to get a rough estimate for the magnitude of the superconducting gap(s) in pnictides.
Even though we do not observe any clear gap features we can use this model to fit the spectrum of sample P021 in the superconducting state with the constraint, that the plasma frequencies and scattering rates of the BCS terms, as well as all parameters of the Lorentz contributions, stay roughly the same as in the normal state just above the superconducting transition. In this sample, the optical response of free carriers is not masked by the appearance of localization modes, thus the analysis is relatively straightforward. Two BCS terms, each replacing a normal-state Drude term, were utilized in this fit, as displayed Fig.4 (f). We obtained the gap values of cm-1 and cm-1 for the two BCS terms, which replaced the broad and narrow Drude terms, respectively.
For the larger gap, we obtain , which is close to the BCS value. For the small gap, this ratio is below . This indicates that the isotropic gap is likely not a relevant approach and points towards anisotropy of the smaller gap (a moderate anisotropy of the larger gap is also possible). Since the BCS term with the large / small gap in the superconducting state corresponds to the broad / narrow Drude term in the normal state, we can interpret our data in terms of an (almost) isotropic gap on the hole pockets and a highly anisotropic (or nodal) gap on the electron pockets of the Fermi surface. This is in agreement with multiple reports on the sister system BaFe2(As1-xPx)2 Shibauchi2014 ; Hashimoto2010 ; Nakai2010 ; Ishikado2011 ; Yamashita2011 , as well as with theoretical predictions for P-substituted iron pnictides Thomale2011 ; Chubukov2009 .
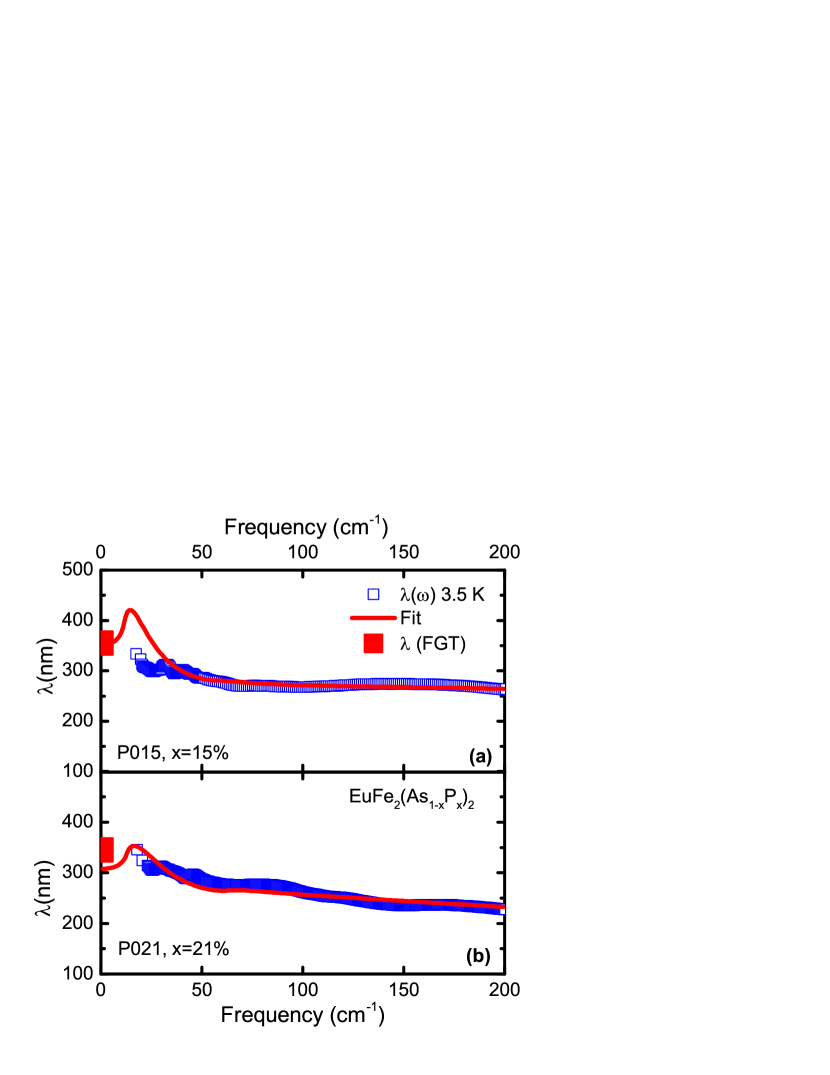
To examine whether our samples are in the clean or dirty limit, it is useful to calculate the frequency-dependent penetration depth, . The penetration depth for sample P021 at K is shown in Fig. 5 (b). is basically flat, with a small gradual increase towards low frequencies. This is indicative for clean-limit superconductivity Lobo2015 and consistent with reports on BaFe2(As1-xPx)2 Moon2012 . The model , computed from our BCS fit, describes the experimental points fairly accurately, see Fig. 5.
Alternatively, one can obtain the penetration depth from the temperature evolution of the spectra. The occurrence of the superfluid condensate implies a transfer of the spectral weight from finite frequencies to a function in , representative of the infinite dc conductivity in the superconducting state. As the measured optical has no access to zero frequency, the value of its integral drops when the superfluid forms. The difference between the spectral weights in the normal and superconducting states is directly related to the superfluid density (the Ferell-Glover-Tinkham (FGT) sum rule Tinkham ; Dressel2002 ):
| (3) |
and allows calculation of the penetration depth via . The cutoff frequency needs to be chosen such, that all the spectral weight transferred to the peak is captured. We find to be a reasonable value for this purpose. Calculations using Eqn. 3 provide a penetration depth of nm, which agrees very well with the value obtained from , see Fig. 5, and thus, shows the consistency of our analysis.
Let us now turn to samples P015 and P0165. In these specimens, the behavior of the reflectivity [Fig. 4 (a, b)] and the optical conductivity [Fig. 4 (d, e)] in the superconducting state is different as compared to sample P021, because of the appearance of the localization mode(s) at low frequencies. While in P0165 there is no clear difference between the optical responses in the normal and superconducting state, in P015 the LOC mode appears to be suppressed and shifted towards lower frequencies below . Again, a clear gap edge is not observed.
In order to perform a meaningful analysis of the penetration depth in P015, it is necessary to subtract the contribution of the localization mode from before calculating . When we do so, we obtain the low-frequency of P015 to be rather similar to of P021, as one can see from Fig. 5. The penetration depth, calculated using the FGT sum rule yields now nm, slightly larger than in P021, but in good agreement with the frequency-dependent , see Fig. 5 (a) .
For P015, the fit with the BCS terms in the superconducting state requires a spectral-weight transfer from the LOC mode to the ND component as temperature decreases and provides and , which is very similar to gap values in P021 (see Fig. 4 (d)). Also similarly to P021, the penetration depth, obtained from the BCS fits, describes the experimental very well, as shown in Fig. 5.
Thus, we can conclude that the optical responses of itinerant carriers in samples P015 and P021 are very similar to each other; the differences in the doping level do not affect significantly the values of the superconducting gaps. The only major difference between these two samples, seen in the optical response, is the localization mode, which is present in P015 and absent in P021. In the sample with an intermediate doping level, P0165, the absorption due to localization effects is even stronger than in P015. This absorption (modeled above with two Lorentzian terms) completely prevents the observation of any superconductivity-induced changes in the optical spectra of P0165, even though bulk superconductivity was confirmed in this sample by different magnetization measurements, as discussed in Sec. 3. We pointed out above, the non-systematic behavior of the FIR bands in our EuFe2(As1-xPx)2 samples as a function is evident for extrinsic character of the FIR absorption bands. If the density of localized carriers is not very large (the case of sample P015), the optical response remains to be primarily dominated by itinerant carriers. In the case of very impure/disordered samples (sample P0165), the optical response becomes fully determined by localized carriers. Looking on the entire set of our experimental data, we can not exclude that sample P0165 has at least two phases, only one of which is superconducting. The same might be true for sample P015, but the fraction of the superconducting phase is surely much larger in this sample.
VI Conclusions
We performed a detailed study of broadband optical response of single-crystalline superconducting EuFe2(As1-xPx)2 with %, %, and %. The former two samples show moderate (%) to strong (%) impurity-localization effects, while the later (%) appears to be very pure. All of the samples exhibit superconductivity with onsets at comparable temperatures, basically independent of the doping level and appearance of the localization effects. The response of the itinerant carriers in the normal state can be generally best described by two Drude components, which might be related to the hole and electron pockets of the Fermi surface, similarly to other pnictides Charnukha2014 ; Wu2010b . We were able to uncover a linear in temperature scattering rate for at least one of the two Drude terms in each of the samples. In the pure %-doped sample, the linearity is apparent for both bands. In two other samples, the linearity is (partly) masked by strong FIR modes due to the localization effects. This linearity (as well as the linear temperature dependence of dc resistivity) points towards a non-Fermi-liquid state in EuFe2(As1-xPx)2, which leads to speculations wether a QCP exists beneath the superconducting dome, as it is evident in the sister compound BaFe2(As1-xPx)2.
Analysis of the frequency-dependent optical spectra in the superconducting state allows us to conclude that EuFe2(As1-xPx)2 is likely a clean-limit superconductor with two gaps: a smaller anisotropic (or nodal) gap on the electron portion of the Fermi surface and a larger isotopic (or slightly anisotropic) gap on the hole pockets. This is in agreement with theoretical predictions as well as with experimental observations made in other P-substituted 122 iron pnictides.
VII Acknowledgements
We are grateful to G. Untereiner, C. Kamella and E. Rose for technical support. We thank U. S. Pracht, S. Jiang and D. Wu for helpful discussions. This project was funded by the DFG SPP 1458.
References
- (1) C. F. Miclea et al., Phys. Rev. B 79, 212509 (2009).
- (2) Z. Ren et al., Phys. Rev. Lett. 102, 137002 (2009).
- (3) C. J. van der Beek et al., Phys. Rev. Lett. 105, 267002 (2010).
- (4) T. Shibauchi, A. Carrington, and Y. Matsuda, Annu. Rev. Conden. Ma. P. 5, 113 (2014).
- (5) K. Hashimoto et al., Science 336, 1554 (2012).
- (6) K. Hashimoto et al., Phys. Rev. B 81, 220501 (2010).
- (7) S. Jiang et al., Phys. Rev. B 80, 184514 (2009).
- (8) S. Zapf et al., Phys. Rev. B 84, 140503 (2011).
- (9) S. Zapf et al., Phys. Rev. Lett. 110, 237002 (2013).
- (10) S. Zapf et al., Phys. Rev. Lett. 113, 227001 (2014).
- (11) S. Nandi et al., Phys. Rev. B 89, 014512 (2014).
- (12) G. Cao et al., J. Phys. Condens. Matter 23, 464204 (2011).
- (13) H. S. Jeevan, D. Kasinathan, H. Rosner, and P. Gegenwart, Phys. Rev. B 83, 054511 (2011).
- (14) H.-A. Krug von Nidda et al., Phys. Rev. B 86, 094411 (2012).
- (15) D. N. Basov, R. D. Averitt, D. van der Marel, M. Dressel, and K. Haule, Rev. Mod. Phys. 83, 471 (2011).
- (16) A. Charnukha, J. Phys. Condens. Matter 26, 253203 (2014).
- (17) Y. Tokiwa, S.-H. Hübner, O. Beck, H. S. Jeevan, and P. Gegenwart, Phys. Rev. B 86, 220505 (2012).
- (18) W.-H. Jiao et al., J. Phys. Conf. Ser. 400, 022038 (2012).
- (19) G.-H. Cao et al., J. Phys. Conf. Ser. 391, 012123 (2012).
- (20) S. Nandi et al., Phys. Rev. B 90, 094407 (2014).
- (21) K. Haule and G. Kotliar, New J. Phys. 11, 025021 (2009).
- (22) L. de Medici, J. Mravlje, and A. Georges, Phys. Rev. Lett. 107, 256401 (2012).
- (23) M. Nakajima et al., Phys. Rev. B 81, 104528 (2010).
- (24) M. Nakajima et al., Phys. Rev. Lett. 109, 217003 (2012).
- (25) Y. M. Dai et al., Phys. Rev. B 86, 100501 (2012).
- (26) Y. S. Kwon et al., New J. Phys. 14, 063009 (2012).
- (27) R. P. S. M. Lobo et al., Phys. Rev. B 82, 100506 (2010), 1007.3761.
- (28) E. van Heumen et al., Europhys. Lett. 90, 37005 (2010).
- (29) A. Charnukha et al., Physical Review B 88, 184511 (2013).
- (30) N. Barišić et al., Phys. Rev. B 82, 054518 (2010).
- (31) Y. M. Dai et al., Phys. Rev. Lett. 111, 117001 (2013).
- (32) P. W. Anderson, Phys. Rev. 109, 1492 (1958).
- (33) B. Cheng et al., Phys. Rev. B 83, 144522 (2011).
- (34) N. L. Wang et al., J. Phys. Condens. Matter 24, 294202 (2012).
- (35) A. A. Schafgans et al., Phys. Rev. Lett. 108, 147002 (2012).
- (36) M. Dressel and G. Grüner, Electrodynamics of Solids (Cambridge University Press, Cambridge, UK, 2002).
- (37) S. Zapf et al., C. R. Phys. 17, 188 (2015).
- (38) D. Wu et al., Phys. Rev. B 81, 100512 (2010).
- (39) D. Wu et al., Phys. Rev. B 79, 155103 (2009).
- (40) S. J. Moon et al., Phys. Rev. B 81, 205114 (2010).
- (41) L. Fang et al., Phys. Rev. B 80, 140508 (2009).
- (42) P. Marsik et al., Phys. Rev. B 88, 180508 (2013).
- (43) J. Maiwald, H. S. Jeevan, and P. Gegenwart, Phys. Rev. B 85, 024511 (2012).
- (44) G. Cao et al., Physica C 470, S458 (2010).
- (45) S. Lee et al., Sci. Rep. 5, 12156 (2015).
- (46) W. Zimmermann, E. Brandt, M. Bauer, E. Seider, and L. Genzel, Physica C 183, 99 (1991).
- (47) D. Wu, G. Chanda, H. S. Jeevan, P. Gegenwart, and M. Dressel, Phys. Rev. B 83, 100503 (2011).
- (48) M. Tinkham, Introduction to Superconductivity (McGraw-Hill, New York, 1996).
- (49) D. N. Basov and T. Timusk, Rev. Mod. Phys. 77, 721 (2005).
- (50) K. Kamarás et al., Phys. Rev. Lett. 64, 84 (1990).
- (51) A. Charnukha et al., Phys. Rev. B 84, 174511 (2011).
- (52) K. W. Kim et al., Phys. Rev. B 81, 214508 (2010).
- (53) E. G. Maksimov et al., Phys. Rev. B 83, 140502 (2011).
- (54) Y. M. Dai et al., Europhys. Lett. 104, 47006 (2013).
- (55) Y. Nakai et al., Phys. Rev. B 81, 020503 (2010).
- (56) M. Ishikado et al., Phys. Rev. B 84, 144517 (2011).
- (57) M. Yamashita et al., Phys. Rev. B 84, 060507 (2011).
- (58) R. Thomale, C. Platt, W. Hanke, and B. A. Bernevig, Phys. Rev. Lett. 106, 187003 (2011).
- (59) A. V. Chubukov, M. G. Vavilov, and A. B. Vorontsov, Phys. Rev. B 80, 140515 (2009).
- (60) R. P. S. M. Lobo et al., Phys. Rev. B 91, 174509 (2015).
- (61) S. J. Moon et al., Phys. Rev. Lett. 109, 027006 (2012).