Vol.0 (200x) No.0, 000–000
22institutetext: University of Chinese Academy of Sciences, Beijing 100049, China
33institutetext: Tianjin Astrophysics Center, Tianjin Normal University, Tianjin 300387, China; E-mail: cainahao@gmail.com
The Evolution of Advanced Merger (U)LIRGs on the Color-Stellar Mass Diagram
Abstract
Based on a sample of 79 local advanced merger (adv-merger) (U)LIRGs, we search for the evidence of quenching process by investigating the distributions of the star formation history indicators (EW(H), EW(HA) and D) on the NUV-r color-mass and SFR- diagrams. The distributions of the EW(H) and D on the NUV-r color-mass diagram show clear trends that at a given stellar mass, galaxies with redder NUV-r colors have smaller EW(H) and larger D. The reddest adv-merger (U)LIRGs close to the green valley have D mostly. In addition, in the SFR- diagram, as the SFR decreases, the EW(H) decreases and the D increases, implying that the adv-merger (U)LIRGs on the star formation main sequence have more evolved stellar populations than those above the main sequence. These results indicate that a fraction of the adv-merger (U)LIRGs have already exhibited signs of fading from the starburst phase and that the NUV-r reddest adv-merger (U)LIRGs are likely at the initial stage of post-starbursts with age of Gyr, which is consistent with the gas exhausting time-scales. Therefore, our results offer additional support for the fast evolutionary track from the blue cloud to the red sequence.
keywords:
galaxies: evolution — galaxies: formation — galaxies: interactions — galaxies: starburst — infrared: galaxies1 INTRODUCTION
Since the discovery of the color bimodality on the color-magnitude and the color-stellar mass (color-mass, hereafter) diagrams based on the Sloan Digital Sky Survey (SDSS) (Kauffmann et al. 2003b; Baldry et al. 2004, 2006) as well as on high redshift survey samples (Bell et al. 2004; Faber et al. 2007; Ilbert et al. 2010), there are mounting works to investigate the evolutionary pathways from the blue cloud of star-forming galaxies to the red sequence of quiescent galaxies. The evolution from the blue cloud to the red sequence is suggested to be results of star formation being quenched (e.g., Faber et al. 2007). According to the quenching time-scales, the evolutionary tracks are classified into fast and slow modes (e.g., Schawinski et al. 2014; Yesuf et al. 2014). The fast track (with time-scales less than 1 Gyr) has been proposed to interpret the formation of high redshift compact massive quiescent galaxies (van Dokkum et al. 2008; Kriek et al. 2009; Barro et al. 2013; Muzzin et al. 2013; Marchesini et al. 2014). These studies show that the progenitors of local massive galaxies are heavily dust-extincted starburst galaxies that are triggered by gas-rich major mergers. Therefore, investigation of local gas-rich major mergers might shed light on the fast quenching process.
In the local universe, almost all ultraluminous infrared galaxies (ULIRGs; 111 is the integrated infrared luminosity between 8-1000 m.) and about half of luminous infrared galaxies (LIRGs; ) were found to be gas-rich interacting/merging galaxies (e.g. Sanders & Mirabel 1996; Wang et al. 2006; Kaviraj 2009). Therefore, nearby (U)LIRGs can serve as a proper local laboratory for studying the fast quenching process. Virtually, several recent works have made efforts to identify the role of local ULIRGs in the migration from the blue cloud to the red sequence. Chen et al. (2010) and Kilerci Eser et al. (2014) have investigated the positions of local ULIRGs in the g-r and u-r color-magnitude diagrams, respectively, without applying internal extinction corrections. They found that about half of the ULIRGs sample lie outside the 90% level number density contour, and some in the green valley or the red sequence. Most recently, Guo et al. (2016b) applied both Galactic and internal dust extinction corrections for an advanced merger (adv-merger) (U)LIRGs sample and found that adv-merger (U)LIRGs are blue and more massive than the blue cloud galaxies, with and of them outside the blue cloud on the u-r and NUV-r color-mass diagrams, respectively, implying that the adv-merger (U)LIRGs occupy a distinct region on the color-mass diagrams. In addition, the investigation of the locus of the adv-merger (U)LIRGs in the star formation rate (SFR)-stellar mass (SFR-) diagram showed that about three-fourths of the sample are above the star-forming main sequence, indicating that the majority of adv-merger (U)LIRGs are experiencing massive starbursts. Based on the estimates of gas exhausting time-scales, the authors suggested that the adv-merger (U)LIRGs are likely at the starting point of the fast evolutionary track.
As is well known, the equivalent width of HA absorption line (EW(HA)) and the 4000Å break (D) measured from optical spectra are powerful indicators of the recent star formation histories. A strong HA absorption line is a sign for a burst in the star formation history that ended about 0.1-1 Gyr ago, while the 4000Å break is an excellent age indicator for young star populations within 1 Gyr (Kauffmann et al. 2003b, 2003c). As a result, EW(HA) and D are often used to probe recent starbursts and distinguish star formation histories dominated by starbursts from a continuous mode (Kauffmann et al. 2003b; Goto 2007; Martin et al. 2007; Yesuf et al. 2014). In addition, the equivalent width of H, EW(H), is a measure of the current to past average SFR (e.g., Knapen & James 2009; Yesuf et al. 2014).
To explore the evolutionary link between starburst galaxies and post-starbursts, Yesuf et al. (2014) proposed a classification scheme to identify transiting post-starbursts, an intermediate stage between starbursts and post-starbursts, based on EW(H), EW(HA), D, UV and Wide-field Infrared Survey Explore (WISE; Wright et al. 2010) photometry. Guo et al. (2016b) employed this set of criteria and identified 12 transiting post-starbursts out of the entire sample of 89 adv-merger (U)LIRGs. It is also worth carefully investigating the distributions of the spectral features of EW(H), EW(HA), D on the color-mass and SFR-mass diagrams to search for evidence for possible evolutionary signs already shown in the adv-merger (U)LIRGs sample.
The paper is structured as follows. In Sections 2 we describe the sample selection and parameter estimations for our sample adv-mergers and control samples. In Section 3, we present our results and discussion. The main results are summarized in Section 4. Throughout this paper we adopt the Kroupa (2001) initial mass function and a cosmological model of , and .
2 SAMPLE SELECTION AND PARAMETER ESTIMATIONS
2.1 Sample
Our adv-merger (U)LIRGs sample is directly taken from Guo et al. (2016b). We refer the readers to that paper for a detailed description of the sample selection (see also Guo et al. 2016a). In the following, we briefly describe the selection procedures.
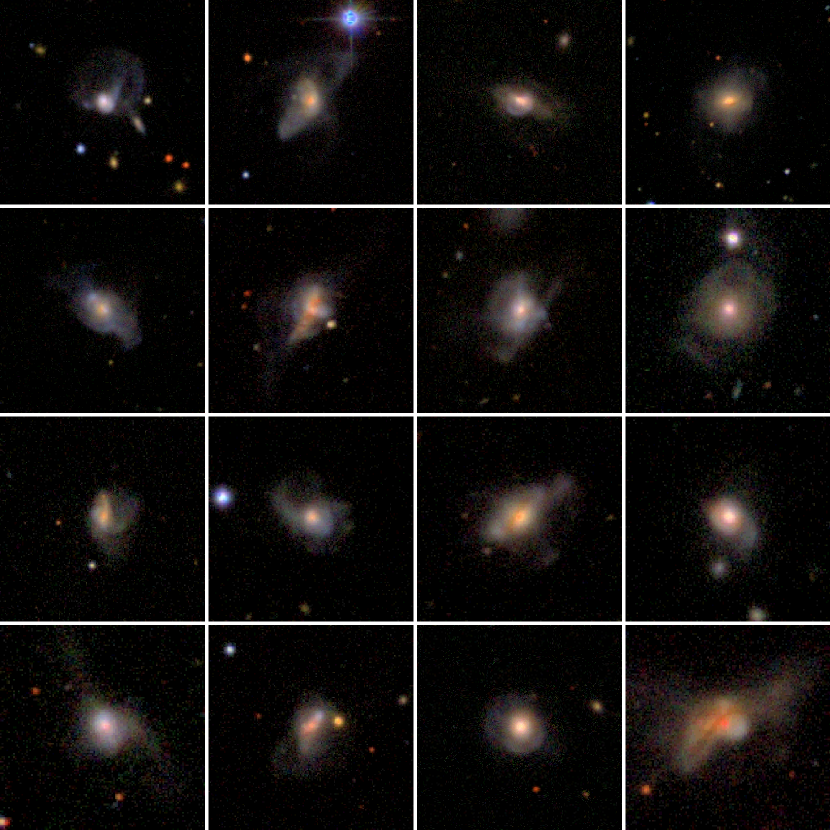
The parent (U)LIRGs sample in Guo et al. (2016b) was drawn from a cross-correlation analysis between the spectroscopic catalog of SDSS DR7 (York et al. 2000; Abazajian et al. 2009) and the Infrared Astronomical Satellite (IRAS) Point Source Catalog Redshift Survey (PSCz, Saunders et al. 2000), as well as a cross-identification between the IRAS 1 Jy ULIRGs sample (Kim & Sanders 1998) and the SDSS DR7 photometric catalog. We performed morphological classifications visually for the sub-sample of galaxies in the magnitude range of 222The magnitude restriction was not performed for the 1 Jy ULIRGs since they have obvious interacting or merging morphologies. after corrections for foreground Galactic extinction (Schlegel et al. 1998), to ensure both reliable morphological classifications and the spectroscopic observation completeness for SDSS galaxies (Fukugita et al. 2004; Kauffmann et al. 2003b). Note that galaxies classified as Seyfert I are removed from our sample, since the estimations for their extinctions, stellar masses and star formation rates are not reliable. Finally, there are 89 adv-mergers selected, which are in the late merging stage. For the purpose of this work, measurements of optical spectral indices are needed. Hence only the 79 adv-mergers with SDSS spectroscopic observations are included in this paper, among which 59 are LIRGs and 20 are ULIRGs. Figure 1 shows the true color images of 16 example adv-mergers.
Meanwhile, the control samples are also taken from Guo et al. (2016b) directly. For the study of the local color-mass relation, the control sample was selected from the Oh-Sarzi-Schawinski-Yi (OSSY) catalog (Oh et al. 2011)333 http://gem.yonsei.ac.kr/ksoh/wordpress, which provides internal extinction information (E(B-V)) from stellar continuum fits. By requiring the redshift range of and absolute magnitude mag, 53604 galaxies were obtained. The absolute magnitude constraint enables us to derive an approximately mass-limited sample as described in Schawinski et al. (2014). For investigating the SFR- relation of star-forming galaxies, the control sample has been retrieved from the SDSS DR7 in the redshift range of and luminosity range of , which consists of 152137 galaxies.
2.2 Parameters
The main purpose of this paper is to investigate the distributions of EW(H), EW(H) and D on the NUV-r color-stellar mass as well as the SFR-stellar mass diagrams. Therefore, apart from the estimates of the dust extinction corrected NUV-r colors, SFRs and stellar masses, as described in Guo et al. (2016b), optical spectral indices are also needed.
The estimations of the dust attenuation corrected NUV-r colors, SFRs and stellar masses have been described in Guo et al. (2016b). We only provide a brief description here. The optical photometric data and NUV magnitudes were taken from the SDSS DR7 and the Galaxy Evolution Explorer (GALEX) satellite (Martin et al. 2005), respectively. The NUV photometric data are available from the GALEX for 69 sample adv-merger (U)LIRGs and control sample galaxies. We further performed k-corrections, the Galactic extinction and internal extinction corrections to the optical and NUV magnitudes. The stellar masses for our sample adv-mergers and the control sample galaxies were retrieved from the Max Planck Institute for Astrophysics-Johns Hopkins University (MPA/JHU444http://www.mpa-garching.mpg.de/SDSS) stellar mass catalog (Kauffmann et al. 2003b), which are based on the SDSS five broad-band photometry. The SFRs for 25 star-forming and 38 composite555The spectral classification were performed according to the BPT diagram (Baldwin et al. 1981; Kauffmann et al. 2003a; Kewley et al. 2001). adv-merger (U)LIRGs were calculated using their H luminosities taken from the MPA/JHU catalog following Kennicutt (1998) and then were converted to a Kroupa IMF. Note that the H luminosities are aperture-corrected (Hopkins et al. 2003) as well as dust extinction corrected under the assumption of the case B recombination value of intrinsic H/H as 2.86.
The D, EW(H) and EW(HA) were retrieved from the MPA/JHU catalog, in which the EW(HA) has been corrected for the contamination by nebular emission. We further performed the internal extinction corrections for D and EW(H), using the Calzetti’s law (Calzetti et al. 2000).
3 RESULTS AND DISCUSSION
As presented in Guo et al. (2016b), most of our sample adv-merger (U)LIRGs are located above the star-forming main sequence on the SFR- diagram, indicating that they are experiencing massive starbursts as triggered by gas-rich major merging. All these galaxies are blue and massive, and thus lie to the right of the blue cloud galaxies on the optical and NUV color-mass diagrams, making them distinct from the blue cloud, red sequence and green valley galaxies. These properties suggest that they are at the starting point of the fast track of galaxy evolution from the blue cloud to the red sequence. Therefore, it is interesting to ask whether they have already shown an evolutionary trend, as imprinted in their star formation history indicators. In this work, we investigate the distributions of the star formation history indicators, EW(H), EW(HA) and D on the color-mass and SFR-mass diagrams to search for evidence of possible evolution among the adv-merger (U)LIRGs sample.
3.1 Distributions of EW(H), EW(HA) and D in the NUV-r Color-Mass Diagram
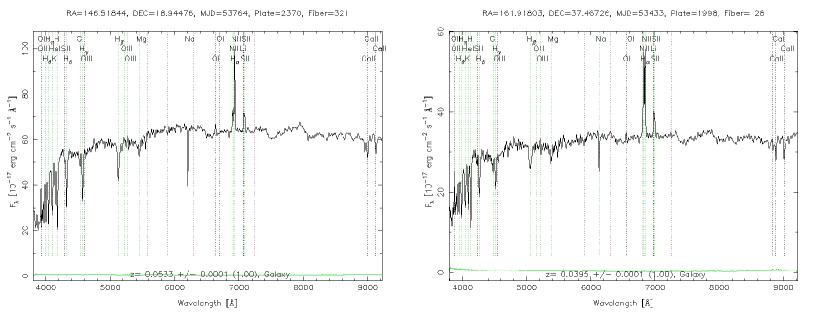
Although a large fraction of our sample adv-merger (U)LIRGs are undergoing massive starbursts, the optical spectra of several galaxies in our sample already present clear K+A like features. Figure 2 shows the example spectra of two such galaxies, from which we can clearly see the K+A like spectroscopic signatures, i.e., weak H emission, strong HA absorption line and deep 4000Å break. These features indicate that a small fraction of adv-merger (U)LIRGs are more evolved than the others under the assumption that the adv-merger (U)LIRGs have similar star formation histories.
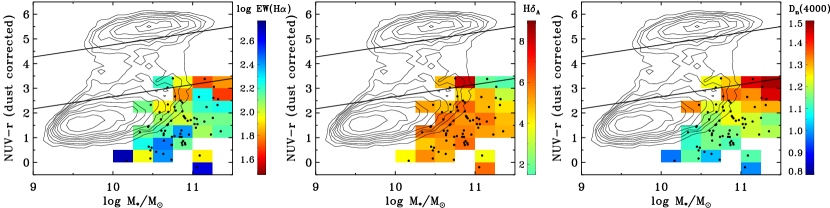
To get a visual view of the evolution, we use different colors to represent the EW(H), EW(HA) and D values on the NUV-r color-mass diagram, shown in the left, middle and right panels of Figure 3, respectively. It is clear from the middle panel of Figure 3 that the EW(HA) values for most sample galaxies are larger than 4Å, indicating A-type star features from a burst in the recent past. In the left and right panels of Figure 3, there are obvious trends that the redder the galaxies are on the NUV-r color-mass diagram, the smaller the EW(H) and the larger the D are. The reddest adv-merger (U)LIRGs close to the green valley mostly have D. We note that such trends are not caused by the correlation between the stellar mass and the EW(H) or D, as manifested by the apparent trends shown at a given stellar mass. Taking into account the evolutionary picture as traced by the D and EW(HA) for an instantaneous starburst by Kauffmann et al. (2003b), the adv-merger (U)LIRGs with redder NUV-r colors are likely close to the end of starbursts or at the initial stage of post-starbursts according to the definitions by Goto (2007), Martin et al. (2007) and Yesuf et al. (2014). Therefore, from the distributions of the EW(H), EW(HA) and D values on the NUV-r diagram in Figure 3, we can clearly see the evolutionary trend from starbursts with blue NUV-r colors ( mag) to relatively older populations with redder colors ( mag) that formed in recent starbursts within the past Gyr, which is consistent with the gas exhausting time-scales as estimated in Guo et al. (2016b). This adds additional evidence for the fast evolutionary pathway to the conclusion drawn by Guo et al. (2016b).
3.2 Distributions of EW(H), EW(HA) and D in the SFR- Diagram
It has been accepted that the SFR- relation reflects the star formation modes: galaxies on the star formation main sequence form stars in a relatively steady mode, while galaxies localized above the main sequence line form stars in a starburst mode (Rodighiero et al. 2011; Hung et al. 2013). From the analysis for adv-merger (U)LIRGs, Guo et al. (2016b) found that about three-fourths of adv-merger (U)LIRGs are located above the line of the local star-forming galaxy main sequence and one-fourth of the sample galaxies lie on the main sequence. Therefore, it is essential to investigate the reasons responsible for the difference between the galaxies above the main sequence and those on the main sequence. On the other hand, it is a complement to Section 3.1 to witness the evolution of the stellar populations on the SFR- diagram.
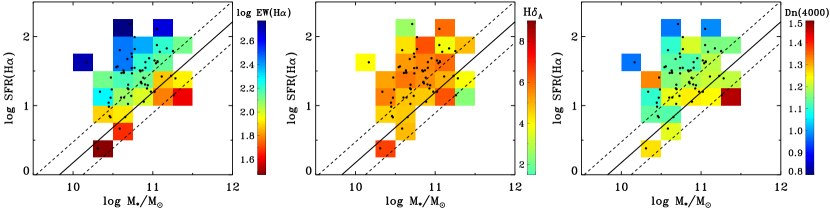
Similar to Figure 3, different colors are used to denote the EW(H), EW(HA) and D values for each sample galaxy on the SFR- diagram, shown in the left, middle and right panels of Figure 4, respectively. It is clear from the left and right panels of Figure 4 that at a given stellar mass, there are clear trends that as the SFR decreases, the EW(H) decreases and the D increases. In addition, the sample galaxies on the main sequence have relatively smaller EW(HA) on average. These results suggest that the adv-merger (U)LIRGs localized on the main sequence are more evolved counterparts of those above the main sequence, and they have started to fade from the starburst stage, as indicated by their smaller EW(H) and larger D. According to the starburst age estimated by D (Kauffmann et al. 2003b), these adv-merger (U)LIRGs are going to leave the main sequence towards low SFRs in the SFR- diagram in Gyr. The evolution of the spectral indices on the SFR- diagram depicts a coherent picture with that exhibited by Figure 3.
4 SUMMARY
With the aim of studying the fast quenching process from the blue cloud to the red sequence, we retrieve 79 local adv-merger (U)LIRGs with SDSS spectroscopic observations from Guo et al. (2016b) and investigate the distributions of EW(H), EW(HA) and D on the NUV-r color-mass and SFR- diagrams. The distributions of EW(H), EW(HA) and D values on the NUV-r color-mass and SFR- diagrams of adv-merger (U)LIRGs show obvious evolutionary trends: at a given stellar mass, galaxies with redder NUV-r colors or lower SFRs have smaller EW(H) and larger D, indicating more evolved stellar populations. Moreover, most of the reddest adv-merger (U)LIRGs close to the green valley have D and the majority of our sample galaxies have EW(HA) Å that is a sign for A-type star features from a recent starburst in the past Gyr. These results suggest that some of the adv-merger (U)LIRGs have already shown signs of fading from the starburst stage and the reddest adv-merger (U)LIRGs in NUV-r color are likely at the initial stage of post-starbursts with age of Gyr. This time-scale coincides with the gas depletion time-scales derived by Guo et al. (2016b). Therefore, our results add additional support for the fast evolutionary track proposed by several groups (e.g. Muzzin et al. 2013; Barro et al. 2013, 2014a, 2014b; Marchesini et al. 2014; Schawinski et al. 2014; Belli et al. 2015; Wellons et al. 2015).
Acknowledgements.
We would like to thank the anonymous referee for helpful comments that improved the manuscript. This project is supported by the NSF of China 11373027, 10973011 and 11003015. The Project-sponsored by SRF for ROCS, SEM. Funding for the creation and distribution of the SDSS Archive has been provided by the Alfred P. Sloan Foundation, the Participating Institutions, the National Aeronautics and Space Administration, the National Science Foundation, the U.S. Department of Energy, the Japanese Monbukagakusho, and the Max Planck Society. The SDSS Web site is http://www.sdss.org/. The SDSS is managed by the Astrophysical Research Consortium (ARC) for the Participating Institutions. The Participating Institutions are The University of Chicago, Fermilab, the Institute for Advanced Study, the Japan Participation Group, The Johns Hopkins University, the Korean Scientist Group, Los Alamos National Laboratory, the Max-Planck-Institute for Astronomy (MPIA), the Max-Planck-Institute for Astrophysics (MPA), New Mexico State University, University of Pittsburgh, Princeton University, the United States Naval Observatory, and the University of Washington. Some of the data presented in this paper were obtained from the Mikulski Archive for Space Telescopes (MAST). STScI is operated by the Association of Universities for Research in Astronomy, Inc., under NASA contract NAS5-26555. Support for MAST for non-HST data is provided by the NASA Office of Space Science via grant NNX09AF08G and by other grants and contracts.References
- Abazajian et al. (2009) Abazajian, K. N., Adelman-McCarthy, J. K., Agüeros, M. A., et al. 2009, ApJS, 182, 543
- Baldry et al. (2006) Baldry, I. K., Balogh, M. L., Bower, R. G., et al. 2006, MNRAS, 373, 469
- Baldry et al. (2004) Baldry, I. K., Glazebrook, K., Brinkmann, J., et al. 2004, ApJ, 600, 681
- Baldwin et al. (1981) Baldwin, J. A., Phillips, M. M., & Terlevich, R. 1981, PASP, 93, 5
- Barro et al. (2014a) Barro, G., Faber, S. M., Pérez-González, P. G., et al. 2014a, ApJ, 791, 52
- Barro et al. (2013) Barro, G., Faber, S. M., Pérez-González, P. G., et al. 2013, ApJ, 765, 104
- Barro et al. (2014b) Barro, G., Trump, J. R., Koo, D. C., et al. 2014b, ApJ, 795, 145
- Bell et al. (2004) Bell, E. F., Wolf, C., Meisenheimer, K., et al. 2004, ApJ, 608, 752
- Belli et al. (2015) Belli, S., Newman, A. B., & Ellis, R. S. 2015, ApJ, 799, 206
- Calzetti et al. (2000) Calzetti, D., Armus, L., Bohlin, R. C., et al. 2000, ApJ, 533, 682
- Chen et al. (2010) Chen, Y., Lowenthal, J. D., & Yun, M. S. 2010, ApJ, 712, 1385
- Faber et al. (2007) Faber, S. M., Willmer, C. N. A., Wolf, C., et al. 2007, ApJ, 665, 265
- Fukugita et al. (2004) Fukugita, M., Nakamura, O., Turner, E. L., Helmboldt, J., & Nichol, R. C. 2004, ApJ, 601, L127
- Guo et al. (2016a) Guo, R., Hao, C.-N., Xia, X.-Y., Wei, P., & Guo, X. 2016a, \raa, in press (arXiv:1603.04988)
- Guo et al. (2016b) Guo, R., Hao, C.-N., Xia, X. Y., Mao, S. & Shi, Y. 2016b, ApJ, in press (arXiv:1604.07122)
- Goto (2007) Goto, T. 2007, MNRAS, 381, 187
- Hopkins et al. (2003) Hopkins, A. M., Miller, C. J., Nichol, R. C., et al. 2003, ApJ, 599, 971
- Hung et al. (2013) Hung, C.-L., Sanders, D. B., Casey, C. M., et al. 2013, ApJ, 778, 129
- Ilbert et al. (2010) Ilbert, O., Salvato, M., Le Floc’h, E., et al. 2010, ApJ, 709, 644
- Kauffmann et al. (2003a) Kauffmann, G., Heckman, T. M., Tremonti, C., et al. 2003a, MNRAS, 346, 1055
- Kauffmann et al. (2003b) Kauffmann, G., Heckman, T. M., White, S. D. M., et al. 2003b, MNRAS, 341, 33
- Kauffmann et al. (2003c) Kauffmann, G., Heckman, T. M., White, S. D. M., et al. 2003c, MNRAS, 341, 54
- Kaviraj (2009) Kaviraj, S. 2009, MNRAS, 394, 1167
- Kennicutt (1998) Kennicutt, R. C., Jr. 1998, ARA&A, 36, 189
- Kewley et al. (2001) Kewley, L. J., Dopita, M. A., Sutherland, R. S., Heisler, C. A., & Trevena, J. 2001, ApJ, 556, 121
- Kilerci Eser et al. (2014) Kilerci Eser, E., Goto, T., & Doi, Y. 2014, ApJ, 797, 54
- Kim & Sanders (1998) Kim, D.-C., & Sanders, D. B. 1998, ApJS, 119, 41
- Knapen & James (2009) Knapen, J. H., & James, P. A. 2009, ApJ, 698, 1437
- Kriek et al. (2009) Kriek, M., van Dokkum, P. G., Franx, M., Illingworth, G. D., & Magee, D. K. 2009, ApJ, 705, L71
- Kroupa (2001) Kroupa, P. 2001, MNRAS, 322, 231
- Lupton et al. (2004) Lupton, R., Blanton, M. R., Fekete, G., et al. 2004, PASP, 116, 133
- Marchesini et al. (2014) Marchesini, D., Muzzin, A., Stefanon, M., et al. 2014, ApJ, 794, 65
- Martin et al. (2005) Martin, D. C., Fanson, J., Schiminovich, D., et al. 2005, ApJ, 619, L1
- Martin et al. (2007) Martin, D. C., Wyder, T. K., Schiminovich, D., et al. 2007, ApJS, 173, 342
- Muzzin et al. (2013) Muzzin, A., Marchesini, D., Stefanon, M., et al. 2013, ApJS, 206, 8
- Oh et al. (2011) Oh, K., Sarzi, M., Schawinski, K., & Yi, S. K. 2011, ApJS, 195, 13
- Rodighiero et al. (2011) Rodighiero, G., Daddi, E., Baronchelli, I., et al. 2011, ApJ, 739, L40
- Sanders & Mirabel (1996) Sanders, D. B., & Mirabel, I. F. 1996, ARA&A, 34, 749
- Saunders et al. (2000) Saunders, W., Sutherland, W. J., Maddox, S. J., et al. 2000, MNRAS, 317, 55
- Schawinski et al. (2014) Schawinski, K., Urry, C. M., Simmons, B. D., et al. 2014, MNRAS, 440, 889
- Schlegel et al. (1998) Schlegel, D. J., Finkbeiner, D. P., & Davis, M. 1998, ApJ, 500, 525
- van Dokkum et al. (2008) van Dokkum, P. G., Franx, M., Kriek, M., et al. 2008, ApJ, 677, L5
- Wang et al. (2006) Wang, J. L., Xia, X. Y., Mao, S., et al. 2006, ApJ, 649, 722
- Wellons et al. (2015) Wellons, S., Torrey, P., Ma, C.-P., et al. 2015, MNRAS, 449, 361
- Wright et al. (2010) Wright, E. L., Eisenhardt, P. R. M., Mainzer, A. K., et al. 2010, AJ, 140, 1868-1881
- Yesuf et al. (2014) Yesuf, H. M., Faber, S. M., Trump, J. R., et al. 2014, ApJ, 792, 84
- York et al. (2000) York, D. G., Adelman, J., Anderson, J. E., Jr., et al. 2000, AJ, 120, 1579