Giant Rashba Splitting in CH3NH3PbBr3 Organic-Inorganic Perovskite
Abstract
As they combine decent mobilities with extremely long carrier lifetimes, organic-inorganic perovskites have opened a whole new field in optoelectronics. Measurements of their underlying electronic structure, however, are still lacking. Using angle-resolved photoelectron spectroscopy, we measure the valence band dispersion of single-crystal CH3NH3PbBr3. The dispersion of the highest energy band is extracted applying a modified leading edge method, which accounts for the particular density of states of organic-inorganic perovskites. The surface Brillouin zone is consistent with bulk-terminated surfaces both in the low-temperature orthorhombic and the high-temperature cubic phase. In the low-temperature phase, we find a ring-shaped valence band maximum with a radius of 0.043 Å-1, centered around a 0.16 eV deep local minimum in the dispersion of the valence band at the high-symmetry point. Intense circular dichroism is observed. This dispersion is the result of strong spin-orbit coupling. Spin-orbit coupling is also present in the room-temperature phase. The coupling strength is one of the largest reported so far.
Organic-inorganic perovskite compounds (OIPCs) have potential applications in optoelectronics ranging from high-efficiency thin film solar cells Yang et al. (2015); Saliba et al. (2016); Stranks and Snaith (2015) to photodetectors Dou et al. (2014) and scintillators Yakunin et al. (2015), and from optical refrigeration Ha et al. (2015) to low-threshold nanolasers Zhu et al. (2015). Yet, fundamental questions remain open concerning the electronic structure underlying their favorable phototransport properties. Relativistic effects, i. e. spin-orbit coupling (SOC) and resulting spin splitting, are expected because of the constituting heavy elements Even et al. (2013, 2014); Kim et al. (2014); Brivio et al. (2014); Umari et al. (2014). Spin splitting could be strong enough to contribute to the long carrier lifetimes in OIPCs Zheng et al. (2015); Etienne et al. (2016); Azarhoosh et al. (2016), and to allow for OIPC-based spintronic devices Kepenekian et al. (2015); Li and Haney (2016). However, the spin splitting found in calculations Park et al. (2015); Quarti et al. (2014); Motta et al. (2015) is extremely sensitive to the orientation of the organic cation and to distortions of the inorganic cage, with calculated Rashba parameters of energetically similar structures Quarti et al. (2014) ranging from eV Å to almost eV Å. As direct measurements of the electronic structure are lacking Berry et al. (2015), the actual extend of Rashba splitting in OIPCs remains unknown. Yet, intense circular dichroism in pump-probe spectroscopy Giovanni et al. (2015) and spin dependence of charge dissociation and recombination at room temperature Hsiao et al. (2015) in CH3NH3PbI3 hint to the possibility to create spin polarization in OIPCs.
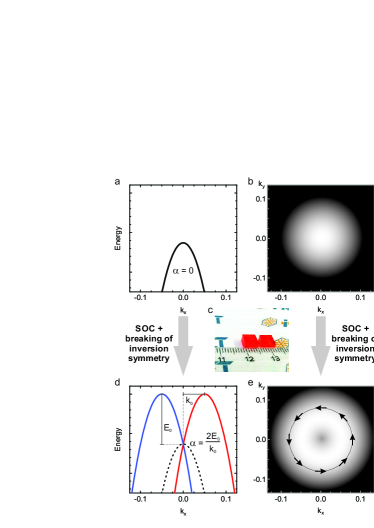
We report measurements of the electronic structure of single-crystal CH3NH3PbBr3 using angle-resolved photoelectron spectroscopy (ARPES). CH3NH3PbBr3 grows large cubic single crystals Shi et al. (2015); Dong et al. (2015), as shown in figure 1, suitable for cleaving in ultrahigh vacuum and for ARPES experiments. Applying a leading edge method that takes into account the density of states (DOS) of the OIPC, we extract the dispersion of the highest-energy valence band (VB). We find a spin-splitting of the band, quantified by the Rashba parameter . The effect of Rashba splitting on band dispersion is illustrated in figure 1. Rashba splitting arises when orbitals with SOC are subject to symmetry-breaking electric fields. It causes a splitting of a doubly spin-degenerate band into two bands shifted with respect to each other in k-space by . At the central high-symmetry point, a minimum arises of depth . For CH3NH3PbBr3 we find Rashba parameters of eV Å and eV Å in the orthorhombic and the cubic phase, respectively. These values are amongst the highest ones reported Ishizaka et al. (2011). Our findings point out the critical role of local inversion-symmetry breaking fields in OIPCs, and of the resulting spin splitting Park et al. (2015); Quarti et al. (2014); Motta et al. (2015). We hope our study will stimulate further investigations of spin structure in OIPCs to elucidate the role of spin splitting and possible spin polarization in existing and future applications.
Crystal were synthesized according to the modified procedure in reference Shi et al., 2015. For details of sample preparation see figure S1 of the Supplemental Material sup . Resulting CH3NH3PbBr3 single crystals with sizes of cm are shown in figure 1 (c). They exhibit a cubic shape, exposing (001)-oriented facets. Clean surfaces were prepared by cleaving crystals in vacuum (base pressure Pa) parallel to the exposed (001) face. This results in a single, optically flat terrace with an area of several mm2. Samples were then transferred to ultrahigh vacuum (base pressure Pa) within 1 min. We monitor possible loss of methylamine using thermal desorption spectroscopy. No desorption of the organic compound was detectable below 320 K, see figure S2 (a) sup . ARPES spectra were recorded using unpolarized light with a photon energy of 21.2 eV (He I). Satellite lines were subtracted. The fourth harmonic of a femtosecond Ti:Sa oscillator (h eV) was used for laser-ARPES. Spectra were recorded with an ellipsoidal display-type analyzer Schnell et al. (1984). It collects two-dimensional angular photoelectron distribution patterns from an acceptance cone covering to both along and perpendicular to the plane of light incidence without the need to move sample or analyzer. During cooling, we perform in situ using photoluminescence spectroscopy reproducing the phase transitions reported in literature Swainson et al. (2015), see figure S2 (b) sup .
Figure 2 (a) shows a normal emission photoelectron spectrum of CH3NH3PbBr3 in the low-temperature orthorhombic phase. The VBs extend roughly from eV to eV, with a width of 5 eV matching the one reported from calculations Mosconi et al. (2013); Park et al. (2015). The doping level exhibits sample-to-sample variations from intrinsic, as shown in figure 2 (a), to p-type with the VB maximum (VBM) close to the Fermi level, as in figure 4. Doping acts as a rigid shift of the spectra, and otherwise does not affect the results reported here. The room-temperature normal emission spectrum of CH3NH3PbBr3 is shown in Figure 2 (b). Substructures appear less pronounced than at low temperature. The widths of the spectra are similar.
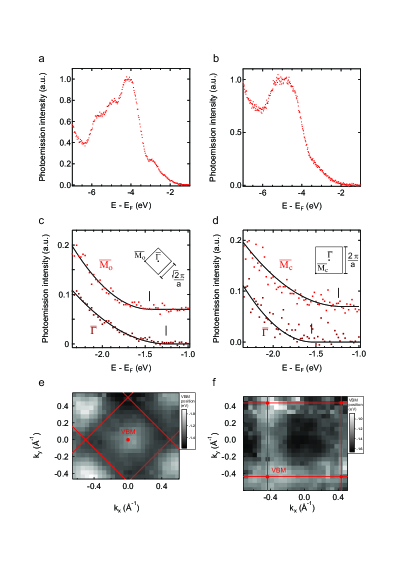
As known from calculations Mosconi et al. (2013); Park et al. (2015); Endres et al. (2016), the highest-energy VB has a significantly smaller effective mass than deeper-lying bands, and contributes little to the DOS. The DOS is approximately parabolic on a scale of several hundred meV around the band edges Jishi et al. (2014); Umari et al. (2014); Motta et al. (2015); Menéndez-Proupin et al. (2014), in contrast to the typical square-root behavior of three-dimensional semiconductors with parabolic bands. Accounting for this particular DOS, we use a modified leading-edge method to determine the position of the highest-energy VB. The VB edge is approximated by a parabolic fit to the ARPES spectra, reflecting the DOS found in calculations. The procedure is illustrated in Figure 2 (c) and (d) for CH3NH3PbBr3 in the low-temperature and room-temperature phase. The fitting curve is set to zero above the vertex, giving the position of the topmost VB. At the VBM, photoemission intensity drops to zero. We find no indication of in-gap surface electronic states. The low trap density allows a detailed analysis of the VB edge, which was not possible in a previous study on CH3NH3PbI3 thin films Wu et al. (2015) with surface traps all the way up to the Fermi level.
The insets in figure 2 (c) and (d) show the surface Brillouin zones expected for bulk-terminated (001) surfaces in both phases. Here Å Poglitsch and Weber (1987); Mashiyama et al. (1998) is the cubic lattice constant. The low-temperature Brillouin zone is approximated by a square, since domains of different orientation can form upon cooling the crystal, which are not resolved by our experiment (spatial resolution: 3 mm). The given surface Brillouin zone reflects domains with out-of-plane alignment of the orthorhombic axis.
The position of the VB edge for various parallel momenta is shown in figure 2 (e) and (f) for both phases under investigation. The number of k-points was reduced for reasons of clarity. At low temperature, band maxima are located at normal emission, i. e. at , and at around Å-1. Their periodicity is consistent with the bulk-terminated surface Brillouin zone shown in figure 2 (c) and a reciprocal lattice constant of Å-1. No indications of surface reconstructions are found. Also, we do not observe band maxima at the points, which would be the signature of domains with in-plane orientation of the orthorhombic axis. The observed out-of-plane alignment of the axis at the surface is consistent with scanning tunneling microscopy Ohmann et al. (2015). In the room-temperature phase, figure 2 (f), only the band maxima at the boundaries of the Brillouin zone remain, whereas its center forms a minimum. This is consistent with the bulk terminated surface of the cubic crystal as shown in the inset of figure 2 (d), without indications of surface reconstructions.
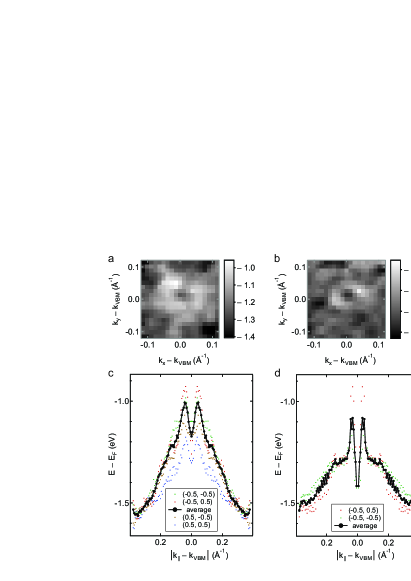
Figures 3 (a) and (b) show close-ups of the band maxima. Data for equivalent maxima were averaged for better statistics. Figures 3 (c) and (d) show the photoemission intensity after averaging along the azimuthal direction around the high-symmetry points. Data were mirrored with respect to for reasons of clarity. Dots give the positions of individual band maxima, black symbols depict their average. Since the experimental resolution is highest for the maxima at (-0.5, ) Å-1, which are found closest to the central axis of the analyzer in our experiments, only these maxima are taken into account in the averaging and for the room-temperature phase.
Independent of structural phase, all maxima exhibit a sub-structure with a local minimum at the high symmetry points and a surrounding, approximately ring-shaped maximum. The band maximum is shifted from the high symmetry point by Å-1. Band maxima in the orthorhombic phase are found at an energy of eV with respect to the minimum at , and at eV in the cubic phase, respectively. The spacing between the maxima is too large to result from orthorhombic domains of different orientation, or respective local tetragonal domains at room temperature, even if these inhomogeneities are present at the surface. We assign the shift of the band maxima in k-space to spin-orbit coupling in the material.
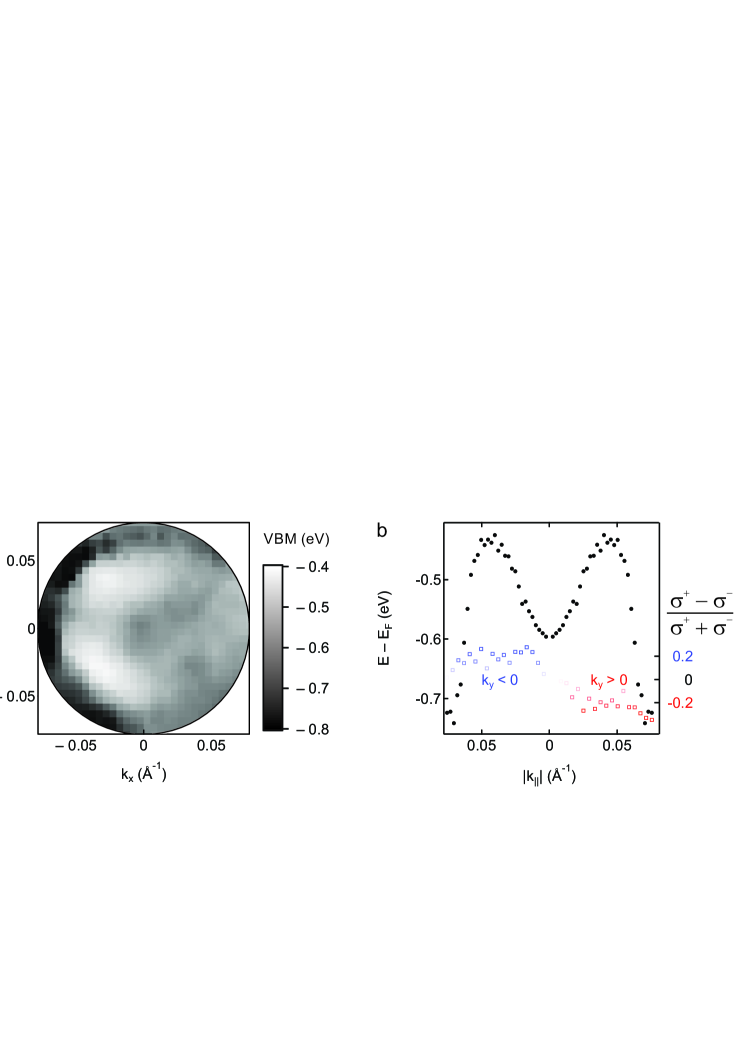
To test this interpretation, we performed laser-ARPES using circularly polarized light. Circular dichroism is a necessary consequence of spin-orbit coupling. Because of the low photon energy of the laser (h eV), the technique is limited to the VBM at normal emission of the low-temperature phase. Since ARPES signal from the VB overlaps with secondary electrons at low kinetic energies, an exponential background was introduced in the fitting procedure in addition to the parabolic VB DOS. Figures 4 (a, b) show the resulting dispersion. Data analysis is restricted to Å-1 because of the low photon energy. Again, a ring-shaped maximum with Å-1 and eV is found. The dispersion matches the one from the conventional ARPES experiment in figure 3 (c). Notably, the information depth in laser-ARPES is a factor 15 larger because of reduced photon energy Seah and Dench (1979) and emission angle. A circular dichroism map is given in figure 4 (c). It shows the difference in photoemission intensity from the VB in experiments with right- and left-handed circularly polarized light. The antisymmetric structure expected for spin-orbit split states is found for Å-1. The amplitude of the circular dichroism signal is .
The most simple model accounting for SOC is the Rashba Hamiltonian Rashba (1960); Casella (1960). Its solutions are two parabolas offset in k-space. The parameters are the effective mass of the bands and the Rashba parameter . The measured VB dispersion of CH3NH3PbBr3 deviates from a parabola, but is closer to a hyperbola or even a cone, consistent with the parabolic DOS Jishi et al. (2014); Umari et al. (2014); Motta et al. (2015); Menéndez-Proupin et al. (2014). The resolution of our experiment is insufficient to reliably extract effective masses at the maximum of the bands. The parameter , however, can be determined consistently. We find eV Å and eV Å for the orthorhombic and the cubic phase. These range at the higher end of calculated values for OIPCs Quarti et al. (2014) which give … eV Å. Since ARPES is a surface-sensitive technique, the reduced symmetry at the surface may enhance non-centrosymmetric fields and the measured Rashba splitting. In the bulk, CH3NH3PbBr3 forms an ordered orthorhombic structure of symmetry at low temperature Chi et al. (2005); Mashiyama et al. (2007), and a disordered cubic structure with an average symmetry at room temperature Mashiyama et al. (1998); Swainson et al. (2003, 2015). Both structures are centrosymmetric after averaging over a length scale probed by x-ray and neutron diffraction, with no Rashba-type spin-splitting expected. Scanning tunneling microscopy (STM) on (001) surfaces of CH3NH3PbBr3 reveals that at the surface both centrosymmetric (antiferroelectric) and non-centrosymmetric (ferroelectric) domains form after cooling the crystal from room temperature to low temperature Ohmann et al. (2015). Calculations showed that the non-centrosymmetric structure has the lower band gap. We thus speculate that it might dominate our ARPES data, which are spatially averaged over a spot size of (3 mm)2. It remains an open question how deeply the surface domains extend into the bulk. Freezing of local disorder was also found in photoluminescence Galkowski et al. (2016); Phuong et al. (2016); Panzer et al. (2016) and transient absorption spectroscopy Phuong et al. (2016) of thin films of CH3NH3PbI3, which has been ascribed to coexisting orthorhombic and tetragonal domains. We hypothesize that for thin films, the observed crystalline alignment at the surface may have a significant impact on the structure throughout the film at low temperature. Less is known about the surface structure at room temperature. Piezoforce response in atomic force microscopy at room temperature was detected at the surface of tetragonal CH3NH3PbI3 and ascribed to static ferroelectric ordering Coll et al. (2015); Kutes et al. (2014), but not in cubic CH3NH3PbBr3 Zhao et al. (2015), implying disorder at the latter surface. The underlying bulk lattice is cubic and centrosymmetric in average. Yet, the individual bromide atoms reside 0.04 from the high-symmetry sites in a disordered arrangement Mashiyama et al. (1998); Beecher et al. (2016); Yaffe et al. (2016). In CH3NH3PbI3, the methylamine ion wobbles and flips on 0.3 ps and 3 ps time scales Bakulin et al. (2015), and similar motions may be expected for CH3NH3PbBr3. The resulting spatially and temporally fluctuating fields give rise to a dynamical Rashba effect. Calculations report an average eV Å for bulk cubic CH3NH3PbI3 Etienne et al. (2016). Notably, Rashba splitting results in an energy upshift of the band maximum by with respect to the case of , as illustrated in figure 1 (d). The way our data are analyzed, we measure the dispersion of the highest-lying bands, giving an upper limit for spin-splitting in the disordered system.
To the best of our knowledge, the Rashba splitting reported here is the strongest one found experimentally for any system. For layered BiTeI, eV Å has been reported Ishizaka et al. (2011). The exceptionally large we extract may in part be the result of deviations in dispersion from the parabolic one of the Rashba model. Nevertheless, with being larger than the momentum of visible photons and , spin-splitting puts constraints to optically allowed transitions and carrier recombination in OIPCs, thus forming a crucial ingredient to phototransport in the material. Enhancement of carrier lifetimes by one to two orders of magnitude were predicted Zheng et al. (2015); Azarhoosh et al. (2016) for CH3NH3PbI3 and a static Rashba splitting in the conduction band of … eV. The VB Rashba splitting is mediated by the SOC of the Pb orbital Kim et al. (2014) for both CH3NH3PbI3 and CH3NH3PbBr3, but is sensitive to details of the crystal structure Amat et al. (2014); Quarti et al. (2014). In most OIPCs, the Rashba splitting is stronger in the conduction band than in the VB Umari et al. (2014); Amat et al. (2014); Etienne et al. (2016). Calculations also report a complex spin structure involving both Rashba and Dresselhaus spin splittings Kepenekian et al. (2015); Pedesseau et al. (2016). We hope our results will stimulate further studies on the effect of spin splitting and polarization on the electronic properties of this multifaceted system.
In summary, we report measurements of the electronic structure of single crystal CH3NH3PbBr3 in the orthorhombic and the cubic phase. Using a modified leading edge method, which accounts for the DOS of the OIPC, we extract the dispersion of the highest-energy VB. Surface Brillouin zones are consistent with bulk terminated surfaces. In the low-temperature phase, the orthorhombic axis shows preferential out-of-plane alignment at the surface. No indication of surface electronic states within an energy range of 1 eV above the VB maximum is found. Most importantly, we find a splitting of the VBM in k-space by Å-1, giving rise to a minimum around 0.16 eV deep at the high symmetry points. Together with the observed circular dichroism, the dispersion indicates a Rashba splitting that is amongst the strongest reported.
References
- Yang et al. (2015) W. S. Yang, J. H. Noh, N. J. Jeon, Y. C. Kim, S. Ryu, J. Seo, and S. I. Seok, Science 348, 1234 (2015).
- Saliba et al. (2016) M. Saliba, S. Orlandi, T. Matsui, S. Aghazada, M. Cavazzini, J.-P. Correa-Baena, P. Gao, R. Scopelliti, E. Mosconi, K.-H. Dahmen, et al., Nat. Energy 1, 15017 (2016).
- Stranks and Snaith (2015) S. D. Stranks and H. J. Snaith, Nat. Nanotechnol. 10, 391 (2015).
- Dou et al. (2014) L. Dou, Y. M. Yang, J. You, Z. Hong, W.-H. Chang, G. Li, and Y. Yang, Nat. Commun. 5, 5404 (2014).
- Yakunin et al. (2015) S. Yakunin, M. Sytnyk, D. Kriegner, S. Shrestha, M. Richter, G. J. Matt, H. Azimi, C. J. Brabec, J. Stangl, M. V. Kovalenko, et al., Nature Photon. 9, 444 (2015).
- Ha et al. (2015) S.-T. Ha, C. Shen, J. Zhang, and Q. Xiong, Nature Photon. 10, 116 (2015).
- Zhu et al. (2015) H. Zhu, Y. Fu, F. Meng, X. Wu, Z. Gong, Q. Ding, M. V. Gustafsson, M. T. Trinh, S. Jin, and X. Y. Zhu, Nat. Mater. 14, 636 (2015).
- Even et al. (2013) J. Even, L. Pedesseau, J.-M. Jancu, and C. Katan, J. Phys. Chem. Lett. 4, 2999 (2013).
- Even et al. (2014) J. Even, L. Pedesseau, J.-M. Jancu, and C. Katan, Phys. Status Solidi RRL 8, 31 (2014).
- Kim et al. (2014) M. Kim, J. Im, A. J. Freeman, J. Ihm, and H. Jin, Proc. Natl. Acad. Sci. USA 111, 6900 (2014).
- Brivio et al. (2014) F. Brivio, K. T. Butler, A. Walsh, and M. van Schilfgaarde, Phys. Rev. B 89, 155204 (2014).
- Umari et al. (2014) P. Umari, E. Mosconi, and F. De Angelis, Sci. Rep. 4, 4467 (2014).
- Zheng et al. (2015) F. Zheng, L. Z. Tan, S. Liu, and A. M. Rappe, Nano Lett. 15, 7794 (2015).
- Etienne et al. (2016) T. Etienne, E. Mosconi, and F. De Angelis, J. Phys. Chem. Lett. 7, 1638 (2016).
- Azarhoosh et al. (2016) P. Azarhoosh, S. McKechnie, J. M. Frost, A. Walsh, and M. van Schilfgaarde, APL Mater. 4, 091501 (2016).
- Kepenekian et al. (2015) M. Kepenekian, R. Robles, C. Katan, D. Sapori, L. Pedesseau, and J. Even, ACS nano 9, 11557 (2015).
- Li and Haney (2016) J. Li and P. M. Haney, Phys. Rev. B 93, 155432 (2016).
- Park et al. (2015) J.-S. Park, S. Choi, Y. Yan, Y. Yang, J. M. Luther, S.-H. Wei, P. Parilla, and K. Zhu, J. Phys. Chem. Lett. 6, 4304 (2015).
- Quarti et al. (2014) C. Quarti, E. Mosconi, and F. De Angelis, Chem. Mat. 26, 6557 (2014).
- Motta et al. (2015) C. Motta, F. El-Mellouhi, S. Kais, N. Tabet, F. Alharbi, and S. Sanvito, Nat. Commun. 6, 7026 (2015).
- Berry et al. (2015) J. Berry, T. Buonassisi, D. A. Egger, G. Hodes, L. Kronik, Y.-L. Loo, I. Lubomirsky, S. R. Marder, Y. Mastai, J. S. Miller, et al., Adv. Mater. 27, 5102 (2015).
- Giovanni et al. (2015) D. Giovanni, H. Ma, J. Chua, M. Grätzel, R. Ramesh, S. Mhaisalkar, N. Mathews, and T. C. Sum, Nano Lett. 15, 1553 (2015).
- Hsiao et al. (2015) Y.-C. Hsiao, T. Wu, M. Li, and B. Hu, Adv. Mater. 27, 2899 (2015).
- Shi et al. (2015) D. Shi, V. Adinolfi, R. Comin, M. Yuan, E. Alarousu, A. Buin, Y. Chen, S. Hoogland, A. Rothenberger, K. Katsiev, et al., Science 347, 519 (2015).
- Dong et al. (2015) Q. Dong, Y. Fang, Y. Shao, P. Mulligan, J. Qiu, L. Cao, and J. Huang, Science 347, 967 (2015).
- Ishizaka et al. (2011) K. Ishizaka, M. S. Bahramy, H. Murakawa, M. Sakano, T. Shimojima, T. Sonobe, K. Koizumi, S. Shin, H. Miyahara, A. Kimura, et al., Nat. Mater. 10, 521 (2011).
- (27) See Supplemental Material at [URL will be inserted by publisher] for details of sample preparation and characterization. Supplemental Material contains Figures S1 and S2 with x-ray diffraction, absorption spectroscopy, TDS, and photoluminescence data.
- Schnell et al. (1984) R. D. Schnell, D. Rieger, and W. Steinmann, J. Phys. E 17, 221 (1984).
- Swainson et al. (2015) I. P. Swainson, C. Stock, S. F. Parker, L. Van Eijck, M. Russina, and J. W. Taylor, Phys. Rev. B 92, 100303 (2015).
- Mosconi et al. (2013) E. Mosconi, A. Amat, M. K. Nazeeruddin, M. Grätzel, and F. De Angelis, J. Phys. Chem. C 117, 13902 (2013).
- Endres et al. (2016) J. Endres, D. A. Egger, M. Kulbak, R. A. Kerner, L. Zhao, S. H. Silver, G. Hodes, B. P. Rand, D. Cahen, L. Kronik, et al., J. Phys. Chem. Lett. 7, 2722 (2016).
- Jishi et al. (2014) R. A. Jishi, O. B. Ta, and A. A. Sharif, J. Phys. Chem. C 118, 28344 (2014).
- Menéndez-Proupin et al. (2014) E. Menéndez-Proupin, P. Palacios, P. Wahnón, and J. C. Conesa, Phys. Rev. B 90, 045207 (2014).
- Wu et al. (2015) X. Wu, M. T. Trinh, D. Niesner, H. Zhu, Z. Norman, J. S. Owen, O. Yaffe, B. J. Kudisch, and X.-Y. Zhu, J. Am. Chem. Soc. 137, 2089 (2015).
- Poglitsch and Weber (1987) A. Poglitsch and D. Weber, J. Chem. Phys. 87, 6373 (1987).
- Mashiyama et al. (1998) H. Mashiyama, Y. Kurihara, and T. Azetsu, J. Kor. Phys. Soc. 32, S156 (1998).
- Ohmann et al. (2015) R. Ohmann, L. K. Ono, H.-S. Kim, H. Lin, M. V. Lee, Y. Li, N.-G. Park, and Y. Qi, J. Am. Chem. Soc. 137, 16049 (2015).
- Seah and Dench (1979) M. P. Seah and W. A. Dench, Surf. Interface Anal. 1, 2 (1979).
- Rashba (1960) E. Rashba, Soviet Physics-Solid State 2, 1109 (1960).
- Casella (1960) R. Casella, Phys. Rev. Lett. 5, 371 (1960).
- Chi et al. (2005) L. Chi, I. Swainson, L. Cranswick, J.-H. Her, P. Stephens, and O. Knop, J. Solid State Chem. 178, 1376 (2005).
- Mashiyama et al. (2007) H. Mashiyama, Y. Kawamura, and Y. Kubota, J. Kor. Phys. Soc. 51, 850 (2007).
- Swainson et al. (2003) I. Swainson, R. Hammond, C. Soulliére, O. Knop, and W. Massa, J. Solid State Chem. 176, 97 (2003).
- Galkowski et al. (2016) K. Galkowski, A. Mitioglu, A. Surrente, Z. Yang, D. Maude, P. Kossacki, G. Eperon, J. Wang, H. Snaith, P. Plochocka, et al., arXiv preprint arXiv:1606.03234 (2016).
- Phuong et al. (2016) L. Q. Phuong, Y. Yamada, M. Nagai, N. Maruyama, A. Wakamiya, and Y. Kanemitsu, J. Phys. Chem. Lett. 7, 2316 (2016).
- Panzer et al. (2016) F. Panzer, S. Baderschneider, T. P. Gujar, T. Unger, S. Bagnich, M. Jakoby, H. Bässler, S. Hüttner, J. Köhler, R. Moos, et al., Adv. Opt. Mater. 4, 917 (2016).
- Coll et al. (2015) M. Coll, A. Gomez, E. Mas-Marza, O. Almora, G. Garcia-Belmonte, M. Campoy-Quiles, and J. Bisquert, J. Phys. Chem. Lett. 6, 1408 (2015).
- Kutes et al. (2014) Y. Kutes, L. Ye, Y. Zhou, S. Pang, B. D. Huey, and N. P. Padture, J. Phys. Chem. Lett. 5, 3335 (2014).
- Zhao et al. (2015) P. Zhao, J. Xu, X. Dong, L. Wang, W. Ren, L. Bian, and A. Chang, J. Phys. Chem. Lett. 6, 2622 (2015).
- Beecher et al. (2016) A. N. Beecher, O. E. Semonin, J. M. Skelton, J. M. Frost, M. W. Terban, H. Zhai, A. Alatas, J. S. Owen, A. Walsh, and S. J. Billinge, arXiv preprint arXiv:1606.09267 (2016).
- Yaffe et al. (2016) O. Yaffe, Y. Guo, T. Hull, C. C. Stoumpos, L. Z. Tan, D. A. Egger, F. Zheng, O. E. Semonin, A. N. Beecher, T. F. Heinz, et al., arXiv preprint arXiv:1604.08107 (2016).
- Bakulin et al. (2015) A. A. Bakulin, O. Selig, H. J. Bakker, Y. L. Rezus, C. Müller, T. Glaser, R. Lovrincic, Z. Sun, Z. Chen, A. Walsh, et al., J. Phys. Chem. Lett. 6, 3663 (2015).
- Amat et al. (2014) A. Amat, E. Mosconi, E. Ronca, C. Quarti, P. Umari, M. K. Nazeeruddin, M. Grätzel, and F. De Angelis, Nano Lett. 14, 3608 (2014).
- Pedesseau et al. (2016) L. Pedesseau, M. Kepenekian, R. Robles, D. Sapori, C. Katan, and J. Even, in SPIE OPTO (International Society for Optics and Photonics, 2016), pp. 97421B–97421B.