The Geometry of the Infrared and X-ray Obscurer in a Dusty Hyperluminous Quasar
Abstract
We study the geometry of the AGN obscurer in IRAS 091044109, an IR-luminous, radio-intermediate FR-I source at =0.442, using infrared data from Spitzer and Herschel, X-ray data from NuSTAR, Swift, Suzaku, and Chandra, and an optical spectrum from Palomar. The infrared data imply a total rest-frame 1-1000m luminosity of erg s-1 and require both an AGN torus and starburst model. The AGN torus has an anisotropy-corrected IR luminosity of erg s-1, and a viewing angle and half opening angle both of approximately from pole-on. The starburst has a star formation rate of M⊙ yr-1 and an age of Myr. These results are consistent with two epochs of luminous activity in IRAS 091044109: one approximately Myr ago, and one ongoing. The X-ray data suggest a photon index of and a line-of-sight column of cm-2. This argues against a reflection-dominated hard X-ray spectrum, which would have implied a much higher and luminosity. The X-ray and infrared data are consistent with a bolometric AGN luminosity of erg s-1. The X-ray and infrared data are further consistent with coaligned AGN obscurers in which the line of sight ‘skims’ the torus. This is also consistent with the optical spectra, which show both coronal iron lines and broad lines in polarized but not direct light. Combining constraints from the X-ray, optical, and infrared data suggests that the AGN obscurer is within a vertical height of pc, and a radius of 125 pc, of the nucleus.
Subject headings:
accretion, accretion discs. galaxies: starburst, galaxies: individual (IRAS 09104+4109)1. Introduction
A significant fraction of galaxy assembly at proceeds via episodes of rapid star formation (hundreds to thousands of Solar masses per year) and accretion onto supermassive black holes at a non-negligible fraction of the Eddington limit (e.g. Lilly et al., 1996; Dickinson et al., 2003; Pérez-González et al., 2005; Farrah et al., 2008; Wuyts et al., 2011; Béthermin et al., 2012; Alexander & Hickox, 2012; Madau & Dickinson, 2014; Rowan-Robinson et al., 2016). Moreover, there is evidence for a deep connection between starburst and AGN activity at all redshifts, from, for example, the relation (e.g. Magorrian et al., 1998; Tremaine et al., 2002), and from the presence of starbursts and AGN in the same systems (Genzel et al., 1998; Farrah et al., 2003; Alexander et al., 2005; Lonsdale et al., 2006; Hernán-Caballero et al., 2009; Harris et al., 2016) at rates much higher than expected by chance. There is also evidence that star formation and AGN activity can directly affect each other (see Fabian 2012 for a review), via both quenching (e.g. Croton et al., 2006; Chung et al., 2011; Farrah et al., 2012; Schaye et al., 2015; Alatalo et al., 2015) and triggering (e.g. King, 2005; Ishibashi & Fabian, 2012; Gaibler et al., 2012; Silk, 2013; Zubovas et al., 2013).
The connection between star formation and AGN activity is challenging to study, for two reasons. First, the bulk of these activities occur at high redshifts, (e.g. Chapman et al., 2005; Richards et al., 2006; Wang et al., 2013; Delvecchio et al., 2014), where they are seen both faintly and at coarsened spatial scales. Second, star forming regions and AGN are often occulted by large column densities of gas and dust. Thus, a substantial fraction of their light is observed in the infrared (Lagache et al., 2005; Alexander et al., 2005; Iglesias-Páramo et al., 2007; Farrah et al., 2013; Burgarella et al., 2013; Bridge et al., 2013; Mignoli et al., 2013; Casey et al., 2014; Vignali et al., 2014; Lanzuisi et al., 2015; Gruppioni et al., 2016). A choate picture of how star formation and AGN activity contribute to galaxy assembly thus requires both deep and wide blank-field extragalactic surveys, and case studies of individual objects at lower redshifts. The latter serve to create archetypes at high sensitivity and spatial resolution for how star formation and AGN activity proceed in galaxies, and to illustrate how constraints from multi-wavelength data can be combined.
IRAS 091044109 (Kleinmann et al., 1988) at (Hewett & Wild, 2010) is one such archetype, for the relationship between luminous, obscured AGN and star formation. In the radio it is a ‘radio-intermediate’ FR-I source, with a linear core and double-lobed structure (Hines & Wills, 1993; O’Sullivan et al., 2012). It is extremely IR-luminous (Rowan-Robinson, 2000; Ruiz et al., 2010; Vignali et al., 2011) with a rest-frame 1-1000 m luminosity of erg s-1, of which at least 70% arises from AGN activity. The mass of free baryons in the system is however small compared to other IR-luminous systems, with only M⊙ of molecular Hydrogen and of order M⊙ of warm dust (Evans et al., 1998; Combes et al., 2011). Its optical spectrum is that of a Sy2 (Kleinmann et al., 1988; Soifer et al., 1996; Véron-Cetty & Véron, 2006), but with broad H, H and Mg II lines in polarized light (Hines & Wills, 1993; Tran et al., 2000). There is also a polarized, bipolar reflection nebula centered on the nucleus (Hines et al., 1999). Its optical spectrum further reinforces its extreme nature; for example its O III Å luminosity, at erg s-1, is nearly an order of magnitude higher than any other type 2 quasar at (Lansbury et al., 2015). Inferring a current star formation rate from the equivalent width (EW) of [O II]Å yields M⊙yr-1 (Bildfell et al., 2008). There is also evidence, from fitting model star formation histories to UV through optical photometry, for an episode of star formation 100–200 Myr ago (Pipino et al., 2009). Optical imaging and integral field spectroscopy reveal a disturbed system with several bright ‘knots’ within its stellar envelope, of which one may be a second nucleus, multiple companions within 100 kpc, and extended, [O III] bright filaments (Soifer et al., 1996; Crawford & Vanderriest, 1996; Armus et al., 1999).
IRAS 091044109 is a cD galaxy within the rich cluster MACS J0913.74056 (Kleinmann et al., 1988; Hall et al., 1997; Farrah et al., 2004). This cluster is associated with spatially extended X-ray emission with a strong cool core (Fabian & Crawford, 1995; Crawford & Vanderriest, 1996). Other examples of cool-core clusters hosting powerful AGN at are known, including H 1821643 (Russell et al., 2010) and the Phoenix cluster (McDonald et al., 2015). Two cavities are visible in the X-ray emission, coincident with the radio hotspots (Hlavacek-Larrondo et al., 2012). IRAS 091044109 itself is luminous in the X-ray (Fabian et al., 1994). The soft X-ray emission is dominated by plasma with a temperature of 5 keV (e.g. Franceschini et al., 2000; O’Sullivan et al., 2012). A hard component starts to contribute above keV and dominates above keV. Two origins have been proposed for the hard component: the intrinsic AGN continuum transmitted along a line of sight absorbed by a column density of cm-2, or reflection from cold material surrounding the X-ray source. The latter possibility requires a Compton-thick column density ( cm-2) along the line of sight in order to completely obscure the intrinsic continuum. The X-ray-based determination of the intrinsic luminosity depends on which of these two scenarios dominates (e.g. Franceschini et al., 2000; Iwasawa et al., 2001; Piconcelli et al., 2007; Vignali et al., 2011; Chiang et al., 2013; LaMassa et al., 2014).
Other than being an example of a key phase in AGN evolution, IRAS 091044109 is an excellent candidate for being the most luminous Compton-thick quasar at . It may thus be one of the few Compton thick objects that is bright enough for probing the obscurer structure at multiple wavelengths, from the infrared (IR) through X-ray. A larger sample of luminous obscured quasars at (all of which are at least a factor of less luminous than IRAS 091044109) has been studied with NuSTAR by Lansbury et al. (2014, 2015), in addition to single-object studies at lower (; Gandhi et al. 2014), as well as higher redshift (; Del Moro et al. 2014). All targets in the NuSTAR survey of type 2 quasars have been found to have either Compton-thick obscuration, or high obscuration with column densities in the cm-2 range. While short NuSTAR observations typically yield only weak detections of these sources, several have sufficient photon statistics for modeling the obscurer in detail. Together with IRAS 091044109, they form a small but important sample of high-luminosity AGN that bridge the gap between well studied AGN in the local Universe (e.g., Brightman et al. 2015) and their counterparts at high redshift (e.g., Iwasawa et al. 2005; Stern et al. 2014).
This system has thus been the subject of several multi-wavelength studies (e.g. Vignali et al., 2011). In this paper we combine a new X-ray observation from NuSTAR and a new optical spectrum from Palomar with all available archival X-ray and IR data to study both the geometry of the AGN obscurer, and current star formation, in IRAS 091044109. We constrain the viewing angle, torus opening angle, and other geometric properties of the IR and X-ray emitting AGN obscurer, and clearly detect ongoing star formation in the host galaxy. We adopt a position for IRAS 091044109 of 09h13m45.49s, +40d56m28.22s (J2000) and assume = 70 km s-1 Mpc-1, , . We quote all luminosities in units of erg s-1.
2. Observations
2.1. Infrared & Optical
We assembled IR data from several sources. Photometry at 3.6 and 5.8m from the Infrared Array Camera (IRAC, Fazio et al. 2004) on-board Spitzer (Werner et al., 2004) were obtained from Ruiz et al. (2010), and checked against the WISE public catalogues (Wright et al., 2010; Cutri et al., 2013). A spectrum from the Infrared Spectrograph (IRS, Houck et al. 2004) on Spitzer, spanning observed-frame 6-34m, was acquired from version LR6 of the Cornell Atlas of Spitzer/IRS Sources (CASSIS, Lebouteiller et al. 2011). The spectrum (AOR key 6619136) was taken in cycle 3 of Spitzer operations. The calibration of these data was checked against published Spitzer IRAC and MIPS data (Ruiz et al., 2010), and against WISE. Photometry at m, m and m were obtained from archival observations by the Photodetector Array Camera and Spectrometer (PACS, Poglitsch et al. 2010) on-board Herschel (Pilbratt et al., 2010). The raw data were reduced with version 14 of the Herschel Interactive Processing Environment (HIPE, Ott 2010), and flux densities were extracted using aperture photometry within HIPE. The m and m data were checked for consistency against the 60m and m data from the Infrared Astronomical Satellite (IRAS, Neugebauer et al. 1984), both from Wang & Rowan-Robinson (2010) and manual reprocessing of the IRAS data using the Scan Processing and Integration tool (SCANPI). Photometry at m, m and m were obtained from archival observations by the Spectral and Photometeric Imaging REceiver instrument (SPIRE; Griffin et al. 2010) onboard Herschel, and processed within HIPE. Finally, an 850m flux density was obtained from Deane & Trentham (2001). The photometry flux densities are presented in Table 1. The IRS spectrum is presented in Ruiz et al. (2013) and in the SED plot, where it is plotted as multiple photometric points.
Some IR data are not included in this compilation. We do not include data from WISE or IRAS since the Spitzer and Herschel data cover their wavelengths at higher sensitivity and improved spectral resolution. We also do not include data at wavelengths shortward of 3.6m. Our aim is to constrain the properties of the obscured AGN (in particular the geometry of the obscurer), and any ongoing star formation (see §3). The integrated emission from older stars is almost certainly negligible at observed-frame wavelengths of 3.6m and longer, but may contribute significantly at shorter wavelengths.
| Facility | Wavelength | Flux density |
|---|---|---|
| m | mJy | |
| Spitzer-IRAC | 3.6 | |
| Spitzer-IRAC | 5.8 | |
| Herschel-PACS | 70 | |
| Herschel-PACS | 100 | |
| Herschel-PACS | 160 | |
| Herschel-SPIRE | 250 | |
| Herschel-SPIRE | 350 | |
| Herschel-SPIRE | 500 | |
| JCMT-SCUBA | 850 |
We obtained an optical spectrum of IRAS 091044109 on UT 2014 December 23 using the Double Spectrograph (DBSP, Oke & Gunn 1982), a dual-beam spectrograph on the 5-m Hale Telescope at Palomar Observatory. Our spectrum complements that presented in Tran et al. (2000); their spectrum was taken in 112 minutes using LRIS on Keck, and so is deeper, but our spectrum extends Å further redward and was taken closer in time to the X-ray data. The night was photometric, albeit with seeing. We observed IRAS 091044109 for 500 s, split into two equal exposures. We used the 5500 Å dichroic, the wide longslit, the 600 grating on the blue arm of the spectrograph (blazed at 4000 Å; resolving power ), and the 316 grating on the red arm of the spectrograph (blazed at 7500 Å; ). The data were processed using standard procedures within the Image Reduction and Analysis Facility (IRAF) environment. Flux-calibration was calculated using observations of standard stars Feige 66 and Feige 110 from Massey & Gronwall (1990), obtained on the same night.
2.2. X-ray
IRAS 091044109 was observed with NuSTAR (Harrison et al., 2013) on 2012 December 26 with a total exposure of 15.2 ks (OBSID 60001067) as part of the NuSTAR program to observe type 2 QSOs Lansbury et al. (2014, 2015). The observation was coordinated with the Swift observatory, which observed the same target on 2012 December 25 (OBSID 00080413001). The total Swift/XRT exposure was 6.0 ks. The NuSTAR and Swift observations are sufficiently close in time that they provide a quasi-simultaneous snapshot of IRAS 091044109 across the broad 0.5–70 keV band. This observing strategy is typical for the NuSTAR snapshot survey of AGN in the nearby Universe (Baloković et al., in preparation). The Swift and NuSTAR data are presented here for the first time. All observations used in this paper are listed in Table 3.
The NuSTAR data were reduced in the manner described in Perri et al. (2014). We used HEASOFT v 6.16, NuSTARDAS v 1.4.1, and CALDB version 20150316, with a 50″ extraction radius. Following the event filtering, we extracted the source spectrum from a circular aperture centered on the peak of the point source. The background extraction region covered the free area of the same detector, excluding a region of 80″ radius around the source. The target is detected in the 10–50 keV band with signal-to-noise ratio of 10 in FPMA, and 8 in FPMB. The 10–50 keV (3–79 keV) background-subtracted count rates are 0.010 s-1 (0.034 s-1) and 0.008 s-1 (0.032 s-1). The spectrum and corresponding response files were generated using the nuproducts script. Spectra for each NuSTAR module are binned to a minimum of 20 counts per bin, and fitted simultaneously as described in §4. We allowed the cross-normalization factor to vary in all fits (with instrumental normalization of FPMA fixed at unity), and found it to be consistent with unity to within 5 % in all cases.
We used resources provided by the ASDC111http://www.asdc.asi.it/mmia/ for Swift/XRT data reduction. The spectrum was extracted from a region with a radius of 20″ centered on the brightest peak of emission, and the background was sampled from an annulus extending between 40″ and 80″ around the source. For spectral fitting we used the source spectrum binned to a minimum of 20 counts per bin before background subtraction. The Swift data photon statistics are well matched to those of the NuSTAR data.
We complement these data with archival X-ray data taken with Suzaku on 2011 November 18 (OBSID 706038010; 81 ks), and with Chandra on 2009 January 6 (OBSID 10445; 69 ks). We largely followed the processing steps of Chiang et al. (2013) for these datasets in order to facilitate a direct comparison of the results, so we refer the reader to their data section for details. The Suzaku data were reduced using standard procedures222http://www.astro.isas.jaxa.jp/suzaku/process/. No detection was achieved with the HXD/PIN, so we only made use of the soft X-ray data. The spectra were extracted from circular regions 100″ in radius, which includes most of the diffuse emission. Background spectra were extracted from emission-free areas of each XIS detector. The spectra from the two front-illuminated chips (XIS0 and XIS3) were coadded. We binned the spectra to a minimum signal-to-noise ratio of 3 and ignored any data outside of the 0.5–8.5 keV range.
The Chandra data were processed using CIAO version 4.6. We extracted the nuclear spectrum from a circular region 1″ in radius centered on the peak of the emission. Background was sampled from a ring with an inner radius of 2″ and an outer radius of 4″; in this way most () of the diffuse emission contribution to the unresolved central source is removed. Unlike all other instruments used in this work, which sample both the AGN and diffuse emission on 10″ scales, Chandra allows us to isolate the AGN-dominated core emission. In order to assess the contribution of diffuse emission in NuSTAR and Suzaku apertures, we also extracted Chandra spectra from circular regions with 50″ and 100″ radii. These extractions are used only in the comparison between instruments presented in § 4.4.
| Line | Flux | Rest EW |
|---|---|---|
| erg cm-2 s | (Å) | |
| S II 6734 | 2.24 0.15 | 58 20 |
| S II 6716 | 2.63 0.15 | 62 15 |
| N II 6583 | 6.44 0.62 | 141 15 |
| H 6563 | 8.24 0.44 | 183 14 |
| N II 6543 | 3.47 0.80 | 78 11 |
| Fe X 6374 | 0.60 0.20 | 17 10 |
| O I+S III 6300 | 1.42 0.30 | 40 17 |
| Fe VII 6087 | 0.77 0.27 | 23 13 |
| He I 5876 | 0.48 0.15 | 15 8 |
Note. — A higher resolution, deeper optical spectrum is available in Tran et al. (2000). We here present those lines that are uniquely present in our spectrum due to our longer wavelength coverage, plus two lines in the wavelength range in which our data overlap with Tran et al. (2000). See also Crawford & Vanderriest 1996; Soifer et al. 1996.
| Observatory | Observation | Exposure | Source Count |
|---|---|---|---|
| and Instrument | Start Date | (ks) | Rate ( s-1) |
| NuSTAR/FPMA | 2012-Dec-26 | 15.2 | |
| Swift/XRT | 2012-Dec-25 | 5.9 | |
| Suzaku/XIS1 | 2011-Nov-18 | 81.3 | |
| Chandra/ACIS | 2009-Jan-06 | 69.3 |
3. Infrared & Optical Analysis
We assume that the IR emission arises from a single episode of star formation and/or AGN activity. We then fit the IR data simultaneously with two grids of pre-computed radiative transfer models; one for dusty AGN (Efstathiou & Rowan-Robinson, 1995; Efstathiou et al., 2013) and one for starbursts (Efstathiou et al., 2000). A model set for old stellar populations is nor included, for the reasons given in §2.1. These models have been used previously in, e.g., Verma et al. (2002); Farrah et al. (2002, 2003, 2012); Efstathiou et al. (2013). The AGN models assume the dust geometry is a smooth tapered disk whose height, , increases linearly with distance, , from the AGN until it reaches a constant value. The dust distribution includes multiple species of varying sizes, and assumes the density distribution scales as . The AGN model parameters are: inner half-opening angle of the torus measured from pole-on (), viewing angle measured from pole-on (), ratio of inner to outer disc radius (), ratio of height to outer radius (), and equatorial optical depth at 1000Å (250 to 1250, defined in equations 1 & 2 of Efstathiou & Rowan-Robinson 1995, see also Efstathiou & Rowan-Robinson 1990). The starburst models combine the stellar population synthesis code of Bruzual & Charlot (2003) with a prescription for radiative transfer through dust that includes the effects of small dust grains and polycyclic aromatic hydrocarbons (PAHs) updated with the dust model of Efstathiou & Siebenmorgen (2009). The starburst model parameters are age (0–70 Myr), initial optical depths of the molecular clouds ( = 50, 75, and 100), and -folding timescale for the starburst ( Myr). In total there are 1680 starburst models and 4212 AGN models.
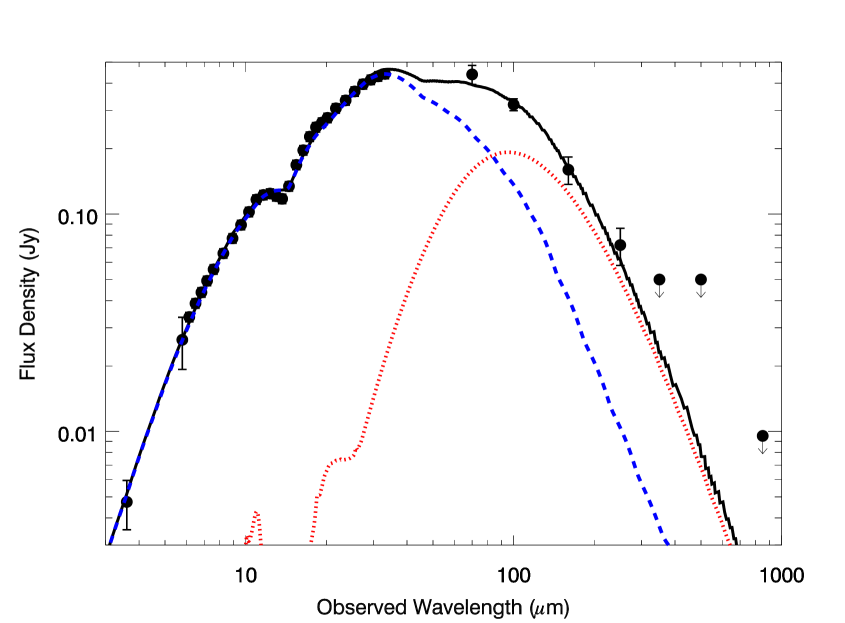
The best-fit IR SED is shown in Figure 1. The total IR (rest-frame 1-1000m) luminosity is erg s-1, with a contribution from the AGN of erg s-1. The starburst is required in the fit at confidence, with a luminosity of erg s-1, corresponding to a star formation rate of M⊙ yr-1. The uncertainties on these parameters are the 68% confidence intervals, evaluated using the method in Farrah et al. (2012).
The combination of a mid-IR spectrum with far-IR photometry allow constraints to be set on other model parameters. Since the IR data are however still relatively limited, we have deduced these constraints by considering all the individual solutions in weighted probability distribution functions, and so do not consider how these constraints may depend on each other. We have also not explored how these constraints depend on the choice of model set. In particular, we have not explored how these constraints may change if a clumpy, rather than smooth, dust distribution is assumed. With these caveats in mind, we present the following results. The starburst age is constrained (at 3) to be Myr. The line of sight viewing angle, to the IR-emitting torus is °. The half opening angle of the torus, °, is indistinguishable from . The inner to outer radius ratio of the torus is , while the ratio of the torus height to the outer radius is . We compare these values to those previously reported in the literature (Hines & Wills, 1993; Hines et al., 1999; Tran et al., 2000; Burtscher et al., 2013) in Sections 5.1 and 5.4.
The torus geometry assumed in the Efstathiou & Rowan-Robinson 1995 models means the mid-IR emission is anisotropic, with viewing angles closer to edge-on tending to suppress the mid-IR emission (Efstathiou, 2006; Efstathiou et al., 2014). The derived combination of torus geometry and viewing angle of IRAS 091044109 thus imply a (multiplicative) anisotropy correction to the AGN luminosity of . The derived intrinsic AGN infrared luminosity is thus erg s-1 and a total IR luminosity (assuming the starburst emission is isotropic) of erg s-1.
The optical spectrum is shown in Figure 2. From it, we derive . The optical spectrum shows multiple narrow emission lines (Table 2, see also Tran et al. (2000)). Analysis of the spectrum was conducted within IRAF. Lines were identified using line lists assembled from previous observations of starbursts and AGN (Farrah et al., 2005; Shirazi & Brinchmann, 2012). Line fluxes and equivalent widths were measured by marking two continuum points, one on each side of the line, and fitting a linear continuum. The errors were found by estimating the variance in the continuum and remeasuring the EW using the variance as the continuum level.
Our spectrum is consistent within the errors with that of Tran et al. (2000); given that their spectrum is of higher quality than ours we only comment on the lines in the additional wavelength coverage of our spectrum. We detect the canonical emission lines, including H, [N II] and [S II] lines. From our spectrum, IRAS 091044109 is unambiguously classified as a Seyfert using standard emission-line diagnostics (Baldwin et al., 1981), and lies well away from the regions proposed as harboring composite AGN/starburst systems (e.g. Kewley et al., 2001; Stasińska et al., 2006). In addition we detect two high excitation ‘coronal’ iron lines: [Fe VII]6087 and [Fe X]6375, at and significance, respectively. These iron lines have been seen in ULIRGs (Farrah et al., 2005) but are more commonly observed in supernova remnants and in the Solar corona (hence their name). They are rare in extragalactic objects (but see Osterbrock 1981; Reynolds et al 1997; Gelbord et al. 2009; Rose et al. 2015 for examples). They are discussed further in Section 5.4.

4. X-ray Analysis
4.1. Overview
We use Xspec (Arnaud, 1996) version 12.8.2 for spectral modeling of the NuSTAR, Swift, Suzaku, and Chandra data. To model the soft X-ray data we follow results from previous studies and use two mekal plasma components (Mewe et al., 1985; Liedahl et al., 1995) with temperatures determined directly from the data. In the fits to the (joint) data we keep the temperatures the same for all instruments but allow normalizations to vary independently, because different instruments’ point spread functions sample the diffuse emission differently, and spatial variation in temperature has previously been found (O’Sullivan et al., 2012). Other mekal parameters are kept fixed at the values determined in previous work: cm-3, and . Since much of the diffuse emission is subtracted from the small-scale Chandra spectrum, we set the normalization of one of the two mekal components to zero for these data, and model the residual plasma contribution with the remaining mekal component. Due to the limited quality of the Swift/XRT spectrum, we also use only a single mekal component to model it. All models include Galactic absorption ( cm-2; Kalberla et al. 2005), and the same redshift, , for all components.
To model the hard X-ray data from NuSTAR, Swift, Suzaku, and Chandra we use two model sets:
-
1.
TR – a phenomenological model consisting of two independent components, one transmitted (T) and one reflected (R). The T component is an absorbed power law modeled by Xspec model wabscabscutoffpl, which accounts for Compton scattering and has a fixed -folding scale of 200 keV. The R component is modelled using pexrav (Magdziarz & Zdziarski, 1995), and a narrow Gaussian emission line at 6.4 keV representing fluorescent iron K emission.
- 2.
The TR model has been used by many previous authors, so we employ it to allow for straightforward comparisons. It was predominantly used in one of two extremes, transmission-dominated (TD) and reflection-dominated (RD), where one of the components was assumed to be negligible. However, the key to insights into the properties of the X-ray obscurer is the ability to model both components (Yaqoob, 2012), unless the obscuration is so high ( cm-2) that only the R component is observable (e.g. Arévalo et al., 2014; Baloković et al., 2014; Gandhi et al., 2014; Annuar et al., 2015; Bauer et al., 2015). Here we start with two components and let the data determine if either component is negligible. This model does not have a physical geometry, but has nevertheless been used in the literature to account for spectral features attributed to the AGN torus. In particular, pexrav assumes a slab geometry rather than a torus, so the viewing angle changes the spectrum at the level of only a few percent over most of the 0–90° range. The viewing angle is kept fixed () because it cannot be interpreted in the context of the torus, so it should not be compared to other viewing angles discussed in this paper. This model also includes an unresolved Gaussian line fixed at keV ( keV), accounting for fluorescent emission of iron arising from the same material producing the component. We keep the elemental abundances in pexrav fixed at Solar values, and the normalization of the 6.4 keV line independent of the pexrav normalization.
In contrast, MYtorus and BNtorus are models for the obscurer with an observationally motivated geometry, that of a smooth toroidal obscurer. The geometry assumed in the MYtorus model is a torus with a fixed inner half-opening angle of °. The column density in the line of sight () is a function of viewing angle and varies from maximum for a viewing directly through the equator (where ) to zero when the line of sight just grazes the torus edge. In the BNtorus model the torus is approximated as a sphere with symmetric conical cutouts and the inner half-opening angle can be varied as a fitting parameter. The column density has a single value along any line of sight that intersects the torus; that is, as long as then the line-of-sight column density is equal to the equatorial column density . Since the normalizations of different spectral components are internally linked due to the obscurer geometry, two degrees of freedom () are removed from the fits with respect to the TR model. In both torus models the Fe K line strengths are self-consistently calculated.
We describe the TR model fits in §4.2 and the torus modeling in §4.3. The parameters of the X-ray models for the AGN are summarized in Table 4. We consider models for the diffuse emission separately in §4.4.
4.2. The TR Model
We first model only the simultaneous Swift and NuSTAR spectra, which are well matched in signal-to-noise ratio across the broad 0.5–50 keV bandpass. Fitting the TR model, we find that the photon index, , cannot be constrained. Any photon index in the range fits the data equally well as the canonical (e.g., Dadina 2008; Rivers et al. 2013; Malizia et al. 2014). Fixing at 1.8, the best fit () is for a model with the intrinsic power-law continuum absorbed by cm-2, with contributions from both T and R components. However, valid solutions exist with no absorbed component present. In the best-fit solution, the T component dominates at energies above 20 keV. Assuming a harder photon index () leads to TD solutions, while a softer assumed index () gives RD solutions. In either case, increases by less than 1 with respect to the best fit. The diverse range of models consistent with this dataset constrains the intrinsic 2–10 keV luminosity to lie between erg s-1 and erg s-1.
To provide more stringent constraints on the models, we model the NuSTAR data (taken December 2012) together with archival Suzaku and Chandra data (taken November 2011 and January 2009, respectively). The Swift, Suzaku and Chandra data are consistent with each other, but because of poorer photon statistics we exclude the Swift data from modeling. With the additional Suzaku and Chandra data, the constraints on the photon index and the absorption column improve significantly. Note that in this case, the very high signal-to-noise ratio of the soft X-ray data constrains models better than the NuSTAR data in the overlapping energy range.
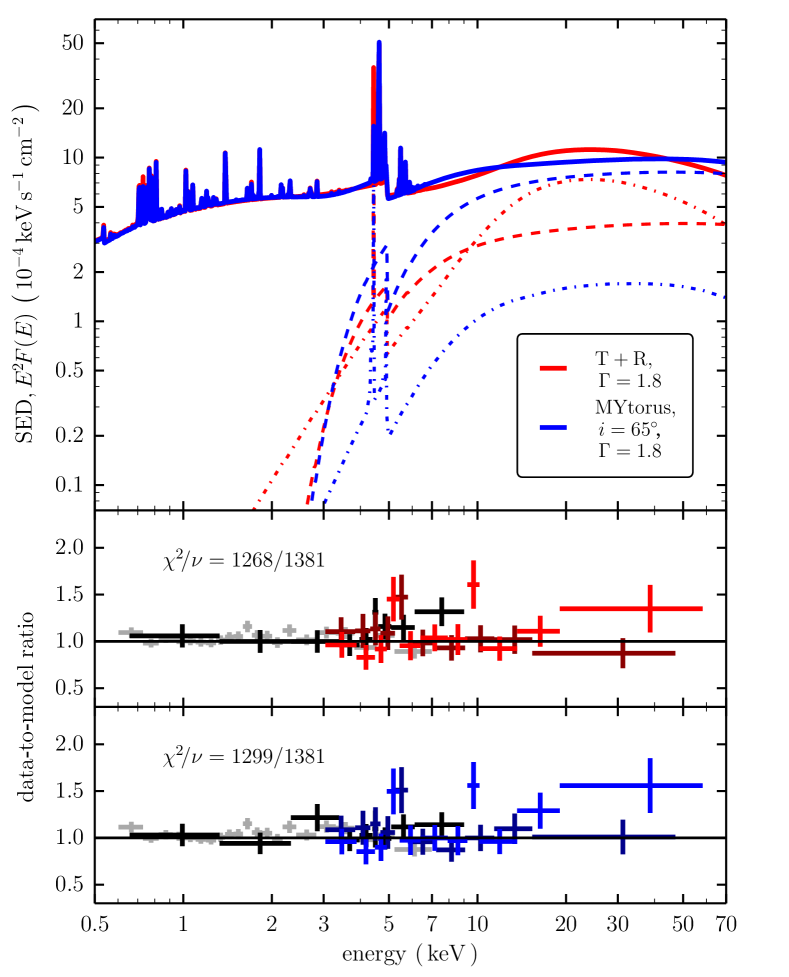
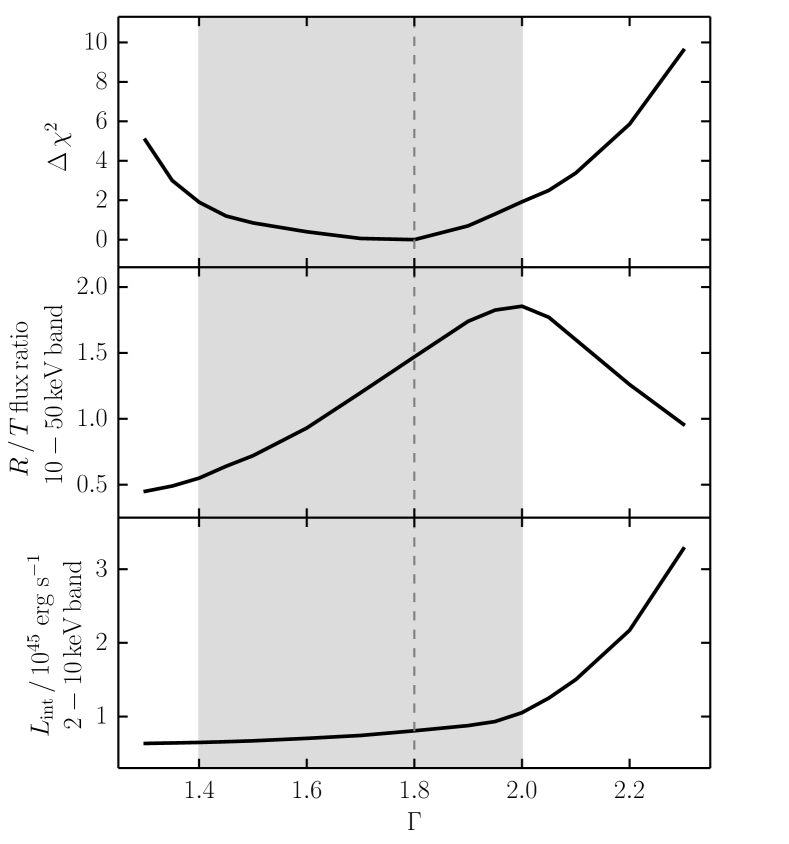
We find the best fit () for and cm-2. This model is shown in Figure 3. The soft X-ray data alone drive the fit toward hard photon indices () and a TD model (Chiang et al., 2013). The addition of NuSTAR data constrains to a more typical value and results in a solution where T and R components contribute to the hard X-ray flux nearly equally. Figure 4 illustrates how the , the relative contributions of T and R components, and the implied intrinsic luminosity vary within the 90% confidence interval for the photon index (). The intrinsic 2–10 keV luminosity of the best-fit model is erg s-1.
Additional constraints can be drawn from the equivalent width (EW) of the neutral Fe K line333We evaluate the equivalent width of the Fe K line by taking the ratio of line flux to flux density of the AGN continuum components only, i.e., excluding the plasma components that otherwise dominate up to the Fe K line energy at 6.4 keV, except for the small-scale Chandra spectrum. We use a band spanning rest-frame 5.7–6.7 keV.. The low equivalent width of this line ( keV) in the NuSTAR, Swift, and archival data, argues against an RD scenario, since RD spectra usually have Fe K EWs of 1 keV. On the other hand, a weak iron line could also arise if the iron abundance is 30% Solar, which is plausible given that sub-Solar abundance has been inferred for the diffuse plasma (e.g., O’Sullivan et al. 2012). Constraints based on the Fe K line are discussed in Chiang et al. (2013); due to the inferior spectral resolution of NuSTAR compared to Chandra around 6.4 keV ( keV compared to keV), the new data do not alter their conclusions.
4.3. The Torus Models
We start by applying the MYtorus model to the simultaneous Swift and NuSTAR data. Due to limited photon statistics we can only draw tentative conclusions. If we fix to 1.8 and assume that the torus is viewed edge-on () then a good fit () is found for cm-2. In this case the equatorial column density of the torus, , equals the column density observed along the line of sight to the nuclear X-ray source, . If we let viewing angle vary then this implies lower , but for the fits only produce a lower limit on of about cm-2. There is perhaps a slight preference for viewing angles closer to (i.e., the edge of the torus in the MYtorus model), but the corresponding change in , relative to edge-on inclination, is less than 2. The solutions are generally RD, with EWs of Fe K of keV. The implied intrinsic luminosity in the 2-10 keV band is erg s-1.
Applying the MYtorus model to the joint NuSTAR, Suzaku, and Chandra dataset, we find a preference away from edge-on inclination. Due to the geometry assumed in the model, viewing angles within of (where the line of sight skims the torus) require caution, as changes steeply with viewing angle – this can lead to unreasonably tight constraints on some model parameters. We therefore fix to . The best fit is an effectively TD model, with the R component contributing 20% to the 10–50 keV band and an Fe K EW of keV. This is consistent with the low Fe K EW found with the same data using the TR model. The equatorial column density of the torus, , is cm-2 for in the range . The best-fit photon index is 1.6, but this is at the lower end of the parameter domain for the MYtorus model, so a true lower limit to the confidence interval cannot be determined. Assuming a statistically acceptable value of leads to cm-2. The intrinsic 2–10 keV luminosity from this model is erg s-1. This fit is shown in Figure 3.
Applying the BNtorus model to the Swift and NuSTAR data, we find an equally good fit as the MYtorus model. Assuming , the best fit () is found for cm-2. Again, this is an RD solution, with the constrained from the upper side only by the parameter domain limit ( cm-2). We find that and cannot be constrained by the data simultaneously; however, fixing always leads to lying between °and edge-on. The implied 2–10 keV intrinsic luminosity lies between erg s-1 and erg s-1.
The BNtorus model applied to the joint NuSTAR, Suzaku, and Chandra data does not provide simultaneous constraints on and either. They are constrained in the sense that their difference is for any one assumed angle within their respective parameter ranges; 18–87∘ for and 26–84∘ for , which is consistent with the Sy2 classification (i.e. that the optical BELR is not seen in direct light). We find best fits () consistent with and cm-2 for a broad range of viewing angles. Intrinsic 2–10 keV luminosities for these solutions are in the range erg s-1. Although the T and R components, as well as iron lines, cannot be separated in this model, equivalent phenomenological solutions reveal that the T component dominates the keV flux. The best-fit solution is therefore qualitatively similar to that obtained from the MYtorus model.
| Model | Data: NuSTAR with | |
|---|---|---|
| Parameter | Swift/XRT | Suzaku and Chandra |
| TR model | ||
| d.o.f. | 76.7/63 aaEvaluated for and (in the same units); for the parameters’ ranges shown here. | 1268/1381 |
| MYtorus model | ||
| d.o.f. | 78.8/65 | 1299/1381 |
| 1.8 (f) | bbBest fit is , which is the edge of the parameter domain for . | |
| ccFor , (in the same units). | ||
| 90 (f) | 65 (f) | |
| BNtorus model ddSince angles and cannot be constrained independently, we express constraints on in terms of . | ||
| d.o.f. | 73.9/64 | 1276/1379 |
| 1.8 (f) | ||
Note. — Spectral parameters are: intrinsic photon index (), intrinsic 2–10 keV luminosity (, in units of erg s-1), line-of-sight column density (, in cm-2), equatorial column density (, in cm-2), viewing angle, (, in deg.), and torus half-opening angle (, in deg.). Numbers in square brackets denote ranges and fixed parameters are followed by (f).
4.4. Diffuse Emission Models
and Multi-epoch Flux Comparison
In the modeling presented in §4.2 and §4.3, the diffuse emission was included but the focus was on the AGN emission. It is however worth briefly discussing the diffuse emission models, for two reasons. First, while the literature is consistent in modeling the extended emission, details and best-fit parameters differ between studies. Second, with relatively high temperatures, the diffuse plasma emission significantly contributes to the emission into the NuSTAR band, up to keV.
As the extended emission exhibits significant spatial variations in plasma temperature (O’Sullivan et al., 2012), a cross-instrument comparison based on a simple one- or two-component mekal model is only approximate. However, we did not find it necessary to add complexity to the model based on fitting statistics or structured residuals. We find best-fit plasma temperatures in the range of 1–4 keV and 5–8 keV, based mostly on NuSTAR and Suzaku data. For any single model fit (recalling that we only use a single mekal model for both the Chandra and Swift/XRT data, see §4.1), the typical 90% uncertainty on the temperature is 0.4–1.5 keV when NuSTAR is combined with the archival data, and approximately 2 keV when combined with Swift/XRT. These results are similar to all previous studies.
The most direct comparison can be made between NuSTAR and Chandra spectra extracted from the same 50″ circular region. In this case we find that the total flux in the 3–8 keV band is erg s-1 cm-2 in both instruments. Assuming that the Swift/XRT extraction contains most of the diffuse emission, its 3–8 keV flux of erg s-1 cm-2 is also consistent with NuSTAR within the typical spread found in other simultaneous observations. The cross-normalization between the two modules of NuSTAR, as well as those of Suzaku, is within 5% of unity in all models. We thus find that no significant spectral variability occured between Chandra, Suzaku, NuSTAR and Swift observations, and that all cross-normalizations discussed here are well within their respective expectations (Madsen et al., 2015).
The extended soft X-ray emission spans several tens of kpc (O’Sullivan et al., 2012), and therefore should not vary on a timescale spanning the observations used here. We confirm this based on spectra extracted from large circular regions (100″ for Suzaku and Chandra). The small-scale Chandra spectrum (within 1″) is dominated by AGN emission above 3 keV according to nearly all models, with a flux in the 3–8 keV band of erg s-1 cm-2. In the NuSTAR spectra, the diffuse emission contributes approximately 10% of the flux even at 10 keV.
The 3–8 keV flux from the best-fit AGN components in different models ranges from erg s-1 cm-2 to erg s-1 cm-2, which is consistent with the nuclear Chandra flux. With our 2–10 keV flux of erg s-1 cm-2 (AGN components alone, based on the NuSTAR data), we find excellent agreement with the flux estimated by Chiang et al. (2013) assuming two different AGN models based on Chandra and Suzaku data, ranging over erg s-1 cm-2. The XMM-Newton-based estimate of Piconcelli et al. (2007), erg s-1 cm-2, is in apparent disagreement with ours, although their prediction for hard X-ray flux (20–30 keV) matches the NuSTAR-detected flux well. A discrepancy of this magnitude may be due to the PSF of XMM-Newton sampling the diffuse emission differently, resulting in different best-fit models; however, variability of the AGN cannot be excluded.
AGN variability is also suggested by the hard X-ray data, where contamination by the diffuse emission is negligible. Both the NuSTAR detection and the Suzaku/PIN upper limit put the 20–100 keV flux ( erg s-1 cm-2 and erg s-1 cm-2) below the BeppoSAX detection (Franceschini et al., 2000) at erg s-1 cm-2. The BeppoSAX flux in the 20–30 keV band, erg s-1 cm-2 (Piconcelli et al., 2007) exceeds the Swift/BAT detection limit of erg s-1 cm-2 (Vignali et al., 2011), as well as most extrapolations from later soft X-ray studies (e.g., erg s-1 cm-2 by Chiang et al. 2013, erg s-1 cm-2 by Piconcelli et al. 2007) and the NuSTAR-detected flux of erg s-1 cm-2. While it is possible that the high BeppoSAX flux was due to contamination by a nearby hard X-ray source (Piconcelli et al., 2007; Vignali et al., 2011; Chiang et al., 2013), the possibility of variability in luminosity and/or line-of-sight column density is naturally explained in our models, where the transmitted (T) component dominates the AGN spectrum.
5. Discussion
The IR, optical and X-ray data together form a consistent picture of the central engine in IRAS 091044109. Starting with the IR data, we build this picture in §5.1 through §5.4.
5.1. The Infrared Data
Our results are consistent with previous studies that mark IRAS 091044109 as AGN-dominated (Rowan-Robinson, 2000; Sargsyan et al., 2008; Rowan-Robinson & Wang, 2010; Ruiz et al., 2013). By modeling the IRS spectrum together with longer wavelength data up to 1000 m we draw several new constraints. We clearly detect ongoing star formation in IRAS 091044109 (see also Han & Han 2012). The star formation rate, at M⊙ yr-1, is consistent with rates seen in ULIRGs (Farrah et al., 2003) and suggests that IRAS 091044109 is going through a significant episode of star formation despite the dominance of the AGN in the IR. The excellence of the fit is consistent with our initial assumption that there is only one current episode of star formation in IRAS 091044109. Compared to the rate derived from optical observations (Bildfell et al., 2008) it implies that optical data underestimate the star formation rate in IRAS 091044109 by approximately a factor of three.
The upper limit on the age of the starburst of 50 Myr is inconsistent with the range of 70–200 Myr derived by Pipino et al. (2009). Moreover, the fit to the IR SED does not require a contribution from a second, older starburst. It is unlikely that this inconsistency arises due to model degeneracies in the IR SED fitting, since we consider all possible solutions when deducing the starburst age constraint. Instead, this implies that only the star formation seen by Bildfell et al. (2008) contributes to the IR emission, with no contribution from the event inferred by Pipino et al. (2009). Furthermore, since the radio jets have an age of 100–160 Myr (O’Sullivan et al., 2012), it is unlikely that the ongoing star formation was triggered by the jets, or by the event that triggered the jets. This suggests that IRAS 091044109 is currently going through a second major epoch of luminous activity in the last 200 Myr. This is consistent with the relatively small amount of molecular gas in this system (Evans et al., 1998; Combes et al., 2011), and suggests that IRAS 091044109 will soon become a quiescent galaxy. The upper limit on the starburst age is also consistent with the absence of Ca absorption in the optical spectrum, which suggests a relative dearth of A-type stars.
We cannot, however, set useful constraints on the spatial scale of the starburst. At , 1″ corresponds to 5.7 kpc. Compared to the spatial resolution of the IRS (″ and ″ for the two low-resolution modules), and 5–10″ for PACS, this gives a spatial resolution of 21–39 kpc. We thus cannot say if the star formation is nuclear, spread throughout the host, or some combination of the two.
Our study is the first to set IR-based constraints on the geometry of the AGN obscurer; assuming the geometry in the Efstathiou & Rowan-Robinson 1995 models holds, then we derive and . These values are consistent with the requirement, from the Sy2 classification, that no broad lines are visible in direct light, i.e. that . Constraints on the geometry of the optical obscurer have been set, though these constraints depend on the degree of polarization and the assumed model (e.g. Brown & McLean 1977); Hines et al. (1999) obtain and , while Tran et al. (2000), who find a higher polarization, argue for and (see also Hines & Wills 1993). Assuming that the IR and optical obscurers are co-aligned, and that , then our values are more consistent with those of Hines et al. (1999). We find, however, that , whereas both Hines et al. (1999) and Tran et al. (2000) argue that is less than , by and , respectively. Such a difference is not entirely inconsistent with the IR-derived values, but it is also plausible that the optical obscurer has a smaller half-opening angle than the IR obscurer.
5.2. The X-ray Data
We start by summarizing the X-ray analysis presented in § 4. Our X-ray modeling can be separated into two branches: the simultaneous Swift/XRT and NuSTAR data, which feature a constant and relatively low signal-to-noise ratio across the 0.5–50 keV energy range, versus the joint NuSTAR and archival Chandra and Suzaku data, among which differences in constraining power are large and complex, and the NuSTAR contribution is smaller. The latter dataset prefers Compton-thin TD models with cm-2, including a tilted torus solution in which exceeds the Compton-thick threshold. The Swift/XRT and NuSTAR data lead to Compton-thick RD solutions for the AGN with each of the models, implying significantly higher intrinsic luminosity. Despite the possible issue of non-simultaneity, we consider the joint NuSTAR, Chandra and Suzaku dataset to be more reliable and therefore base our further discussion only on the results it provides.
We started with the TR models; the NuSTAR detection disfavors the scenario where a hard, luminous and strongly absorbed T component dominates the flux above 10 keV. The preference for softer photon indices rules out the hard values () discussed in, e.g., Piconcelli et al. (2007) and Chiang et al. (2013). Dominance of the R component in the hard X-ray band is not favored either, as the EW of Fe K is relatively low. Instead, IRAS 091044109 resembles heavily obscured AGN in the nearby Universe, in which both T and R components contribute to the X-ray spectrum in the NuSTAR band (e.g., Puccetti et al. 2014, Koss et al. 2015, Baloković et al., in preparation). Both in terms of spectral components and data quality, the constraints are similar to the type 2 quasars Mrk 34 (Gandhi et al., 2014) and SDSS J12184706 (Lansbury et al., 2015), although both of those objects likely have higher line-of-sight column densities than IRAS 091044109. The shapes and relative contributions of the T and R components depend on the geometry of the obscurer; however, the TR model is only approximate, and more appropriate torus models are needed in order to derive physical constraints.
Turning to the torus models; modulo the difference in the assumed geometry and the dependence of on the viewing angle, the parameters inferred from fitting the MYtorus and BNtorus models to the combined X-ray dataset are indistinguishable. Both are consistent with scenarios where the line of sight skims the edge of the torus, thus giving rise to a Sy2 classification only by a few degrees. Moreover, both imply intrinsic luminosities in the 2–10 keV band in the range 1–2 erg s-1. Notably though, the NuSTAR data are not decisive. With the NuSTAR data there is less of a gradient toward hard photon indices. However, with the assumptions used in this analysis, the same solutions can be found from the archival data alone, albeit with larger uncertainties. Relaxing the assumed spectral parameters of the plasma model for the soft X-ray part of the spectrum creates severe degeneracies such that the model becomes RD for hard , i.e., opposite of the behaviour described in §4.2. Although fluxes in overlapping spectral bands between NuSTAR, Swift, Suzaku, and Chandra are consistent (see § 4.4), spectral variability between the observations and the resulting biases in joint fitting cannot be fully excluded. Despite its coverage above 10 keV, the current NuSTAR data are insufficient to uniquely constrain the AGN spectrum, so the fits remain susceptible to the assumptions in modeling the soft X-ray data.
5.3. The X-ray & Infrared Data
We now consider the X-ray and IR AGN torus models together. A cautionary note is warranted: the models for the X-ray include gas but not dust, while the models for the IR emission include only dust. In considering the two together we are thus comparing different structures.
We first compare the derived X-ray and IR luminosities. Gandhi et al. (2009) have derived a relationship between 2-10 keV luminosity and 12.3 m luminosity density for Seyferts, albeit using a sample more than two orders of magnitude less luminous than IRAS 091044109, on average. Taking the m AGN luminosity density from Figure 1 and translating it to a predicted 2–10 keV luminosity using the Gandhi et al. (2009) relationship yields erg s-1, a factor of higher than the 2–10 keV luminosity obtained from the torus models. Gandhi et al. (2009) also see that the type 2 quasars in their sample have a lower X-ray luminosity than is predicted by their relation, and argue that the reason for this is nuclear star formation that contaminates the 12.3 m luminosity density. This however is an unlikely explanation for why IRAS 091044109 deviates from the relation, since the star formation in IRAS 091044109 is an order of magnitude less luminous than the AGN (the predicted m luminosity density of the starburst is even less than that of the AGN, but luminosities at specific wavelengths are less robust than total IR luminosities, so we are hesitant to make this comparison). This suggests that the proportionality between intrinsic X-ray and mid-IR (e.g., m) luminosities for AGN may flatten at high luminosities (e.g., Stern 2015, but see also Asmus et al. 2015), or that a different relation is at work.
Turning to a comparison of the X-ray and IR geometries; it is reasonable to expect that the AGN structures producing the IR and the X-ray spectra are coaligned, which would make their respective viewing angles similar. Moreover, it is reasonable to expect their half-opening angles to be similar, motivated by comparisons of opening angles determined independently from X-ray and IR data (Brightman et al. 2015, Baloković et al. 2016). While the high X-ray luminosity of IRAS 091044109 would make it an excellent test for the trend of decreasing torus covering factor with increasing X-ray luminosity observed for Compton-thick AGN by Brightman et al. (2015), our modeling indicates that its line-of-sight obscuration is not significantly above the Compton-thick threshold, nor is the torus viewed close to edge-on. In this case, an independent constraint on the opening angle from the X-ray data would require a longer NuSTAR observation than the 15 ks presented here. For example, an exposure of 100 ks would provide 10 energy bins over the 10–50 keV band with signal-to-noise ratio better than 3, sufficient to constrain the photon index within 0.1, and the torus opening angle within approximately 20°(quoting 90% confidence intervals).
Coalignment of the IR and X-ray tori is consistent with the MYtorus and BNtorus results. In the MYtorus model, the half-opening angle, is fixed to 60∘, which is (just) within the 3 range of the IR-derived torus half-opening angle. Using MYtorus, we find that viewing angles close to 60° fit the joint X-ray dataset slightly better than edge-on ones. This is again just consistent with the result from the IR-based torus models. A useful constraint on the viewing angle can however be obtained only if the equatorial column density of the torus is assumed. For a borderline Compton-thick torus ( cm-2) and the best-fit photon index (), . If however we use , then . The difference in for these two cases is negligible. This value of is still consistent with the Sy2 classification, and (within the joint error budget) with the IR-derived value, but shows that with the current data MYtorus constrains the geometry of the X-ray obscurer only weakly.
The BNtorus constraints are stronger. Both and can be varied, but they cannot be independently constrained with the X-ray data. With reasonable assumptions, however, they are both consistent with the IR-based modeling results. If we fix to 39°, as obtained from the IR modeling, then the best fit is found for . This combination of and is within of the IR-based geometry, and represents a broad minimum in (1274, for 1379) over the allowed range for those angles. In this case, we find and cm-2.
Finally, the inferred bolometric luminosity from the X-ray models is consistent with that inferred from the IR models. Assuming an X-ray to bolometric correction of 50–130 (Marconi et al., 2004; Vasudevan & Fabian, 2007; Lusso et al., 2012) leads to an estimate of erg s-1, based on the X-ray modeling alone. Instead starting from the anisotropy-corrected IR AGN luminosity and assuming that 30% of the bolometric emission emerges in the IR (Risaliti & Elvis, 2004) yields erg s-1. Disregarding the anisotropy correction gives a still-consistent erg s-1.
5.4. The X-ray, Infrared, & Optical Data
Finally, we fold in constraints from the optical data. The high excitation iron lines in Figure 2 have three possible origins; a ‘Coronal Line Region’ (CLR) intermediate in distance between the broad and narrow line regions, the inner wall of a dusty torus, and the ISM several kpc from a ‘naked’ Seyfert nucleus (Korista & Ferland, 1989; Penston et al, 1984; Murayama & Taniguchi, 1998). The third of these possibilities predicts that [Ne V] 3426 will be 12 times stronger than [Fe X] 6375. This criterion is, at face value, consistent with our spectrum. If however we consider that [Fe X] 6375 is almost certainly contaminated by [O I] , and take this contamination into account by assuming [O I] /[O I] then the [Ne V] 3426/[Fe X] 6375 ratio in IRAS 091044109 rises to . Moreover, the IR-luminous nature of IRAS 091044109 argues that an origin in a CLR and/or in a dusty torus is more plausible.
The detection of [Fe X]6375 but not [Fe XIV]5303, if not due to differential obscuration between 5300Å and 6400Å, implies a range in hydrogen density along the line of sight of , and a line of sight to a distance from the central ionizing source of 0.2–20 pc (Ferguson, Korista & Ferland, 1997). We also note that the absence of both a 4000Å break and stellar absorption features is consistent with a large population of young stars.
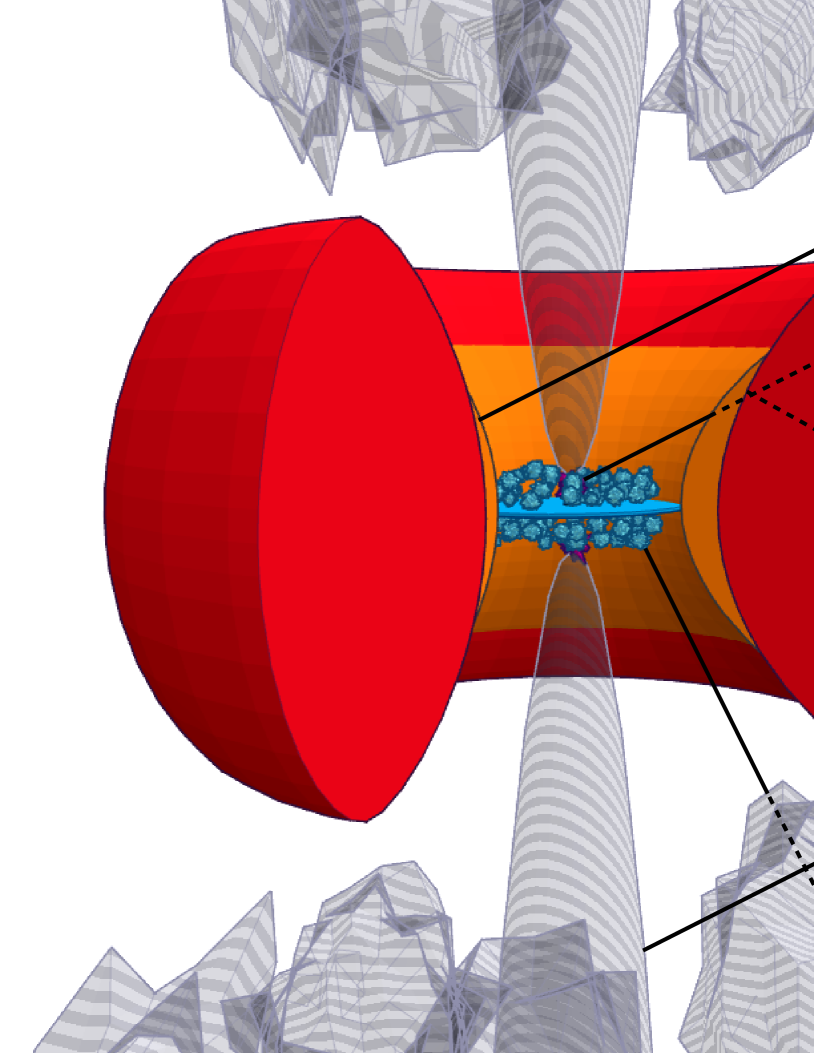
Combining the constraints from the IR, optical, and X-ray data is fraught with issues since the assumptions in the models were made without regard to each other. Moreover, the coronal iron lines are detected at just under significance in our spectrum. Nevertheless, the inference from the coronal iron lines of ‘just’ seeing the inner wall of the torus is consistent with a line of sight that skims the torus – the CLR is visible in direct light but the BLR can only be seen in scattered light (Tran et al., 2000). Moreover, the viewing angles inferred from the IR, optical, and X-ray data are consistent. Assuming that the geometry of the Efstathiou & Rowan-Robinson (1995) models is correct, this places the bulk of the dust column that comprises the IR-emitting torus to within a vertical height of pc of the nucleus. The X-ray obscurer is thus plausibly within this distance, also. The outer ‘edge’ of the torus is then within 125 pc of the nucleus and the inner edge is within 2 pc (see also Taniguchi et al. 1997). A sketch of this geometry is shown in Figure 5. We do not draw detailed comparisons with literature values for AGN geometries due to the aforementioned issues with combining the datasets, but it is notable that the inner edge constraint is comparable to, though perhaps slightly larger than, that seen in AGN with similar luminosities in Burtscher et al. 2013.
6. Conclusions
We have conducted a study of IRAS 091044109, an obscured hyperluminous quasar at , using X-ray data from NuSTAR, Swift, Suzaku and Chandra, infrared data from Spitzer and Herschel, and an optical spectrum from Palomar. We apply radiative transfer models to the infrared data to measure rates of ongoing star formation in the host galaxy, and to constrain the properties of the infrared obscurer around the AGN. We apply two types of models to the X-ray data – a TR (phenomenological) model and the MYtorus/BNtorus (geometrical) models – to constrain the properties of the X-ray obscurer. We then fold in a distance constraint from the optical spectrum to construct a picture of the geometry of the structure around the AGN in this archetype object. Our conclusions are:
1 - The infrared data can be reproduced by a combination of an AGN and a starburst. The total infrared (rest-frame 1-1000m) luminosity is erg s-1, with a contribution from the AGN of erg s-1. The starburst is required in the fit at confidence, with a luminosity of erg s-1, corresponding to a star formation rate of M⊙ yr-1. Accounting for the anisotropic emission in the AGN models leads to an intrinsic AGN infrared luminosity of erg s-1 and a total infrared luminosity (assuming the starburst emission is isotropic) of erg s-1. The ratio between the mid-infrared and 2-10 keV luminosities may deviate from that seen in lower luminosity Seyferts, consistent with an intrinsically different relation at very high luminosities.
2 - The infrared AGN torus model has a viewing angle (from pole-on) of and a half-opening angle of . The starburst model is consistent with an age for the starburst of . The AGN model parameters are consistent with the requirement, from the Sy2 classification, that no broad lines are visible in direct light, i.e. that . They are also consistent with the geometry of the (assumed) biconical structure giving rise to the optical emission lines. The star formation rate is comparable to those seen in lower redshift ULIRGs, and suggests that the host of IRAS 091044109 is going through a significant stellar mass assembly event. The age constraint is however inconsistent with both the age of the radio jets (120–160 Myr) and the age of a previous starburst event (70–200 Myr). This suggests that IRAS 091044109 underwent at least two epochs of luminous activity in the last Myr: one approximately Myr ago, and one ongoing.
3 - The X-ray model fits are consistent with and cm-2 (TR: and cm-2; torus models: and cm-2). The soft X-ray data alone drive the fit toward hard photon indices () and a TD solution, but the addition of NuSTAR data results in a solution where T and R components contribute at comparable levels, and rules out an RD scenario in which line-of-sight obscuration and intrinsic luminosity would be much higher.
4 - The constraints on the AGN obscurer geometry from the X-ray data are, with reasonable assumptions, consistent with those inferred from the infrared data. Fixing to 39∘ in the BNtorus model gives a best-fit viewing angle of . This combination of and coincides with a broad minimum in for all the BNtorus model fits, and is within of the IR-based half-opening and viewing angles. The MYtorus model constraints are similar, though weaker. The X-ray and infrared torus models are thus both consistent with scenarios where the line of sight viewing angle is close to the half-opening angle. The data do not favor extreme geometries, such as edge-on viewing angle, or tori that are disk-like () or sphere-like (). This ‘skimming’ of the edge of the torus by the line-of-sight viewing angle suggests that, had IRAS 091044109 been viewed at a viewing angle smaller by only a few degrees, it would have been classified as a broad-line object in direct light.
5 - The constraints on the bolometric luminosity of IRAS 091044109 from the X-ray and infrared data are also consistent with each other. The intrinsic 2–10 keV luminosity lies in the range 1–2 erg s-1. Assuming a bolometric correction of 50–130 leads to an estimate of erg s-1. Instead starting from the intrinsic AGN luminosity derived from IR modeling, and assuming that 30% of the bolometric emission emerges in the infrared, yields erg s-1.
6 - The detection of high excitation iron lines in the optical spectrum provides further constraints on the geometry of the AGN obscurer. If these lines arise in a Coronal Line Region (CLR) then their detection is consistent with a line of sight that skims the torus - the CLR is visible in direct light but the BLR can only be seen in scattered light. Taking the distance constraints from the detection of Fe X6374 but not Fe XIV5303 then places the bulk of the dust column that comprises the IR-emitting torus to within a vertical height of 20 pc of the nucleus. The X-ray obscurer is thus plausibly within this distance, also. Assuming that the geometry of the infrared model is correct then places the outer ‘edge’ of the IR-emitting torus within 125 pc of the nucleus and the inner edge within 2 pc. These values have large systematic uncertainties that are difficult to estimate, and are based on the aforementioned combining of assumptions across disparate models.
7 - The joint X-ray dataset, despite its broadband coverage, is insufficient to provide constraints on the AGN torus geometry without keeping some model parameters fixed, and/or without constraints from the infrared and optical data. The 15-ks NuSTAR observation, despite the detection above 10 keV, does not constrain the AGN spectrum of IRAS 091044109 substantially better than the archival data below 10 keV. The joint X-ray dataset gives less of a gradient toward hard photon indices, however, similar solutions can be found from the archival data alone, albeit with larger uncertainties. Moreover, both and cannot be independently constrained. Despite its coverage above 10 keV, the current NuSTAR data are not of sufficient quality to uniquely constrain the AGN spectrum, so the fits remain susceptible to assumptions. A longer NuSTAR observation of IRAS 091044109 is essential for constraining the structure of the torus directly from the X-ray band.
References
- Alatalo et al. (2015) Alatalo, K., Lacy, M., Lanz, L., et al. 2015, ApJ, 798, 31
- Alexander et al. (2005) Alexander, D. M., Bauer, F. E., Chapman, S. C., et al. 2005, ApJ, 632, 736
- Alexander & Hickox (2012) Alexander, D. M., & Hickox, R. C. 2012, New Astronomy Reviews, 56, 93
- Annuar et al. (2015) Annuar, A., Gandhi, P., Alexander, D. M., et al. 2015, ApJ, 815, 36
- Arévalo et al. (2014) Arévalo, P., Bauer, F. E., Puccetti, S., et al. 2014, ApJ, 791, 81
- Armus et al. (1999) Armus, L., Soifer, B. T., & Neugebauer, G. 1999, Ap&SS, 266, 113
- Arnaud (1996) Arnaud, K. A. 1996, in ASP Conf. Ser. 101: Astronomical Data Analysis Software and Systems V XSPEC: The First Ten Years, p. 17
- Asmus et al. (2015) Asmus, D., Gandhi, P., önig, S. F., et al. 2015, MNRAS, 454, 766
- Baldwin et al. (1981) Baldwin, J. A., Phillips, M. M., & Terlevich, R. 1981, PASP, 93, 5
- Balog et al. (2014) Balog, Z., Müller, T., Nielbock, M., et al. 2014, Experimental Astronomy, 37, 129
- Baloković et al. (2014) Baloković, M., Comastri, A., Harrison, F. A., et al. 2014, ApJ, 794, 111
- Baloković et al. (2016) Baloković, M., et al., 2016, ApJ, submitted
- Bauer et al. (2015) Bauer, F. E., Arévalo, P., Walton, D. J., et al. 2015, ApJ, 812, 116
- Béthermin et al. (2012) Béthermin, M., Le Floc’h, E., Ilbert, O., et al. 2012, A&A, 542, A58
- Bildfell et al. (2008) Bildfell, C., Hoekstra, H., Babul, A., & Mahdavi, A. 2008, MNRAS, 389, 1637
- Bridge et al. (2013) Bridge, C. R., Blain, A., Borys, C. J. K., et al. 2013, ApJ, 769, 91
- Brightman et al. (2015) Brightman, M., Baloković, M., Stern, D., et al. 2015, ApJ, 805, 41
- Brightman & Nandra (2011) Brightman, M., Nandra, K., 2011, MNRAS, 413, 1206
- Brown & McLean (1977) Brown, J. C., & McLean, I. S. 1977, A&A, 57, 141
- Bruzual & Charlot (2003) Bruzual, G., & Charlot, S. 2003, MNRAS, 344, 1000
- Burgarella et al. (2013) Burgarella, D., Buat, V., Gruppioni, C., et al. 2013, A&A, 554, A70
- Burtscher et al. (2013) Burtscher, L., Meisenheimer, K., Tristram, K. R. W., et al. 2013, A&A, 558, A149
- Casey et al. (2014) Casey, C. M., Narayanan, D., & Cooray, A. 2014, Phys. Rep., 541, 45
- Chapman et al. (2005) Chapman, S. C., Blain, A. W., Smail, I., & Ivison, R. J. 2005, ApJ, 622, 772
- Chiang et al. (2013) Chiang, C.-H., Cackett, E. M., Gandhi, P., Fabian, A. C. 2013, MNRAS, 430, 2943
- Chung et al. (2011) Chung, A., Yun, M. S., Naraynan, G., Heyer, M., & Erickson, N. R. 2011, ApJ, 732, L15
- Combes et al. (2011) Combes, F., García-Burillo, S., Braine, J., et al. 2011, A&A, 528, A124
- Crawford & Vanderriest (1996) Crawford, C. S., & Vanderriest, C. 1996, MNRAS, 283, 1003
- Croton et al. (2006) Croton, D. J., Springel, V., White, S. D. M., et al. 2006, MNRAS, 365, 11
- Cutri et al. (2013) Cutri, R. M., Wright, E. L., Conrow, T., et al. 2013, Explanatory Supplement to the AllWISE Data Release Products, by R. M. Cutri et al. , 1
- Dadina (2008) Dadina, M. 2008, A&A, 485, 417
- Deane & Trentham (2001) Deane, J. R., & Trentham, N. 2001, MNRAS, 326, 1467
- Del Moro et al. (2014) Del Moro, A., Mullaney, J. M., Alexander, D. M., et al. 2014, ApJ, 786, 16
- Delvecchio et al. (2014) Delvecchio I. et al., 2014, MNRAS, 439, 2736
- Dickinson et al. (2003) Dickinson, M., Papovich, C., Ferguson, H. C., & Budavári, T. 2003, ApJ, 587, 25
- Efstathiou & Rowan-Robinson (1990) Efstathiou, A., & Rowan-Robinson, M. 1990, MNRAS, 245, 275
- Efstathiou & Rowan-Robinson (1995) Efstathiou, A., & Rowan-Robinson, M. 1995, MNRAS, 273, 649
- Efstathiou et al. (2000) Efstathiou, A., Rowan-Robinson, M., & Siebenmorgen, R. 2000, MNRAS, 313, 734
- Efstathiou & Siebenmorgen (2009) Efstathiou, A., & Siebenmorgen, R. 2009, A&A, 502, 541
- Efstathiou (2006) Efstathiou, A. 2006, MNRAS, 371, L70
- Efstathiou et al. (2013) Efstathiou, A., Christopher, N., Verma, A., & Siebenmorgen, R. 2013, MNRAS, 436, 1873
- Efstathiou et al. (2014) Efstathiou, A., Pearson, C., Farrah, D., et al. 2014, MNRAS, 437, L16
- Evans et al. (1998) Evans, A. S., Sanders, D. B., Cutri, R. M., et al. 1998, ApJ, 506, 205
- Fabian et al. (1994) Fabian, A. C., Shioya, Y., Iwasawa, K., et al. 1994, ApJ, 436, L51
- Fabian & Crawford (1995) Fabian, A. C., & Crawford, C. S. 1995, MNRAS, 274, L63
- Fabian (2012) Fabian, A. C. 2012, ARA&A, 50, 455
- Farrah et al. (2002) Farrah, D., Serjeant, S., Efstathiou, A., Rowan-Robinson, M., & Verma, A. 2002, MNRAS, 335, 1163
- Farrah et al. (2003) Farrah, D., Afonso, J., Efstathiou, A., et al. 2003, MNRAS, 343, 585
- Farrah et al. (2004) Farrah, D., Geach, J., Fox, M., et al. 2004, MNRAS, 349, 518
- Farrah et al. (2005) Farrah, D., Surace, J. A., Veilleux, S., Sanders, D. B., & Vacca, W. D. 2005, ApJ, 626, 70
- Farrah et al. (2008) Farrah, D., Lonsdale, C. J., Weedman, D. W., et al. 2008, ApJ, 677, 957
- Farrah et al. (2012) Farrah, D., Urrutia, T., Lacy, M., et al. 2012, ApJ, 745, 178
- Farrah et al. (2013) Farrah, D., Lebouteiller, V., Spoon, H. W. W., et al. 2013, ApJ, 776, 38
- Fazio et al. (2004) Fazio, G. G., Hora, J. L., Allen, L. E., et al. 2004, ApJS, 154, 10
- Ferguson, Korista & Ferland (1997) Ferguson J. W., Korista K. T., Ferland G. J., 1997, ApJS, 110, 287
- Franceschini et al. (2000) Franceschini, A., Bassani, L., Cappi, M., et al. 2000, A&A, 353, 910
- Gaibler et al. (2012) Gaibler, V., Khochfar, S., Krause, M., & Silk, J. 2012, MNRAS, 425, 438
- Gandhi et al. (2009) Gandhi, P., Horst, H., Smette, A., et al. 2009, A&A, 502, 457
- Gandhi et al. (2014) Gandhi, P., Lansbury, G. B., Alexander, D. M., et al. 2014, ApJ, 794, 176
- Gelbord et al. (2009) Gelbord, J. M., Mullaney, J. R., & Ward, M. J. 2009, MNRAS, 397, 172
- Genzel et al. (1998) Genzel, R., Lutz, D., Sturm, E., et al. 1998, ApJ, 498, 579
- Griffin et al. (2010) Griffin M.J. et al., 2012, A&A, 518, L3
- Gruppioni et al. (2016) Gruppioni, C., Berta, S., Spinoglio, L., et al. 2016, MNRAS, 458, 4297
- Hall et al. (1997) Hall, P. B., Ellingson, E., & Green, R. F. 1997, AJ, 113, 1179
- Han & Han (2012) Han, Y., & Han, Z. 2012, ApJ, 749, 123
- Harris et al. (2016) Harris, K., Farrah, D., Schulz, B., et al. 2016, MNRAS,
- Harrison et al. (2013) Harrison, F. A., Craig, W. W., Christensen, F. E., et al. 2013, ApJ, 770, 103
- Hernán-Caballero et al. (2009) Hernán-Caballero A. et al. 2009, MNRAS, 395, 1695
- Hewett & Wild (2010) Hewett, P. C., & Wild, V. 2010, MNRAS, 405, 2302
- Hines & Wills (1993) Hines, D. C., & Wills, B. J. 1993, ApJ, 415, 82
- Hines et al. (1999) Hines, D. C., Schmidt, G. D., Wills, B. J., Smith, P. S., & Sowinski, L. G. 1999, ApJ, 512, 145
- Hlavacek-Larrondo et al. (2012) Hlavacek-Larrondo, J., Fabian, A. C., Edge, A. C., et al. 2012, MNRAS, 421, 1360
- Houck et al. (2004) Houck, J. R., Roellig, T. L., van Cleve, J., et al. 2004, ApJS, 154, 18
- Iglesias-Páramo et al. (2007) Iglesias-Páramo, J., Buat, V., Hernández-Fernández, J., et al. 2007, ApJ, 670, 279
- Ishibashi & Fabian (2012) Ishibashi, W., & Fabian, A. C. 2012, MNRAS, 427, 2998
- Iwasawa et al. (2001) Iwasawa, K., Fabian, A. C., Ettori, S. 2001, MNRAS, 321, 15
- Iwasawa et al. (2005) Iwasawa, K., Crawford, C. S., Fabian, A. C., & Wilman, R. J. 2005, MNRAS, 362, L20
- Kalberla et al. (2005) Kalberla, P. M., Burton, W. B., Hartmann, D., et al. 2005, A&A, 440, 775
- Kewley et al. (2001) Kewley, L. J., Heisler, C. A., Dopita, M. A., & Lumsden, S. 2001, ApJS, 132, 37
- King (2005) King, A. 2005, ApJ, 635, L121
- Kleinmann et al. (1988) Kleinmann, S. G., Hamilton, D., Keel, W. C., et al. 1988, ApJ, 328, 161
- Korista & Ferland (1989) Korista K. T., Ferland G. J., 1989, ApJ, 343, 678
- Koss et al. (2015) Koss, M. J., Romero-Cañizales, C., Baronchelli, L., et al. 2015, ApJ, 807, 149
- Lagache et al. (2005) Lagache, G., Puget, J.-L., & Dole, H. 2005, ARA&A, 43, 727
- LaMassa et al. (2014) LaMassa, S. M., Yaqoob, T., Ptak, A. F., et al. 2014, ApJ, 787, 61
- Lansbury et al. (2014) Lansbury, G. B., Alexander, D. M., Del Moro, A., et al. 2014, ApJ, 785, 17
- Lansbury et al. (2015) Lansbury, G. B., Gandhi, P., Alexander, D. M., et al. 2015, ApJ, 809, 115
- Lanzuisi et al. (2015) Lanzuisi, G., Perna, M., Delvecchio, I., et al. 2015, A&A, 578, A120
- Lebouteiller et al. (2011) Lebouteiller, V., Barry, D. J., Spoon, H. W. W., et al. 2011, ApJS, 196, 8
- Liedahl et al. (1995) Liedahl, D. A., Osterheld, A. L., & Goldstein, W. H. 1995, ApJ, 438, L115
- Lilly et al. (1996) Lilly, S. J., Le Fevre, O., Hammer, F., & Crampton, D. 1996, ApJ, 460, L1
- Lonsdale et al. (2006) Lonsdale, C. J., Farrah, D., & Smith, H. E. 2006, Astrophysics Update 2, 285
- Lusso et al. (2012) Lusso, E., Comastri, A., Simmons, B. D. et al. 2012, MNRAS, 425, 623
- Madau & Dickinson (2014) Madau, P., & Dickinson, M. 2014, ARA&A, 52, 415
- Madsen et al. (2015) Madsen, K. K., Harrison, F. A., Markwardt, C. B., et al. 2015, ApJS, 220, 8
- Magdziarz & Zdziarski (1995) Magdziarz & Zdziarski 1995 MNRAS, 273, 837
- Magorrian et al. (1998) Magorrian, J., Tremaine, S., Richstone, D., et al. 1998, AJ, 115, 2285
- Malizia et al. (2014) Malizia, A., Molina, M., Bassani, L., et al. 2014, ApJ, 782, 25
- Marconi et al. (2004) Marconi, A., Risaliti, G., Gilli, R., et al. 2004, MNRAS, 351, 169
- Massey & Gronwall (1990) Massey, P., & Gronwall, C. 1990, ApJ, 358, 344
- McDonald et al. (2015) McDonald, M., McNamara, B. R., van Weeren, R. J., et al. 2015, ApJ, 811, 111
- Mewe et al. (1985) Mewe, R., Gronenschild, E. H. B. M., & van den Oord, G. H. J. 1985, A&AS, 62, 197
- Mignoli et al. (2013) Mignoli, M., Vignali, C., Gilli, R., et al. 2013, A&A, 556, A29
- Moshir et al. (1990) Moshir, M., et al. 1990, IRAS Faint Source Catalogue, version 2.0 (1990), 0
- Murayama & Taniguchi (1998) Murayama, T., & Taniguchi, Y. 1998, ApJ, 497, L9
- Murphy & Yaqoob (2009) Murphy, K. D., Yaqoob, T. 2009, MNRAS, 397, 1549
- Neugebauer et al. (1984) Neugebauer, G., Habing, H. J., van Duinen, R., et al. 1984, ApJ, 278, L1
- Oke & Gunn (1982) Oke, J. B., & Gunn, J. E. 1982, PASP, 94, 586
- Osterbrock (1981) Osterbrock D. E., 1981, ApJ, 246, 696
- O’Sullivan et al. (2012) O’Sullivan, E., Giacintucci, S., Babul, A., et al. 2012, MNRAS, 424, 2971
- Ott (2010) Ott, S. 2010, Astronomical Data Analysis Software and Systems XIX, 434, 139
- Penston et al (1984) Penston M. V., Fosbury R. A. E., Boksenberg A., Ward M. J., Wilson A. S., 1984, MNRAS, 208, 347
- Pérez-González et al. (2005) Pérez-González, P. G., Rieke, G. H., Egami, E., et al. 2005, ApJ, 630, 82
- Perri et al. (2014) Perri, M., Puccetti, S., Spagnuolo, N, et al. 2014, The NuSTAR Data Analysis Software Guide, http://heasarc.gsfc.nasa.gov/docs/nustar/analysis/nustar_swguide.pdf
- Piconcelli et al. (2007) Piconcelli, E., Fiore, F., Nicastro, F., et al. 2007, A&A, 473, 85
- Pilbratt et al. (2010) Pilbratt, G. L., Riedinger, J. R., Passvogel, T., et al. 2010, A&A, 518, L1
- Pipino et al. (2009) Pipino, A., Kaviraj, S., Bildfell, C., et al. 2009, MNRAS, 395, 462
- Poglitsch et al. (2010) Poglitsch, A., Waelkens, C., Geis, N., et al. 2010, A&A, 518, L2
- Puccetti et al. (2014) Puccetti, S., Comastri, A., Fiore, F., et al. 2014, ApJ, 793, 26
- Reynolds et al (1997) Reynolds C. S., Ward M. J., Fabian A. C., Celotti A., 1997, MNRAS, 291, 403
- Richards et al. (2006) Richards, G. T., Strauss, M. A., Fan, X., et al. 2006, AJ, 131, 2766
- Risaliti & Elvis (2004) Risaliti, G., & Elvis, M. 2004, Supermassive Black Holes in the Distant Universe, 308, 187
- Rivers et al. (2013) Rivers, E., Markowitz, A., Rotschild, R. 2013, ApJ, 772, 114
- Rose et al. (2015) Rose, M., Elvis, M., & Tadhunter, C. N. 2015, MNRAS, 448, 2900
- Rowan-Robinson (2000) Rowan-Robinson, M. 2000, MNRAS, 316, 885
- Rowan-Robinson & Wang (2010) Rowan-Robinson, M., & Wang, L. 2010, MNRAS, 406, 720
- Rowan-Robinson et al. (2016) Rowan-Robinson, M., Oliver, S., Wang, L., et al. 2016, arXiv:1605.03937
- Ruiz et al. (2010) Ruiz, A., Miniutti, G., Panessa, F., & Carrera, F. J. 2010, A&A, 515, A99
- Ruiz et al. (2013) Ruiz, A., Risaliti, G., Nardini, E., Panessa, F., & Carrera, F. J. 2013, A&A, 549, A125
- Russell et al. (2010) Russell, H. R., Fabian, A. C., Sanders, J. S., et al. 2010, MNRAS, 402, 1561
- Sargsyan et al. (2008) Sargsyan, L., Mickaelian, A., Weedman, D., & Houck, J. 2008, ApJ, 683, 114
- Schaye et al. (2015) Schaye, J., Crain, R. A., Bower, R. G., et al. 2015, MNRAS, 446, 521
- Shan & Chen (2012) Shan, H. G., & Chen, P. S. 2012, MNRAS, 421, 235
- Silk (2013) Silk, J. 2013, ApJ, 772, 112
- Shirazi & Brinchmann (2012) Shirazi, M., & Brinchmann, J. 2012, MNRAS, 421, 1043
- Soifer et al. (1996) Soifer, B. T., Neugebauer, G., Armus, L., & Shupe, D. L. 1996, AJ, 111, 649
- Stasińska et al. (2006) Stasińska, G., Cid Fernandes, R., Mateus, A., Sodré, L., & Asari, N. V. 2006, MNRAS, 371, 972
- Stern et al. (2014) Stern, D., Lansbury, G. B., Assef, R. J., et al. 2014, ApJ, 794, 102
- Stern (2015) Stern, D. 2015, ApJ, 807, 129
- Taniguchi et al. (1997) Taniguchi, Y., Sato, Y., Kawara, K., Murayama, T., & Mouri, H. 1997, A&A, 318, L1
- Tran et al. (2000) Tran, H. D., Cohen, M. H., & Villar-Martin, M. 2000, AJ, 120, 562
- Tremaine et al. (2002) Tremaine, S., Gebhardt, K., Bender, R., et al. 2002, ApJ, 574, 740
- Vasudevan & Fabian (2007) Vasudevan, R. V., Fabian, A. C. 2007, MNRAS, 381, 1235
- Verma et al. (2002) Verma, A., Rowan-Robinson, M., McMahon, R., & Efstathiou, A. 2002, MNRAS, 335, 574
- Véron-Cetty & Véron (2006) Véron-Cetty, M.-P., & Véron, P. 2006, A&A, 455, 773
- Vignali et al. (2011) Vignali, C., Piconcelli, E., Lanzuisi, G., et al. 2011, MNRAS, 416, 2068
- Vignali et al. (2014) Vignali, C., Mignoli, M., Gilli, R., et al. 2014, A&A, 571, A34
- Wang & Rowan-Robinson (2010) Wang, L., & Rowan-Robinson, M. 2010, MNRAS, 401, 35
- Wang et al. (2013) Wang, L., Farrah, D., Oliver, S. J., et al. 2013, MNRAS, 431, 648
- Werner et al. (2004) Werner, M. W., Roellig, T. L., Low, F. J., et al. 2004, ApJS, 154, 1
- Wright et al. (2010) Wright, E. L., Eisenhardt, P. R. M., Mainzer, A. K., et al. 2010, AJ, 140, 1868
- Wuyts et al. (2011) Wuyts, S., Förster Schreiber, N. M., van der Wel, A., et al. 2011, ApJ, 742, 96
- Yaqoob (2012) Yaqoob, T., 2012, MNRAS, 423, 3360
- Zakamska et al. (2008) Zakamska, N. L., Gómez, L., Strauss, M. A., & Krolik, J. H. 2008, AJ, 136, 1607
- Zubovas et al. (2013) Zubovas, K., Nayakshin, S., King, A., & Wilkinson, M. 2013, MNRAS, 433, 3079