The tight subgiant branch of the intermediate-age star cluster NGC 411 implies a single-aged stellar population
Abstract
The presence of extended main-sequence turn-off (eMSTO) regions in intermediate-age star clusters in the Large and Small Magellanic Clouds is often interpreted as resulting from extended star-formation histories (SFHs), lasting 300 Myr. This strongly conflicts with the traditional view of the dominant star-formation mode in stellar clusters, which are thought of as single-aged stellar populations. Here we present a test of this interpretation by exploring the morphology of the subgiant branch (SGB) of NGC 411, which hosts possibly the most extended eMSTO among all known intermediate-age star clusters. We show that the width of the NGC 411 SGB favours the single-aged stellar population interpretation and rules out an extended SFH. In addition, when considering the red clump (RC) morphology and adopting the unproven premise that the widths of all features in the colour–magnitude diagram are determined by an underlying range in ages, we find that the SFH implied is still very close to that resulting from a single-aged stellar population, with a minor fraction of stars scattering to younger ages compared with the bulk of the population. The SFHs derived from the SGB and RC are both inconsistent with the SFH derived from the eMSTO region. NGC 411 has a very low escape velocity and it has unlikely undergone significant mass loss at an early stage, thus indicating that it may lack the capacity to capture most of its initial, expelled gas from stellar evolutionary processes, a condition often required for extended SFHs to take root.
keywords:
clusters: general – galaxies: clusters: individual: NGC 411 – galaxies1 Introduction
Until about a decade ago, it was believed that – except for the oldest globular clusters – star clusters contain stars described by the theoretical concept of ‘simple’ stellar populations (SSPs). They were each thought to have formed in a particular starburst event, with a maximum age spread of only 1–3 Myr (Longmore et al., 2014). However, the discovery of extended main-sequence turn-off (eMSTO) regions in intermediate-age, 1–2 Gyr-old star clusters in the Large and Small Magellanic Clouds (LMC, SMC) has radically changed our view and understanding of the validity of the SSP scenario for stellar clusters (e.g., Mackey & Broby Nielsen, 2007; Glatt et al., 2008; Mackey et al., 2008; Milone et al., 2009; Keller et al., 2012; Goudfrooij et al., 2014), because the areas in colour–magnitude space covered by their eMSTO regions are significantly more extended than would be expected for SSPs. A direct interpretation of these eMSTOs in intermediate-age star clusters, adopting the common yet unproven assumption that the eMSTO width is entirely owing to a range in stellar ages, would imply that these objects may have experienced extended star-formation histories (SFHs) of at least 300 Myr. Since such features are found in almost all intermediate-age star clusters (Milone et al., 2009), this would then strongly indicate that star formation can ubiquitously proceed for several hundred million years within massive clusters. This has led to extensive debates as to whether star clusters can harbour extended SFHs.
Goudfrooij et al. (2014) proposed a scenario that invokes two distinct rounds of SFH in massive clusters to explain the observed eMSTO regions. In their model, the first star-formation episode is a near-instantaneous burst, which is followed by a 10–100 Myr period with no star formation. In turn, this quiescent period is followed by a second star-formation episode that lasts a few hundred million years. Goudfrooij et al. (2014) found that the width of the eMSTO of intermediate-age star clusters is correlated with their central escape velocity, , with a threshold of 12–15 km s-1 for . However, critiques of various aspects of this scenario have been presented elsewhere (Bastian & Niederhofer, 2015; D’Antona et al., 2015; Niederhofer et al., 2015b; Cabrera-Ziri et al., 2016b). If Goudfrooij et al. (2014) are on the right track, the extended SFH scenario should be reflected by the presence of age spreads in young massive clusters. Explorations of the reality of such proposed dramatic age spreads in young massive clusters have been undertaken by various teams based on either analyses of cluster colour–magnitude diagrams (CMDs; e.g., Larsen et al., 2011; Niederhofer et al., 2015)) or integrated spectroscopy (Bastian et al., 2013; Cabrera-Ziri et al., 2014). However, no significant age spreads have been found to date.
At the same time, rapid stellar rotation has been identified as a condition that may affect the area of the MSTO region as strongly as stellar age spreads. This is because the centrifugal force somewhat reduces stellar self-gravity, which leads to a reduction in the stellar luminosity and surface temperature (Bastian & de Mink, 2009; Langer, 2012). However, this model has been criticized by Girardi, Eggenberger & Miglio. (2011), who realized that the effect of a prolonged stellar main-sequence (MS) lifetime owing to stellar rotational mixing (e.g., Meynet & Maeder, 2000) would cancel the broadening of MSTO regions caused by this reduced self-gravity and, therefore, conspire to retain a narrow MSTO region at a certain age. On the other hand, Yang et al. (2013) showed that if one adopts a reasonable significance for the effects of this prolonged stellar lifetime, rapid stellar rotation could still be a solution to the ‘multiple-age conundrum’; their conclusion was recently supported by Brandt & Huang (2015) and Niederhofer et al. (2015b).
Li, de Grijs & Deng (2014b) first addressed an new front in research by exploring other parts of the CMD to constrain the internal age spreads of intermediate-age star clusters. They found that the 1.7 Gyr-old cluster NGC 1651, which hosts an eMSTO which would suggest the presence of a 450 Myr age spread, possesses a very tight subgiant branch (SGB) that favours a single-aged stellar population. They affirmed that the cluster’s tight SGB offers the strongest evidence yet in support of the SSP scenario. Meanwhile, their idea was independently confirmed by Bastian & Niederhofer (2015) for the intermediate-age clusters NGC 1806 and NGC 1846. Niederhofer et al. (2016) reached the same conclusion based on a comparison of the extensts of the red clumps (RCs) and the eMSTOs in 12 LMC clusters. However, based on more recent calculations considering the effects of convective overshooting, Goudfrooij et al. (2015) showed that the SGB widths of NGC 1651, NGC 1806 and NGC 1846 might still be consistent with predictions involving significant age spreads. Goudfrooij et al. (2015) argued that the SGB locus in the CMD as used by Li, de Grijs & Deng (2014b) and Bastian & Niederhofer (2015) may not be the best choice for further study; instead, they argued that one should consider the SGB morphology or ‘spread’, which should be wide if age spreads are present and narrow if not. Indeed, there are compelling reasons to explore the structure of the SGB in intermediate-age star clusters to constrain their internal age spreads, rather than solely concentrating on eMSTO regions. Finally, Niederhofer et al. (2016) showed that by taking into account the morphology of the RC, the maximum viable age dispersion can be further constrained. In most cases, the SFHs derived from RCs are smaller than those apparently implied by the eMSTO regions.
In this paper, we focus on the SMC cluster NGC 411, whose MSTO region is much more extended than those of any other intermediate-age star clusters. Its eMSTO was first identified by Girardi et al. (2013), who showed that it is consistent with an age spread of 700 Myr, while Goudfrooij et al. (2014) even determined that the age spread of NGC 411 can reach as much as 1 Gyr (their fig. 2). The mass of NGC 411 is only 32,000 M⊙, making it one of the lowest-mass clusters hosting an eMSTO, in apparent contradiction to Goudfrooij et al. (2014). In Section 2 we introduce the details of our data reduction. In Section 3 we present the main results. In Section 4, we explore applicability of both the age-spread scenario and the rapid stellar rotation model to NGC 411. Our conclusions are presented in Section 5.
2 Data Reduction and Analysis
Our data sets were obtained from Hubble Space Telescope (HST) programme GO-12257 (principal investigator: L. Girardi), using the Wide Field Camera-3 (WFC3). The resulting data set is composed of a combination of four science images in the F475W and F814W filters, which roughly correspond to the Johnson–Cousins and bands, respectively. The total exposure times for these two bands are 1520 s and 1980 s, respectively.
The adopted photometric procedures are identical to those used by Li et al. (2016), who based their results on two independent software packages, DAOPHOT (Davis, 1994) and DOLPHOT (Dolphin, 2013). The resulting stellar catalogues adopted here are those from the DAOPHOT photometry. We confirmed that our results are internally consistent by comparing them with the DOLPHOT analysis.
In Li et al. (2016) we determined that the cluster’s number density centre is , . Its radial profile shows that at a radius of 25 arcsec the stellar number density decreases to about half the central density. To avoid background contamination as much as possible, while keeping our analysis results statistically robust, we select twice this value (50 arcsec) as the cluster’s typical region of interest.
At the distance of the SMC, we cannot use proper-motion selection to decontaminate the background stars from the cluster sample. Therefore, we adopted a statistical method to reduce background contamination. We assume that the CMD of the field stars in a nearby region should be similar to that in the cluster region. We then generated numerous grids with sizes of 0.500.25 mag2 to cover the entire CMD region. We randomly removed a number of stars corresponding to that in the area-corrected field-region CMD from the cluster CMD. Our method is similar to that employed by Hu et al. (2010) and Li, de Grijs & Deng (2013). We confirmed that the adopted grid size will not affect the observed features; viable cell sizes range from roughly 0.30.15 mag2 to 0.50.25 mag2. The observed features will change significantly only if we adopt grid sizes that are either too small (e.g., smaller than 0.10.05 mag2) or too large (e.g., larger than 1.00.50 mag2). This is because the relative number density of the NGC 411 SGB region is moderate; a grid size which is too small would not contain sufficient numbers of stars, while a much larger grid will smooth the observed details. The details of our adopted field region are discussed in (Li et al., 2016, see the right-hand panel of their Extended Data fig. 2).
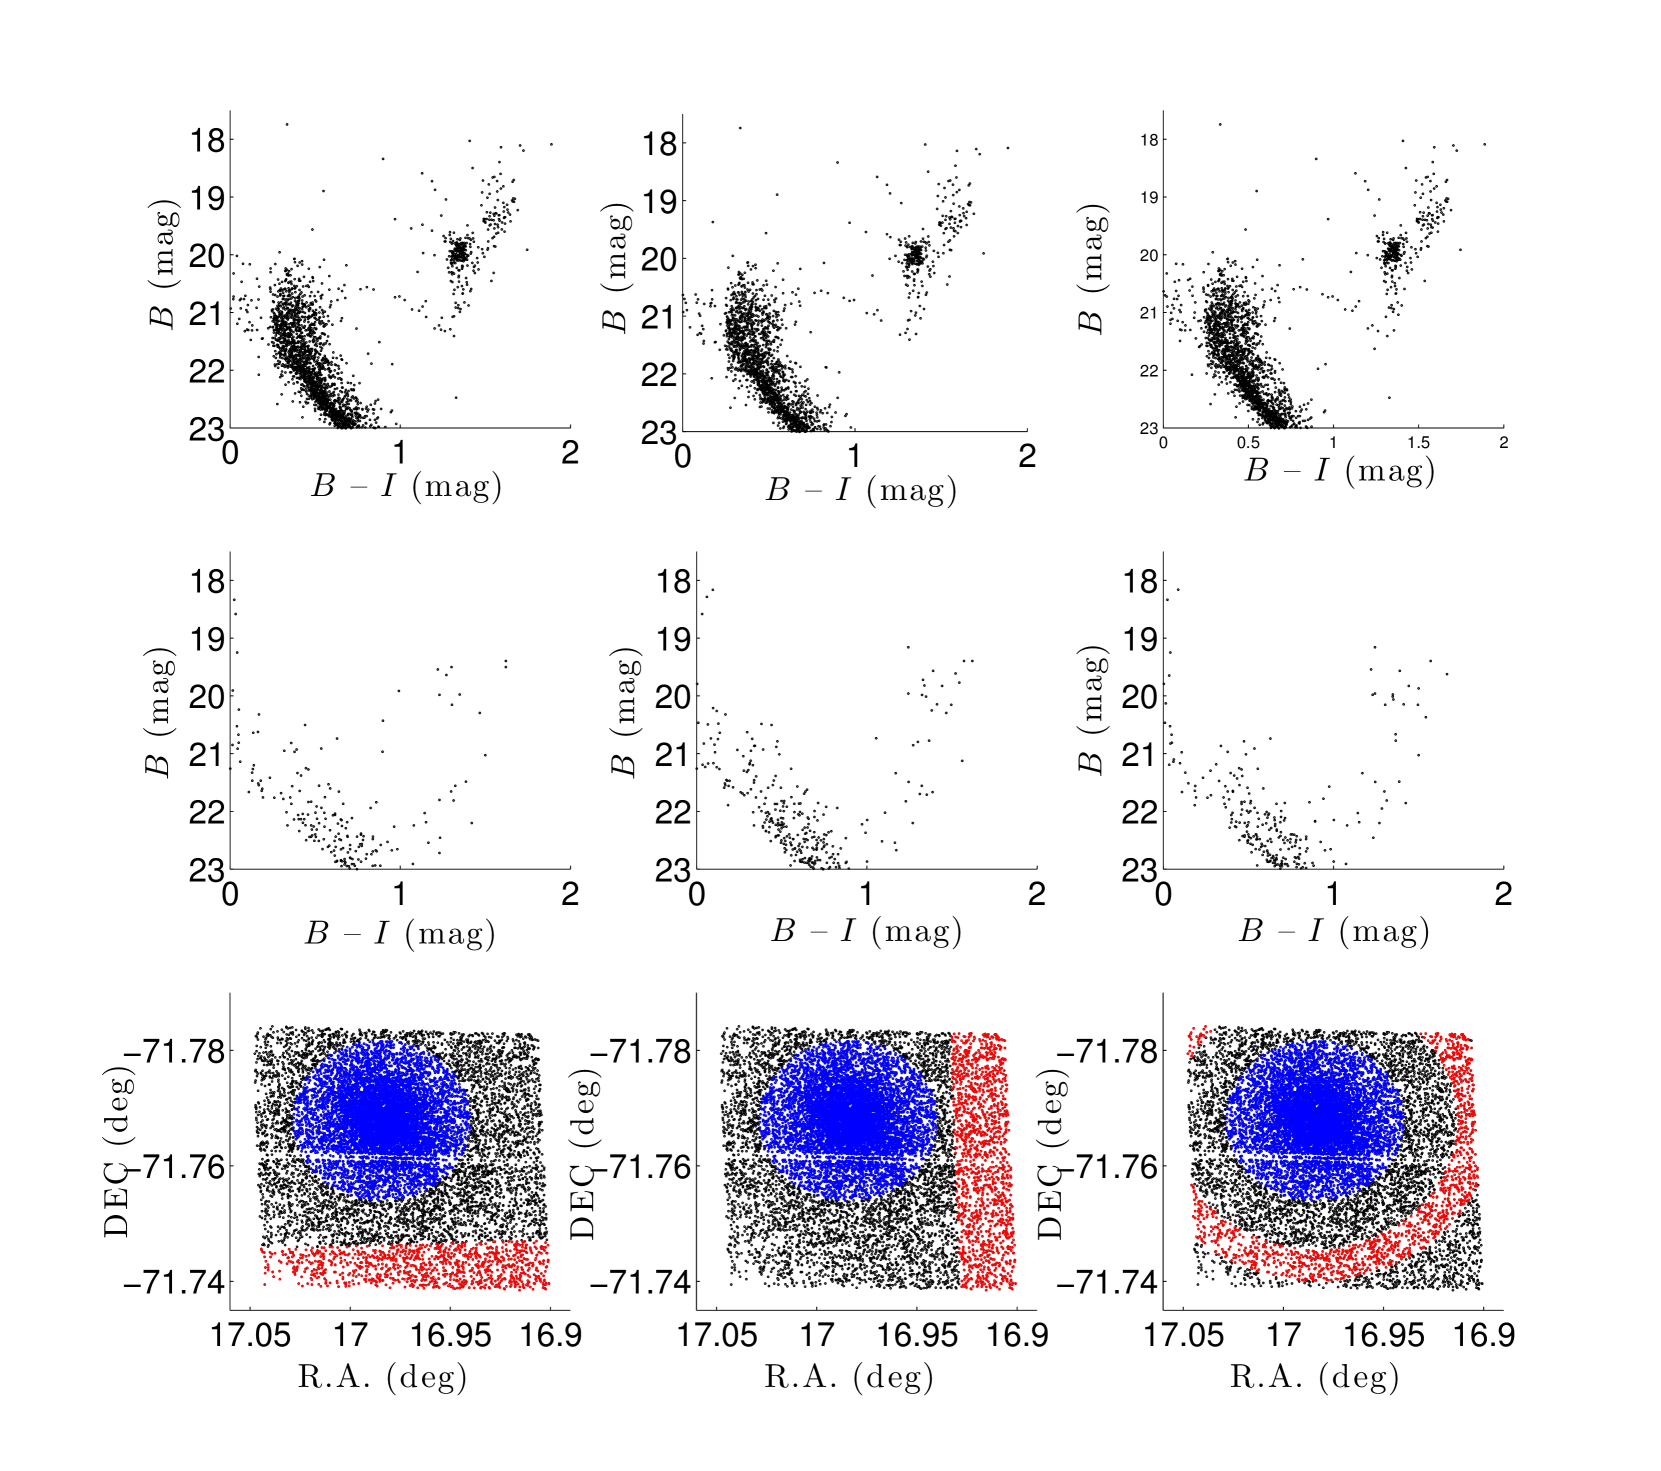
We have checked the effects of different adopted field regions and found that the observed features, i.e., the tight SGB and the eMSTO region, are independent of both the location and shape of the field region. In Fig. 1 we present the decontaminated CMDs (top panels) based on different adopted field regions (shown in the bottom panels). For these different adopted field regions, the numbers of field stars contaminating the SGB (RC) region of interest are two, one and zero (five, ten and ten) for the fields shown in the bottom left- to right-hand panels, respectively. We note that Cabrera-Ziri et al. (2016a) have warned that a sparsely populated region may suffer from problems related to field-star contamination. Since the NGC 411 SGB region is such a sparsely populated region, we have tested if it could be populated mainly by field stars: we therefore adopted a similar approach to that of (Cabrera-Ziri et al., 2016a, their Fig. 4). We thus confirmed that the average number dispersion of field stars in the SGB region does not exceed 1.34, while the number of stars detected in the SGB region is 18. Since this is at least 13 times the expected field-star level, this exercise thus supports our assertion that the observed SGB in NGC 411 is a physical feature associated with the cluster rather than caused by field-star contamination. In addition, SMC field populations composed of stars with different ages and metallicities cannot form such a tight sequence in the CMD.
3 Main Results
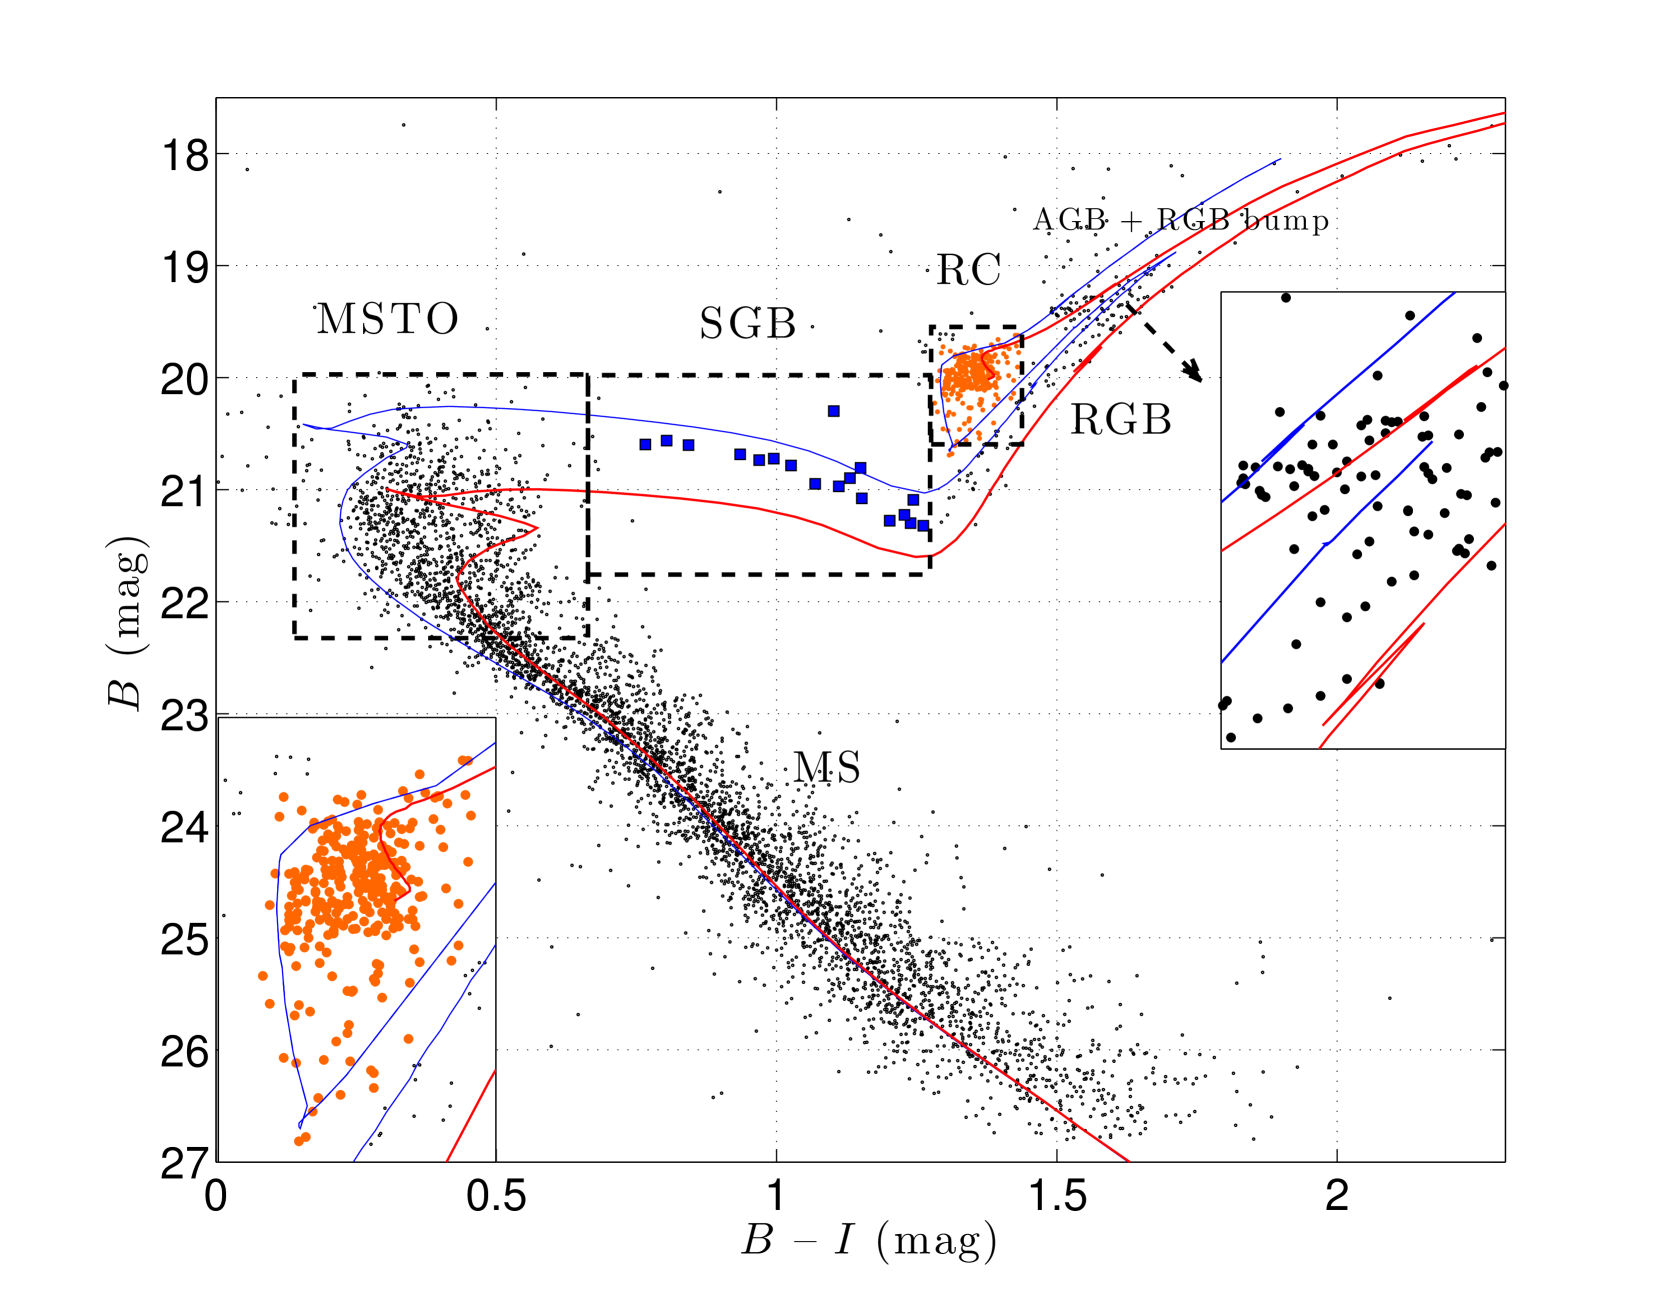
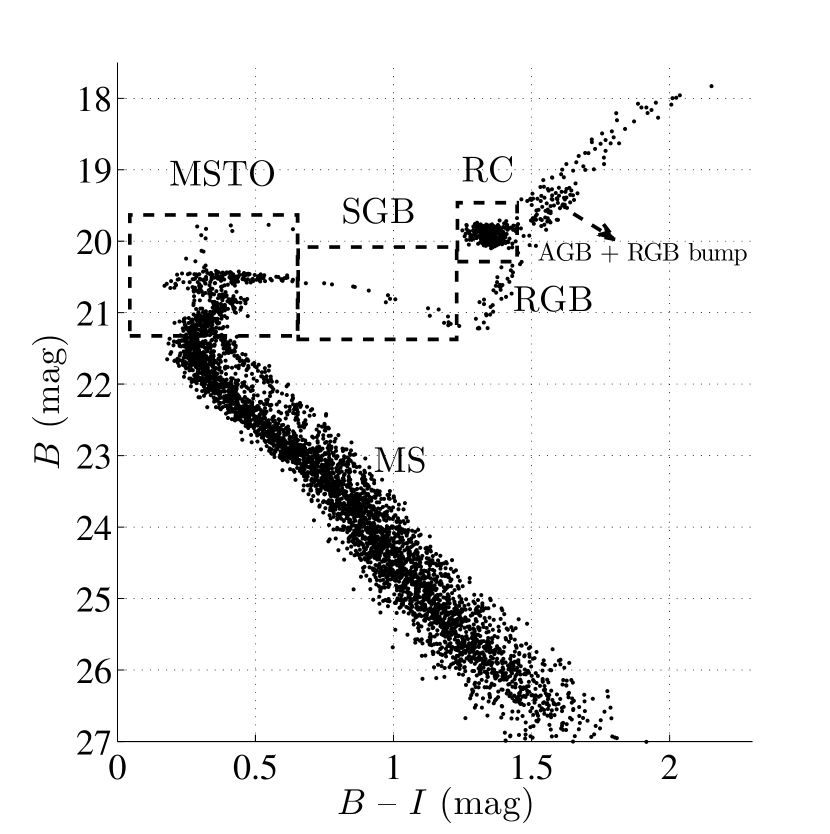
Figure 2 shows the CMD of NGC 411 and its apparent eMSTO region for mag. For stars brighter than mag in the DAOPHOT (Davis, 1994) catalogue, the average 1 magnitude uncertainties are 0.04 mag in both bands. Clearly, these small photometric errors cannot explain the broadening of the eMSTO region. Below, we will discuss a CMD composed of a single stellar population, assuming that only photometric uncertainties and unresolved binary systems will affect the morphology of the MSTO region. The cluster also exhibits both a well-populated SGB and a RC. In Fig. 2 the SGB and RC stars analysed in this paper are highlighted as blue rectangles and orange dots, respectively 111We also found a bump at mag and mag. However, since a RC characterized by a significant age spread should not be dispersed so much in colour, it is more likely that this is a combination of a (weak) asymptotic-giant-branch (AGB) bump and a red-giant-branch (RGB) bump.. Using the stellar evolutionary models of Bressan et al. (2012), we adopted a series of isochrones with ages of 1.38 Gyr ( ( yr-1) = 9.14) to 2.18 Gyr ( ( yr-1) = 9.34) to describe the entire eMSTO region. Our fit suggests a possible maximum age spread of 800 Myr, which is slightly larger than that derived by (Girardi et al., 2013, 700 Myr) but smaller than that found by Goudfrooij et al. (2014). All other parameters pertaining to these isochrones are the same as those adopted by Girardi et al. (2013), including a metallicity of = 0.002, an extinction of mag or mag, and a distance modulus of mag. If an age spread were entirely responsible for the eMSTO, this should be reflected in the width of the SGB. However, even at first glance, we immediately see that the SGB is much narrower than would be expected for an age spread of 800 Myr, we determined the best-fitting age to the SGB is 1.58 Gyr ( ( yr-1) = 9.20).
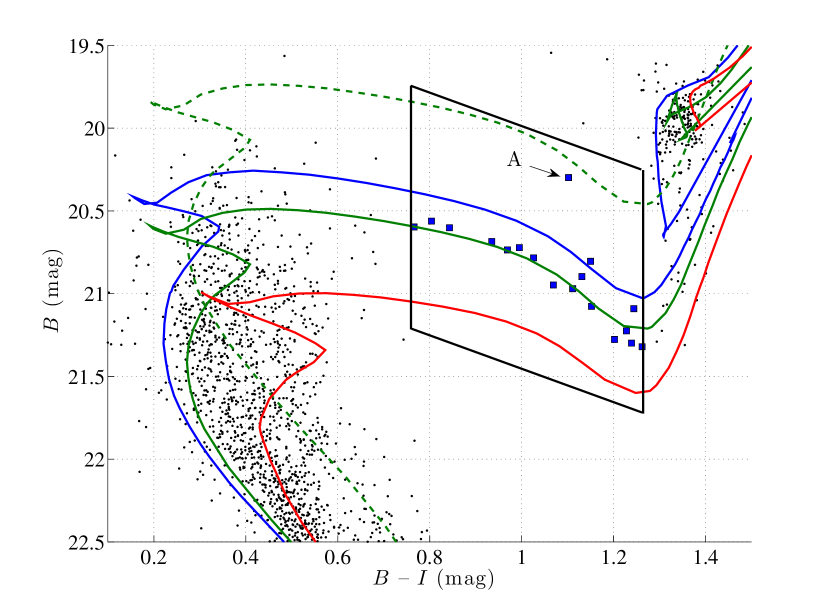
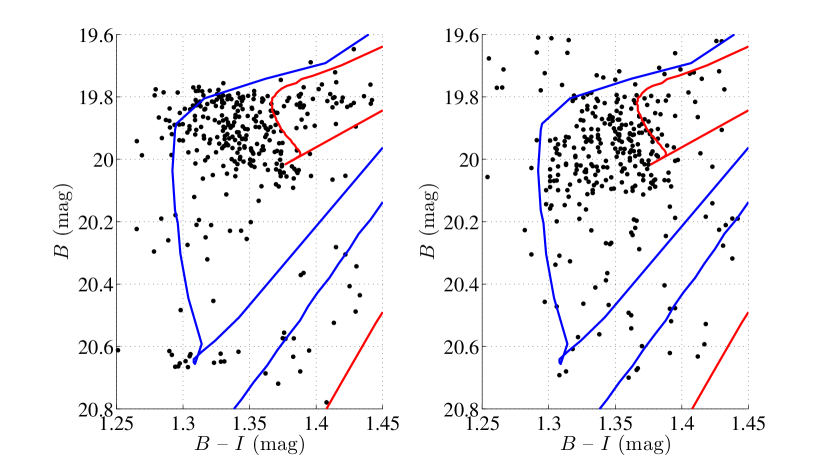
Indeed, Fig. 2 already shows a very narrow SGB. However, since this approach was disputed by Goudfrooij et al. (2015), who claimed that the position of the stars along the SGB cannot properly constrain the internal age distribution, and in order not to ignore any possible SGB candidates, we compiled a sample of SGB stars by adopting a much larger area of interest. We defined a parallelogram-shaped box, approximately bounded by mag and 0.75 () 1.25 mag. This region was adopted to properly avoid possible contamination by stars located in the eMSTO region and at the bottom of the RGB. Stars located inside this box were, hence, selected as possible SGB stars. This box spans more than 2 mag in brightness, a range that is sufficient to cover any reasonable physical models one may consider. The maximum magnitude offset caused by unresolved binaries is 0.75 mag and, as shown by Goudfrooij et al. (2015), the enhancement in magnitude owing to stellar convective overshooting (adopting overshooting ranging from = 0.35 to 0.50) is less than 0.1 mag. Figure 3 shows the best-fitting isochrones to (i) the boundaries of the eMSTO (blue dashed and red solid lines), (ii) the tight SGB (green solid line) and (iii) the corresponding locus of equal-mass-ratio unresolved binaries (green dashed line), it shows that only one star (marked ‘A’ in Fig. 3) deviates significantly from the best-fitting isochrone. As one can see, the luminosity of star ‘A’ is much brighter than that of the youngest isochrone, characterized by an age of 1.38 Gyr or ( yr-1) = 9.14, which indicates that it maybe a bright foreground or background star. It is also probably that star ‘A’ is an approximately equal-mass unresolved binary system, as its position is very close to the locus of the unresolved binary sequence. Both cases refuse that it is an genuine single SGB star. Therefore, we have excluded this star from our analysis (in addition, a single exception will not affect our statistical results).
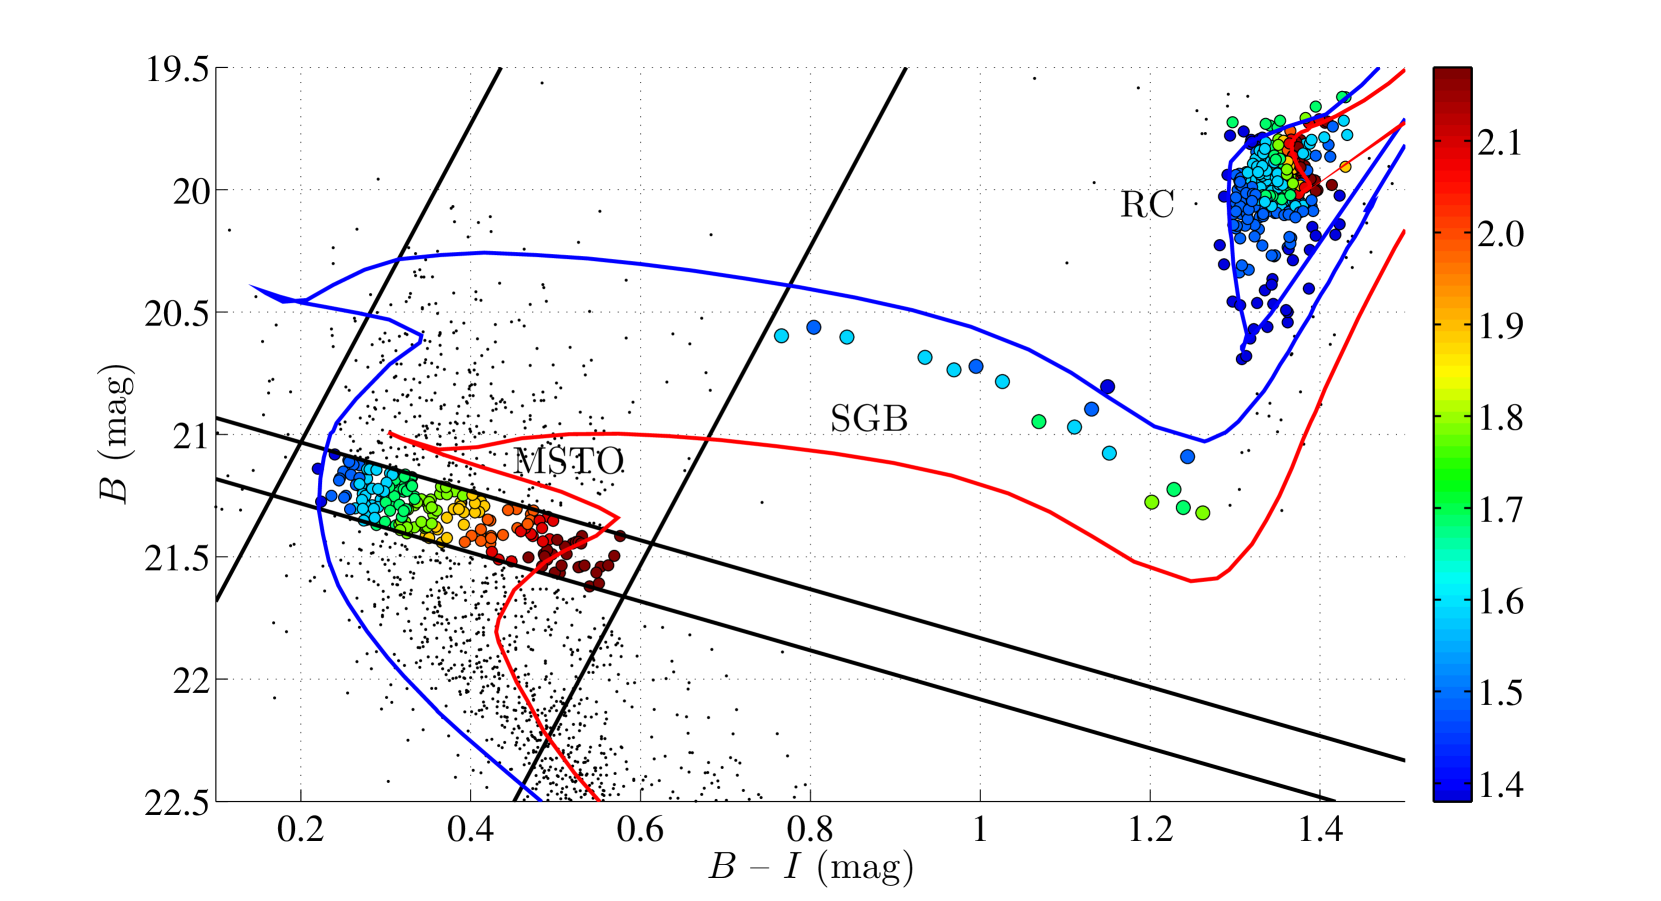
We next explore the morphology of the RC region to further constrain the SFH. To select a statistically complete sample of RC stars, we first select stars located in the colour and magnitude intervals defined by mag and mag. Next, since the isochrones in the RC range trace open loops, we adopt stars which are associated with the loop pertaining to the most extreme isochrone used (normally, the 1.38 Gyr isochrone) as RC stars. Of the stars located beyond this loop, we also select those which are still located within the 2 uncertainties associated with that isochrone. Finally, we made a cut across the MSTO region to select the MSTO stars. This method is similar to the approaches used by Goudfrooij et al. (2014), Li, de Grijs & Deng (2014a) and Bastian & Niederhofer (2015).
To achieve the most straightforward comparison between the SFHs of the eMSTO, SGB (without star ‘A’) and RC, we directly assign the age of the closest isochrone to each star (Bastian & Niederhofer, 2015): see Fig. 4.
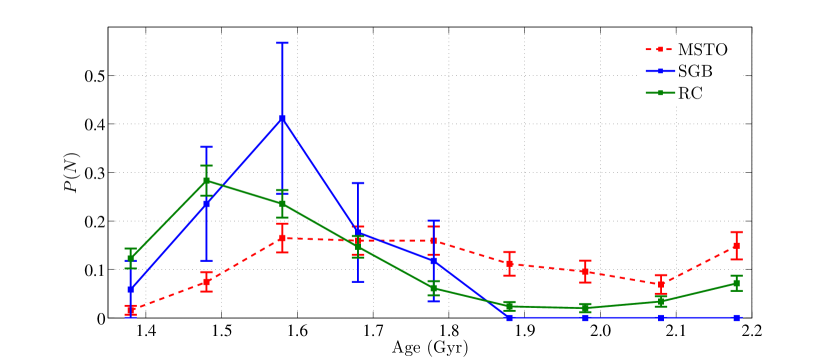
In Fig. 5 we compare the SFHs derived from the SGB (without star ‘A’), the RC and the eMSTO regions. The derived SFH for the eMSTO region is almost flat from 1.38 Gyr to 2.18 Gyr, indicating an apparent age spread. However, the SFHs resulting from both the SGB and the RC stars preferentially render young ages: all SGB stars and 85 percent of the RC stars are younger than 1.78 Gyr. Using the K–S test222The K–S test returns two values, and . can only take the values 0 and 1, which depends on the null hypothesis that the two underlying distributions are independent. If is returned as 0, the null hypothesis is rejected, which means that the two samples under consideration are drawn from the same distribution. represents the value, which indicates the probability that the two samples are drawn from the same underlying population. we quantify the similarities of the SFHs derived from the SGB, the RC and the eMSTO. The K–S test reports that the SFHs based on the SGB and the RC are all mutually consistent. However, when we compare the SFHs derived from these features to that from the eMSTO, the K–S test indicates that their SFHs are inconsistent with that derived from eMSTO.
To test if their SFHs are consistent with SSPs, we generated a CMD of an SSP with photometric uncertainties based on the 1.58 Gyr isochrone. We also evaluated the MS–MS binary fraction for NGC 411 using a similar method to that used by Milone et al. (2012). We found that the fraction of binaries with mass ratios is approximately 20 percent. Assuming a flat mass-ratio distribution (Reggiani & Meyer, 2011), we adopt a 50 percent MS–MS binary fraction for our simulated CMD. For evolved stars we did not assign binary status to any star, because only equal-mass binary systems (i.e., SGB–SGB or RGB–RGB binaries) will exhibit significant differences from single stars, and the numbers of such binary systems are very small. The simulated MS stars have the same luminosity function to the observations. We directly sample the evolved stars based on the Chabrier initial mass function (Chabrier, 2001) which is built into the isochrones333We assigned the SGB a similar colour distribution to the observations.. Figure 6 shows the simulated CMD for an SSP with an age of 1.58 Gyr.
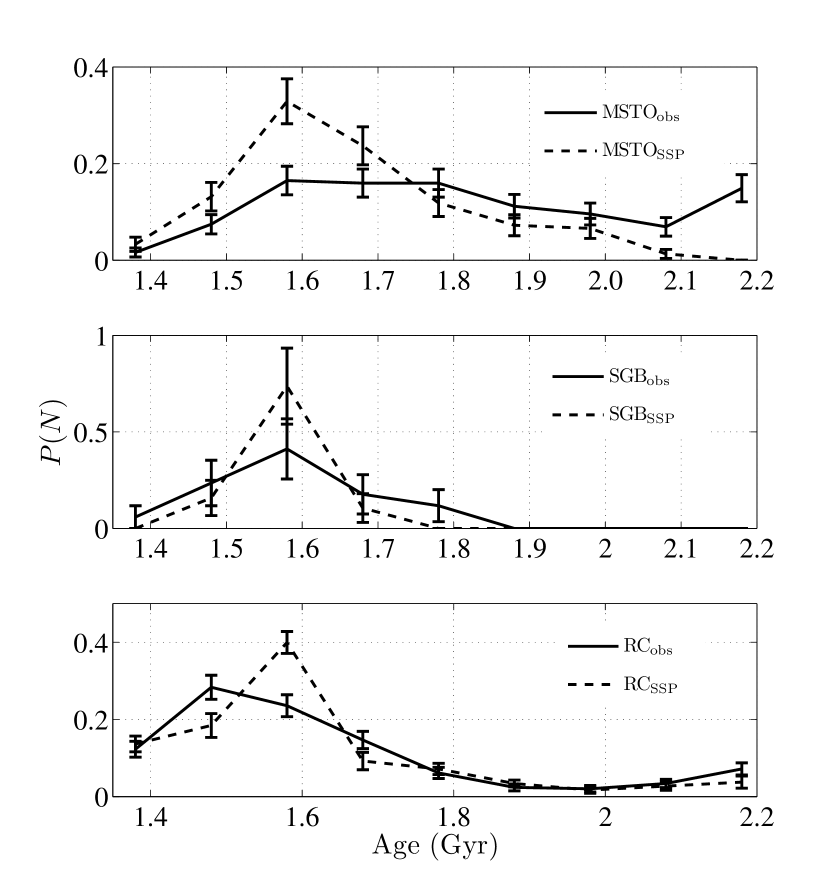
Our next step applied to the simulated CMD is identical to the approach we performed on the observed CMD (see Fig.7). We derive the SFHs of the simulated MSTO, SGB and RC stars and compare them with their corresponding observations. The comparisons are shown in Fig. 8. Again, we use the K–S test to examine if the SFHs of MSTO, SGB and RC stars are consistent with SSPs. The K–S-test results show that the distributions of both the observed SGB and RC stars are consistent with SFHs derived from SSPs ( = 0.87 and 0.37, respectively), but the observed MSTO is not consistent with an SSP: () = ().
However, based on visual inspection, we found a clear secondary RC (SRC) which extends to – 20.5 mag (see Fig. 4). The more massive nature of the SRC stars may reflect a somewhat extended SFH, but it can be also be explained by rapid stellar rotation (Tayar & Pinsonneault, 2013; Deheuvels et al., 2015). Clearly, in our simulation the RC of an SSP is much more compact than the observed RC (see Fig. 7). We count the number of RC stars below the 1.48 Gyr ( ( yr-1) = 9.17) isochrone. We find that SRC stars represent 25 percent of the full RC population. To check whether the addition of younger populations to our models will improve the significance of the comparison, we added two populations with ages of 1.38 Gyr and 1.48 Gyr to the bulk population, with number fractions of 12.5 percent each. Figure 9 shows (left) the synthetic RC and (right) the observed RC. The resulting morphologies of the MSTO and SGB are also slightly different. We performed the same analysis as before, applied to the synthetic MSTO, SGB and RC, and compared their derived SFHs with those obtained for the observations: indeed, we found that once we add these two young populations, the K–S test again shows that the distributions of the observed SGB and RC stars are consistent with the SFHs used for the synthetic samples, but with significant higher values of 0.93 and 0.67, respectively. The SFH of the eMSTO is still much more extended than that of the synthetic sample, with () = (). Based on this statistical analysis, we conclude that the SGB and RC morphologies do not agree with the eMSTO if age spreads are entirely responsible for the width of the eMSTO 444Our adopted isochrones are the most up-to-date publicly available isochrones based on the PARSEC tracks (Bressan et al., 2012), with a mass resolution of 0.05 M⊙, whereas the mass resolution of Goudfrooij et al. (2015) is 0.01 M⊙. However, their models are not publicly available..
The time-scales characteristic of the SGB phase for stars of different masses deserve further discussion. From the best-fitting isochrones, we found that the masses of SGB stars with an age of 1.38 Gyr are roughly 1.63 M⊙, whereas the masses of SGB stars with an age of 2.18 Gyr are close to 1.38 M⊙. Using the stellar evolutionary tracks from Bertelli et al. (2008), we estimated that the average time-scale for the SGB phase of both of those types of stars are 15 Myr and 50 Myr, respectively555The evolutionary tracks of Bertelli et al. (2008) only provide discrete physical parameters of stellar mass, helium abundance and metallicity. We selected = 0.26 and = 0.002 for our estimates, which are the closest values to the physical parameters adopted here. Clearly, if there is an age difference among the observed SGB stars, then more faint SGB stars should be expected. However, as shown in Fig. 3, there are no SGB stars associated with the old isochrone.
4 Discussion
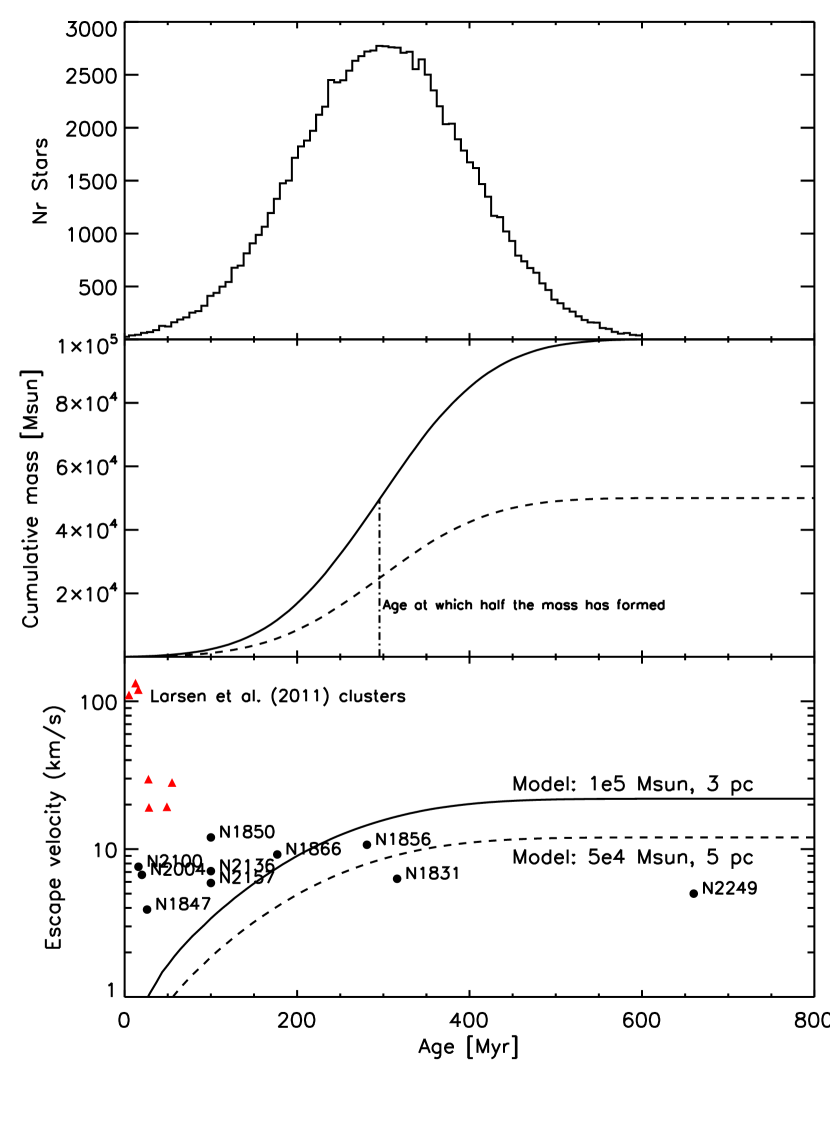
Goudfrooij et al. (2014) proposed a scenario which invokes two distinct star-formation episodes in massive star clusters. In their model, the second star-formation episode, which can last several hundred million years following an initial near-instantaneous starburst, is responsible for the observed eMSTO. Although the available observations do not directly advocate a two-burst SFH for the clusters thus far analysed – i.e., only a single Gaussian SFH is inferred from the eMSTO, in tension with the Goudfrooij et al. (2014) scenario, while the stellar age distribution in the young cluster NGC 1856 appears to be inconsistent with such a scenario (e.g., Milone et al., 2015) – this type of scenario is required if significant age spreads are the cause of the observed eMSTOs. This is so, because if the SFH directly inferred from the eMSTO were adopted, this would imply that clusters initially had very low masses (and thus a very low escape velocity) and needed to build up their masses over the course of several hundred million years. If this scenario were realistic, then we would expect to see many young clusters with ages of 10 Myr to 100 Myr in the process of building up their stellar masses. This is demonstrated in Fig. 10, where the required build-up of mass is compared with a sample of LMC and other extragalactic clusters.
This scenario would result in an unphysical build-up of stellar mass, i.e., it raises the question as to why a low-mass cluster with a low velocity dispersion would be able to retain and accrete gas to form second-generation stars. Additionally, the observed clusters do not show evidence of ongoing star formation (Bastian et al., 2013), nor of the build-up of their stellar mass over time in a way consistent with the SFHs inferred from the eMSTOs. Hence, either the intermediate-age eMSTO clusters are unique in their SFHs, or they did not build up their stellar masses over hundreds of millions of years.
Another critical ingredient informing our discussion is that NGC 411 has a total mass of only 4.51 (McLaughlin & van der Marel, 2005)666Note that this value is lower than that adopted by Goudfrooij et al. (2014), because the latter authors use a single power-law stellar initial mass function instead of a more realistic Chabrier-type representation. We can thus calculate (Georgiev et al., 2009),
| (1) |
where is the cluster mass at time in units of M⊙, is the cluster’s half-light radius in pc at time and is a coefficient which depends on the concentration index of King (1962) models. Based on the assumptions that the half-mass radius of NGC 411 is roughly equal to its half-light radius – = 6.1 pc (Goudfrooij et al., 2014) – and 0.10 (the average value derived from table 2 of Georgiev et al., 2009), the resulting escape velocity for NGC 411 is = 7.24 km s-1, where the uncertainty is based on a range of from 0.075 to 0.130, as well as on the uncertainty in . Clearly, the escape velocity of NGC 411 is much lower than the threshold of 12–15 km s-1 proposed by Goudfrooij et al. (2014). These authors asserted that this threshold is consistent with the wind velocities of intermediate-mass AGB and massive binary stars.
In the Goudfrooij et al. (2014) model, massive star clusters may have experienced significant mass loss during their early evolutionary stages owing to strong tidal stripping (Vesperini et al., 2009). If NGC 411 has lost a large amount of its initial mass, this may suggest that its escape velocity could have been much higher in the past. However, the current position of NGC 411 is at a distance of approximately 11 kpc from the SMC’s centre (Glatt et al., 2008), and thus the strength of the tidal field it has experienced is much lower than that in the simulation of D’Ercole et al. (2008) adopted by Goudfrooij et al. (2014), in which clusters were located some 3 kpc from the Milky Way centre. This is also discussed in detail in Cabrera-Ziri et al. (2016b)
4.1 Rapid stellar rotation
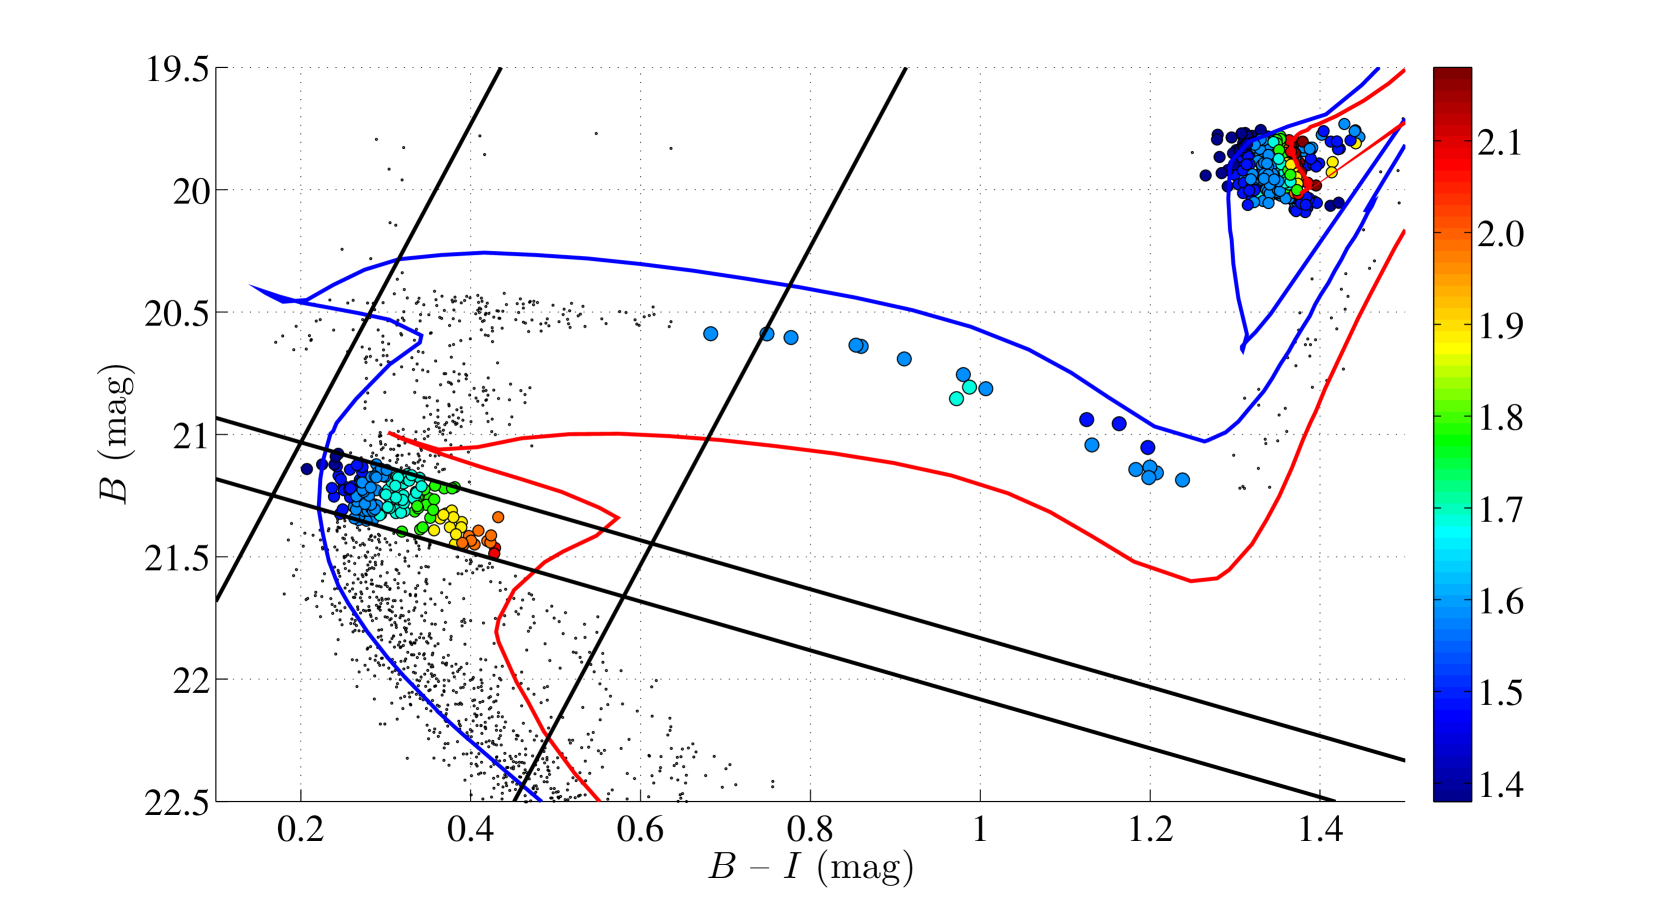
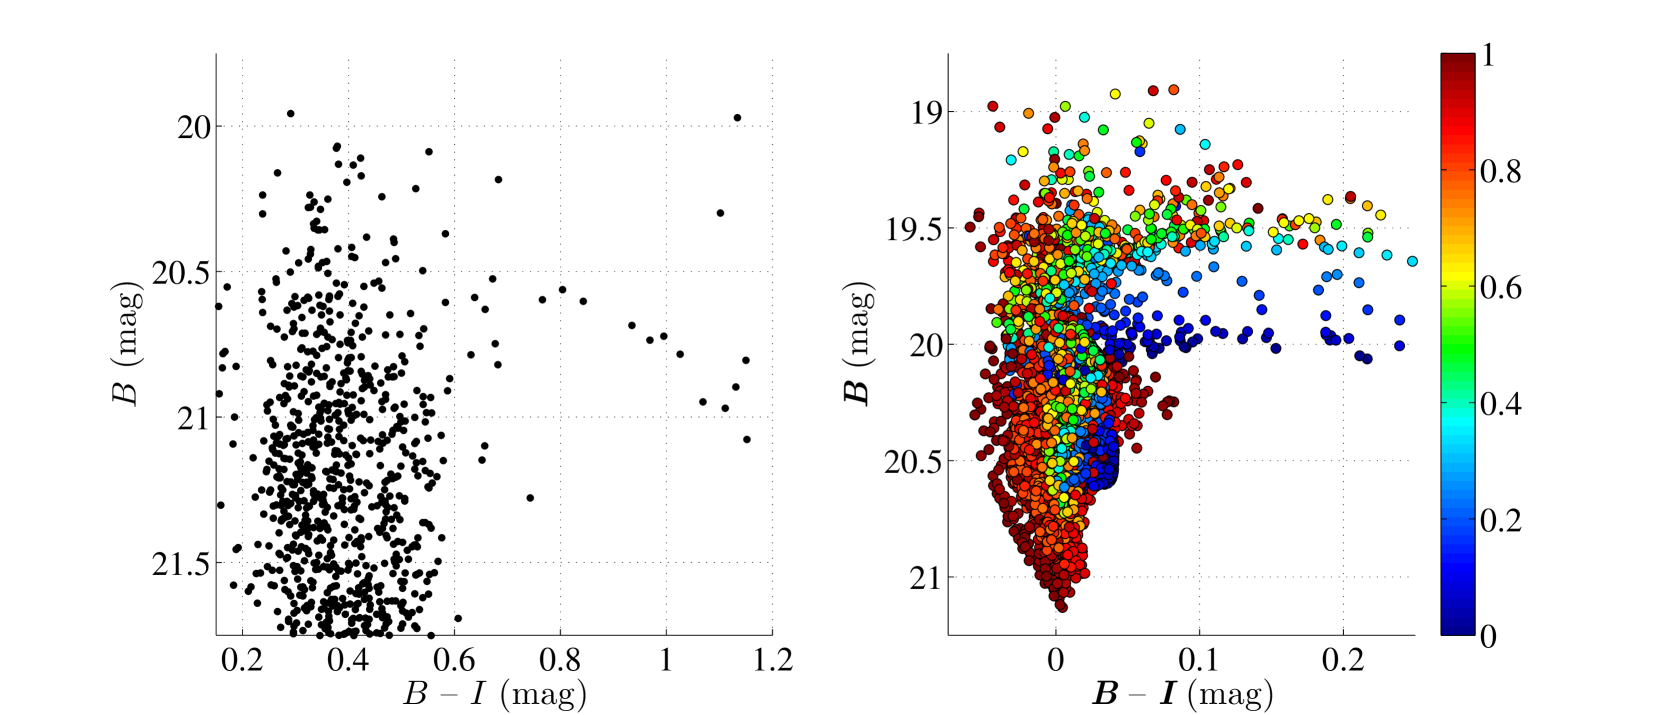
A number of researchers have shown that inferring age spreads in intermediate-age star clusters on the basis of their eMSTO morphology is likely invalid if many MSTO stars are fast rotators (Bastian & de Mink, 2009; Yang et al., 2013; Li, de Grijs & Deng, 2014a, b; Brandt & Huang, 2015). The overall effect of rapid stellar rotation is complicated. Many small contributions (e.g., gravity darkening, stellar rotational mixing, hydrodynamic effects, etc.) may result in a not-so-simple morphology of their colour–magnitude distribution. A reasonable expectation is that a combination of those effects should be at work in NGC 411. If rotational mixing also plays a role in broadening the MSTO region, this would still give rise to a broadened or split SGB (for a discussion, see Li, de Grijs & Deng, 2014b). To obtain a comparison of our observations with numerical calculations, we used the Geneva population synthesis code (Ekström et al., 2012; Georgy et al., 2014) to generate a CMD including stars with a range of rotation rates, based on their interactive tools.777http://obswww.unige.ch/Recherche/evol/-Database- Their models are available for nine different rotation rates (/ = 0.0, 0.1, 0.3, 0.5, 0.6, 0.7, 0.8, 0.9 and 0.95, where is the stellar surface angular velocity and is the stellar break-up angular velocity Georgy et al. (2014)), but their models only work for stars with masses above 1.7 M⊙. Figure 11 shows a comparison of the observations (left) and the synthetic CMD (right). The latter contains stars with various initial rotation rates and most of the adopted physical parameters are equal to our previous fits: we adopted a metallicity of = 0.002 and a distance modulus of mag. However, note that the default extinction in the Geneva models is fixed at = 0 mag. The photometric magnitude system of the Geneva models is the genuine Johnson–Cousins system, which is different from that of our observations (which uses the HST/WFC3 UVIS magnitude system). As shown in the right-hand panel of Fig. 11, SGB stars with different initial rotation rates (indicated by the colour bar) produce a clear, extended SGB. Clearly, this is not found in our observations.
The inconsistency between the simulated CMD and the observations thus leaves us with a conundrum, since it seems that our currently favoured solution is invalid. However, the age of NGC 411 reaches 1.58 Gyr, while currently the Geneva models can only extend down to age of ( yr-1) = 9.00 (1 Gyr) for the physical parameters adopted here. This means that we cannot make a direct comparison. Additionally, we note that in the Geneva models, stars that rotate (even with small values of 0.2 and higher) converge to occupy a narrow SGB. It is only non-rotating stars that would be expected to form a second sequence that have luminosities below the main SGB. The effects of rapid stellar rotation are very complicated, since rotational mixing may also lead to chemical anomalies. The discovery of nitrogen and helium enhancements in massive MS stars has generally been recognised as being caused by rotational mixing (Schönberner et al., 1988; Gies & Lambert, 1992). Enhanced helium abundances, as well as increased metallicities, will impact the morphology of the observed CMD (e.g., Piotto et al., 2007; Milone et al., 2012); see also the RC discussion of Cole (1998). It is not entirely clear what the rotational scenario would predict for the RC. For younger clusters, Niederhofer et al. (2015) showed that the RC is expected to be narrower than in the case of real age spreads, but still more extended than an SSP, this is also consistent with our observations of SRC. The RC is also metallicity-dependent, and rapid stellar rotation may also affect the patterns of the stellar surface chemical abundance. To understand the eMSTO conundrum, more detailed studies of the effects of rapid stellar rotation, as well as of binarity fractions in intermediate-age star clusters are required. Altogether, at this stage, we cannot directly compare the models and observations before we extend the stellar evolutionary tracks for different rotational rates to lower masses.
5 Conclusions
In this paper, we have tested the interpretation of an internal age spread as the possible explanation of the eMSTO morphology in NGC 411 by exploring its SGB. Our results show that the width of the SGB in NGC 411 does not suggest any significant age spread, despite the fact that it exhibits an apparent eMSTO region with a putative spread of up to 1 Gyr. Except for a single star, we found that the observed SGB is well fitted by a simple-aged stellar population of 1.58 Gyr, which is not consistent with the age distribution inferred from the eMSTO region. We also found that the SFH derived from the RC is consistent with that obtained from the SGB; most RC and SGB stars are younger than 1.78 Gyr. Our comparison among the SFHs derived using SGB, RC and eMSTO stars shows that they do not support an age spread of 800 Myr as derived from the eMSTO region.
We conclude that the observed tight SGB and RC exclude the presence of a significant age spread in NGC 411. The scenario proposed by Goudfrooij et al. (2014), which invokes two distinct star-formation events to build up the stellar mass of star clusters within several hundred million years, seems unphysical for NGC 411, since its escape velocity is much lower than that suggested by Goudfrooij et al. (2014) and NGC 411 has unlikely undergone significant mass loss in the past. The presence of an eMSTO in NGC 411 cannot be explained by an extended SFH. This is also consistent with the recent study of Piatti & Bastian (2016) who found eMSTOs in two intermediate-age LMC clusters with masses of 5000 M⊙.
However, we cannot directly compare the simulations with our observations of NGC 411 based on the stellar rotation scenario because the models do not currently extend to this mass range. A direct explanation of the observed eMSTO, combined with the tight SGB, is that the eMSTO may be caused by rapid stellar rotation, whereas fast rotators would quickly slow down when they evolve off the MS owing to the conservation of angular momentum. However, rotational mixing may also complicate the morphology of the SGB. We assert that to understand the observed eMSTOs in intermediate-age star clusters, more detailed investigations of rapid stellar rotation, as well as its effects on stellar surface abundances, are required.
Acknowledgements
We thank Sylvia Ekström for assistance and discussions. C. L. is partially supported by the Strategic Priority Programme ‘The Emergence of Cosmological Structures’ of the Chinese Academy of Sciences (grant XDB09000000) and by the Macquarie Research Fellowship Scheme. R. d. G. and L. D. acknowledge funding from the National Natural Science Foundation of China (NSFC; grants 11073001, 11373010 and 11473037). N. B. is partially funded by a Royal Society University Research Fellowship and an European Research Council Consolidator Grant (Multi-Pop; 646928). F. N. was supported by the DFG Cluster of Excellence ‘Origin and Structure of the Universe’. C.Z. and his advisor Chen Li would acknowledge the support by “973 Program” 2014 CB845702, the Strategic Priority Research Program “The Emergence of Cosmological Structures” of the Chinese Academy of Sciences (CAS; grant XDB09010100)
References
- Bastian & de Mink (2009) Bastian N., de Mink S. E., 2009, MNRAS, 398, L11
- Bastian et al. (2013) Bastian N., Cabrera-Ziri I., Davies B., Larsen S. S., 2013, MNRAS, 436, 2852
- Bastian & Niederhofer (2015) Bastian N., Niederhofer F., 2015, MNRAS, 448, 1863
- Bertelli et al. (2008) Bertelli G., Girardi L., Marigo P., Nasi E., 2008, A&A, 484, 815
- Brandt & Huang (2015) Brandt T. D., Huang C. X., 2015, ApJ, 807, 25
- Bressan et al. (2012) Bressan A., Marigo P., Girardi L., Salasnich B., Dal Cero C., Rubele S., Nanni A., 2012, MNRAS, 427, 127
- Cabrera-Ziri et al. (2014) Cabrera-Ziri I., Bastian N., Davies B., Magris G., Bruzual G., Schweizer F., 2014, MNRAS, 441, 2754
- Cabrera-Ziri et al. (2016a) Cabrera-Ziri I., Niederhofer F., Bastian N., et al., 2016, MNRAS, 459, 4218
- Cabrera-Ziri et al. (2016b) Cabrera-Ziri I., Bastian N., Hilker M., et al., 2016, MNRAS, 457, 809.
- Chabrier (2001) Chabrier G., 2001, ApJ, 554, 1274
- Cole (1998) Cole A. A. 1998, ApJ, 500, L137
- D’Antona et al. (2015) D’Antona F., Di Criscienzo M., Decressin T., Milone A. P., Vesperini, E., Ventura, P., 2015, MNRAS, 453, 2637
- Davis (1994) Davis L. E., 1994, A Reference Guide to the IRAF/DOLPHOT Package, http://iraf.noao.edu/iraf/web/docs/recommend.html (accessed February 2015)
- Deheuvels et al. (2015) Deheuvels S., Ballot J., Beck P. G., et al., 2015, A&A, 580, A96
- D’Ercole et al. (2008) D’Ercole A., Vesperini E., D’Antona F., McMillan S. L. W., Recchi S., 2008, MNRAS, 391, 825
-
Dolphin (2011)
Dolphin A., 2011, DOLPHOT/WFC3
user’s guide, version 2.0.
http://americano.dolphinsim.com/dolphin/dolphinWFC3.pdf (accessed February 2015) -
Dolphin (2013)
Dolphin A., 2013, DOLPHOT user’s
guide, version 2.0.
http://americano.dolphinsim.com/dolphin/dolphin.pdf (accessed February 2015) - Ekström et al. (2012) Ekström S., Georgy C., Eggenberger P., et al., 2012, A&A, 537, A146
- Georgiev et al. (2009) Georgiev I. Y., Hilker M., Puzia T. H., Goudfrooij P., Baumgardt H., 2009, MNRAS, 396, 1075
- Georgy et al. (2014) Georgy C., Granada A., Ekström S., Meynet G., Anderson R. I., Wyttenbach A., Eggenberger P., Maeder A., 2014, A&A, 566, A21
- Gies & Lambert (1992) Gies D. R., Lambert D. L., 1992, ApJ, 387, 673
- Girardi, Eggenberger & Miglio. (2011) Girardi L., Eggenberger P., Miglio A., 2011, MNRAS, 412, L103
- Girardi et al. (2013) Girardi L., Goudfrooij P., Kalirai J. S., et al., 2013, MNRAS, 431, 3501
- Glatt et al. (2008) Glatt K., Grebel E. K., Sabbi E., et al., 2008, AJ, 136, 1703
- Goudfrooij et al. (2014) Goudfrooij P., Girardi L., Kozhurina-Platais V., et al., 2014, ApJ, 797, 35
- Goudfrooij et al. (2015) Goudfrooij P., Girardi L., Rosenfield P., Bressan A., Marigo P., Correnti M., Puzia T. H., 2015, MNRAS, 450, 1693
- Hu et al. (2010) Hu Y., Deng L., de Grijs R., Liu Q., Goodwin S. P., 2010, ApJ, 724, 649
- Keller et al. (2012) Keller S. C., Mackey A. D., Da Costa G. S., 2012, ApJ, 761, L5
- King (1962) King I., 1962, AJ, 67, 471
- Langer (2012) Langer N., 2012, ARA&A, 50, 107
- Larsen et al. (2011) Larsen S. S., de Mink S. E., Eldridge J. J., et al., 2011, A&A, 532, A147
- Li, de Grijs & Deng (2013) Li C., de Grijs R., Deng L., 2013, MNRAS, 436, 1497
- Li, de Grijs & Deng (2014a) Li C., de Grijs R., Deng L., 2014a, ApJ, 784, 157
- Li, de Grijs & Deng (2014b) Li C., de Grijs R., Deng L., 2014b, Nature, 516, 367
- Li et al. (2016) Li C., de Grijs R., Deng L., Geller A. M., Xin Y., Hu Y., Faucher-Giguère C., 2016, Nature, 529, 502
- Longmore et al. (2014) Longmore S. N., Kruijssen J. M. D., Bastian N., et al., 2014, Protostars and Planets VI, 291
- Mackey & Broby Nielsen (2007) Mackey A. D., Broby Nielsen P., 2007, MNRAS, 379, 151
- Mackey et al. (2008) Mackey A. D., Broby Nielsen P., Ferguson A. M. N., Richardson J. C., 2008, ApJ, 681, L17
- Marigo et al. (2008) Marigo P., Girardi L., Bressan A., Groenewegen M. A. T., Silva L., Granato G. L., 2008, A&A, 482, 883
- McLaughlin & van der Marel (2005) McLaughlin D. E., van der Marel R. P., 2005, ApJS, 161, 304
- Meynet & Maeder (2000) Meynet G., Maeder A., 2000, A&A, 361, 101
- Milone et al. (2009) Milone A. P., Bedin L. R., Piotto G., Anderson J., 2009, A&A, 497, 755
- Milone et al. (2012) Milone A. P., Piotto G., Bedin L. R., et al., 2012, A&A, 540, A16
- Milone et al. (2012) Milone A. P., Piotto G., Bedin L. R., et al., 2012, ApJ, 744, 58
- Milone et al. (2015) Milone A. P., Bedin L. R., Piotto G., et al., 2015, MNRAS, 450, 3750
- Niederhofer et al. (2015) Niederhofer F., Hilker M., Bastian N., Silva-Villa E., 2015, A&A, 575, A62
- Niederhofer et al. (2015b) Niederhofer F., Georgy C., Bastian N., Ekström S., 2015, MNRAS, 453, 2070
- Niederhofer et al. (2016) Niederhofer F., Bastian N., Kozhurina-Platais V., Hilker M., de Mink S. E., Cabrera-Ziri I., Li C., Ercolano B., 2016, A&A, 586, 148
- Piatti & Bastian (2016) Piatti A. E., Bastian N., 2016, A&A, in press (arXiv: 1603.06891)
- Piotto et al. (2007) Piotto G., Bedin L. R., Anderson J., et al., 2007, ApJ, 661, L53
- Reggiani & Meyer (2011) Reggiani M. M., Meyer M. R., 2011, ApJ, 738, 60
- Schönberner et al. (1988) Schönberner D., Herrero A., Becker S., Eber F., Butler K., Kudritzki R. P., Simon K. P., 1988, A&A, 197, 209
- Tayar & Pinsonneault (2013) Tayar J., Pinsonneault M. H., 2013, ApJ, 775, L1
- Vesperini et al. (2009) Vesperini E., McMillan S. L. W., Portegies Zwart S., 2009, ApJ, 698, 615
- Yang et al. (2013) Yang W., Bi S., Meng X., Liu Z., 2013, ApJ, 776, 112