Raman signatures of inversion symmetry breaking and structural phase transition in type-II Weyl semimetal MoTe2
Abstract
Transition metal dichalcogenide MoTe2 is an important candidate for realizing the newly predicted type-II Weyl fermions, for which the breaking of the inversion symmetry is a prerequisite. Here we present direct spectroscopic evidence for the inversion symmetry breaking in the low temperature phase of MoTe2 by systematic Raman experiments and first principles calculations. We identify five lattice vibrational modes which are Raman active only in the low temperature noncentrosymmetric structure. A hysteresis is also observed in the peak intensity of inversion symmetry activated Raman modes, confirming a temperature induced structural phase transition with a concomitant change in the inversion symmetry. Our results provide definitive evidence for the low temperature noncentrosymmetric Td phase from vibrational spectroscopy, and suggest MoTe2 as an ideal candidate for investigating the temperature induced topological phase transition.
Layered transition metal dichalcogenides (TMDs) have attracted extensive research interests due to their intriguing physical properties for both fundamental research and potential applications in electronics, optoelectronics, spintronics and valleytronics StranoRev ; ZhangHRev . So far most of the research has been focused on semiconducting TMDs with hexagonal or trigonal (2H or 1T) structures which show strong quantum confinement effects in atomically thin films. In recent years, TMDs with monoclinic 1T′ and orthorhombic Td phase have been proposed to be important host materials for realizing novel topological quantum phenomena, e.g. quantum spin Hall effect FuLSci2014 ; zheng2016quantum and Weyl fermions Soluyanov2015Type . Weyl fermions were originally introduced in high energy physics by Hermann Weyl Weyl1929 , and their condensed matter physics counterparts have not been realized until recently in Weyl semimetals in the TaAs family Xu2015TOPOLOGICAL ; Lv2015Observation ; Lv2015Experimental . Weyl fermions can be realized by breaking either the time reversal symmetry or inversion symmetry of a three dimensional Dirac fermion such that a pair of degenerate Dirac points separate into two bulk Weyl points with opposite chiralities, which are connected by topological Fermi arcs when projected onto the surface. Recently, it has been predicted that a new type of Weyl fermions can be realized in TMDs. Different from type-I Weyl fermions which have point-like Fermi surface and obey Lorentz invariance, the newly predicted type-II Weyl fermions emerge at the topological protected touching points of an electron and a hole pocket with strongly tilted Weyl cones Soluyanov2015Type . Such type-II Weyl fermions break Lorentz invariance and therefore do not have counterparts in high energy physics.
Type-II Weyl fermions have been first predicted in the orthorhombic (Td) phase of WTe2 with space group Pmn21 Soluyanov2015Type . However, it is challenging to observe the extremely small Fermi arcs in WTe2 due to the small separation of the Weyl points (0.7% of the Brillouin zone). Weyl fermions have also been predicted in the low temperature phase of MoTe2 with much larger Fermi arcs Sun2015Prediction ; Wang2015MoTe2 , and signatures of the Fermi arcs have been suggested in a combined angle-resolved photoemission spectroscopy (ARPES) and scanning tunneling spectroscopy (STS) study Deng2016 and other ARPES studies KaminskiARPES ; YLChenARPES ; DingARPES ; ZhouARPES ; BaumbergerARPES . The existence of Weyl fermions has been relied on the assumption that the low temperature phase of MoTe2 is isostructural to the noncentrosymmetric Td phase of WTe2 Sun2015Prediction ; Wang2015MoTe2 . The high temperature monoclinic 1T′ phase with an inclined staking angle of has a centrosymmetric P21/m space group. Although a temperature induced structural transition with a change in the stacking angle from to 90∘ has been reported both crystallographyically Clarke ; Dawson1987 and computationally Chang2015Arc , there are two possible space groups can be assigned to the low temperature orthorhombic phase - noncentrosymmetric Pmn21 and centrosymmetric Pnmm Clarke . Previous X-ray diffraction study was limited to resolve the subtle differences between these two space groups to provide conclusive evidence on the inversion symmetry Clarke . Recent ARPES studies have detected Fermi arcs at low temperature Td phase, but the evolution of band dispersions from high to low temperature has not been reported. Meanwhile the absence of Fermi arcs at high temperature 1T′ phase are difficult to be observed because of the reduction of Resolution. So ARPES is not suitable for the research of symmetry breaking during phase transition in MoTe2. Since the noncentrosymmetry is a prerequisite for realizing Weyl fermions for non-magnetic materials, it is critical to reveal the inversion symmetry breaking from spectroscopic measurements which are directly sensitive to the crystal symmetry.
Results
Polarized Raman spectra. In this paper, we provide direct experimental evidence for the inversion symmetry breaking in the low temperature phase of MoTe2 and study its evolution across the temperature induced structural phase transition using Raman vibrational spectroscopy. Our Raman measurements reveal the emergence of five Raman and IR active modes in the low temperature phase, and they are in good agreement with first principles calculations and symmetry analysis of the Td phase. These peaks are however absent in the high temperature centrosymmetric 1T′ phase, suggesting that they are Raman signatures for the breaking of the inversion symmetry. A clear hysteresis is observed in the peak intensity of two A1 modes - the shear mode at 13 cm-1 and the out-of-plane vibration mode at 130 cm-1. Our results provide clear evidence for the lack of inversion symmetry in the low temperature Td phase from a lattice dynamics point of view, and indicate that MoTe2 can be a good candidate for studying the temperature induced topological phase transition.
| 1T′ Phase | |||||||||||||
| Raman Active | |||||||||||||
| Ag | 78 | 89 | 114 | 119 | 133 | 134 | 157 | 166 | 240 | 252 | 268 | 271 | |
| 77 | 88 | 110.8 | 116 | 128 | 128 | 158 | 164 | ||||||
| label | a | b | c | d | e | f | g | h | |||||
| Bg | 93 | 98 | 112 | 115 | 200 | 204 | |||||||
| 90 | 94 | 107 | 111.4 | 191 | 193 | ||||||||
| label | i | j | k | l | m | n | |||||||
| IR Active | |||||||||||||
| Au | 0 | 36 | 115 | 119 | 192 | 194 | |||||||
| label | N′ | ||||||||||||
| Bu | 0 | 0 | 11 | 37 | 120 | 129 | 136 | 142 | 211 | 212 | 275 | 276 | |
| label | A′ | Q′ | D′ | S′ | |||||||||
| Td Phase | |||||||||||||
| Raman Active | |||||||||||||
| A2 | 36 | 98 | 112 | 115 | 192 | 200 | |||||||
| 96 | 108 | 112.0 | 188 | 194 | |||||||||
| label | G | H | I | J | K | ||||||||
| Raman & IR Active | |||||||||||||
| A1 | 0 | 14 | 78 | 115 | 129 | 133 | 142 | 165 | 211 | 248 | 267 | 276 | |
| 13 | 77 | 112.5 | 128 | 132 | 165 | ||||||||
| label | A | B | C | D | E | F | |||||||
| B1 | 0 | 93 | 115 | 119 | 194 | 205 | |||||||
| 92 | 111 | 115 | |||||||||||
| label | L | M | N | ||||||||||
| B2 | 0 | 37 | 89 | 119 | 121 | 134 | 136 | 159 | 211 | 248 | 270 | 277 | |
| 88 | 118 | 118 | 129 | 131 | 159 | ||||||||
| label | O | P | Q | R | S | T | |||||||
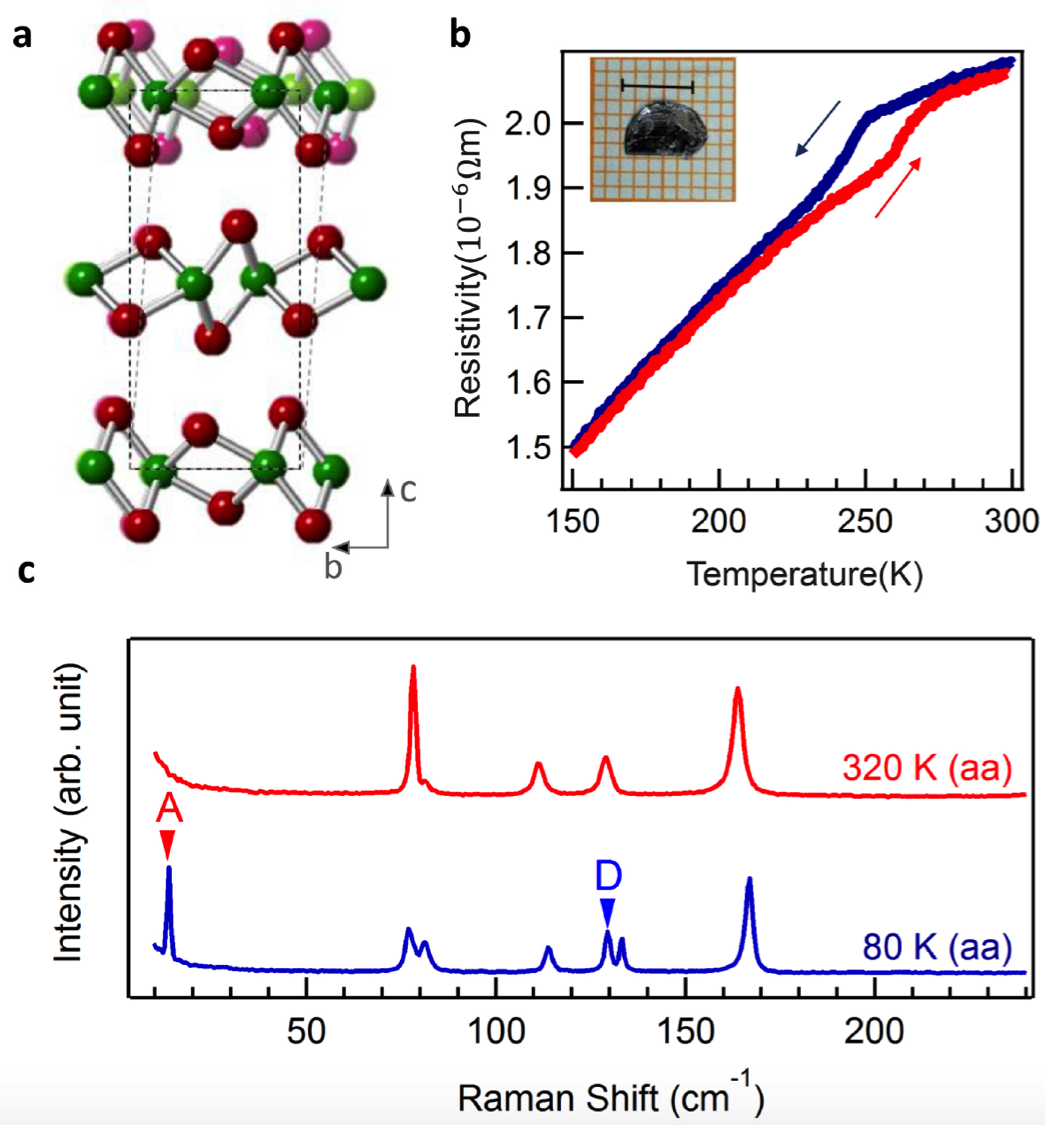
Figure 1(a) shows a comparison of the low temperature (solid) and high temperature (shadow) phases with corresponding space groups of Pmn21 and P2m respectively. They share almost the same in-plane crystal structure with zigzag Mo metal chains and distorted Te octahedra. The structural phase transition is revealed by an anomaly in the temperature-dependent resistivity Hughes , which occurs at 260 K upon warming and 250 K upon cooling (Fig. 1(b)). Figure 1(c) shows the Raman spectra at 320 K and 80 K respectively on cleaved bulk single crystals. The polarizations for incident and scattered photons are denoted by two letters representing the crystal axes. For example, aa shows that both the incident and scattered photons are polarized along the a-axis direction. Here, we used the crystal axes of Td phase to denote the polarization directions and all single crystal samples were oriented using Laue diffraction patterns (see Supplementary Figure 1) before performing Raman characterizations. The comparison of Raman spectra reveals two new peaks labeled by A and D only in the low temperature Td phase, suggesting that these Raman peaks may link with the structural phase transition.
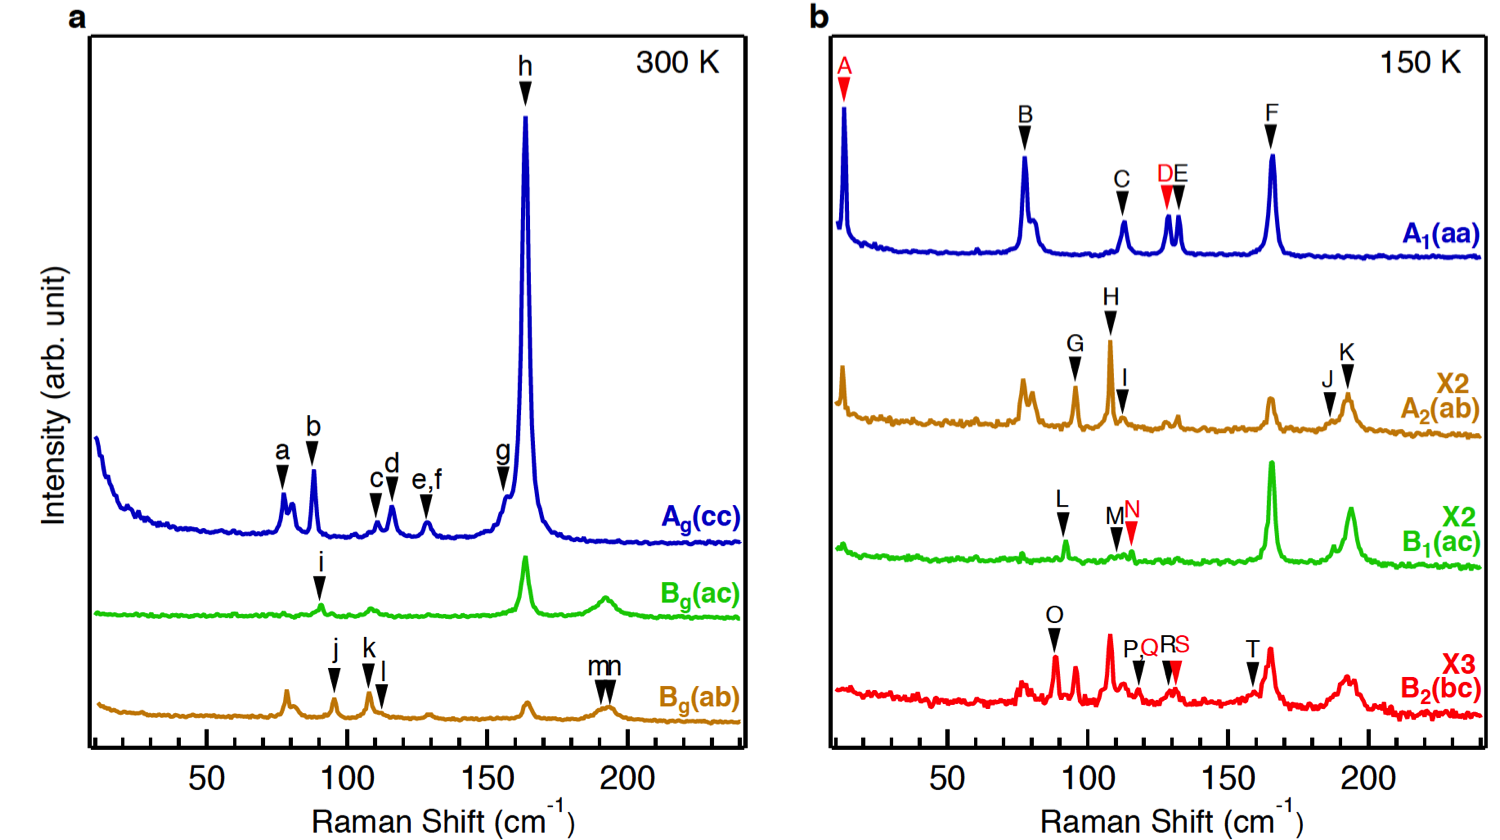
To understand the Raman modes, we first perform group theory analysis. Both the 1T′ phase and Td phase have 12 atoms in one unit cell and correspondingly, there are a total of 36 phonon modes. The vibrational modes in the 1T′ phase decompose into 36 irreducible representations: [12Ag+6Bg]+[5Au+10Bu]+[Au+2Bu], where the first, second, and third groups of irreducible representations correspond to the Raman active, infrared (IR) active, and the acoustic modes, respectively. Since the IR active and Raman active modes are exclusive of each other in centrosymmetric structures, the IR active modes Au and Bu cannot be observed in Raman measurements. In the Td phase, the vibration modes decompose into 36 irreducible representations: [11A1+6A2+5B1+11B2]+[11A1+5B1+11B2]+[A1+B1+B2], where A1, B1, and B2 modes are both IR and Raman active while A2 modes are only Raman active.
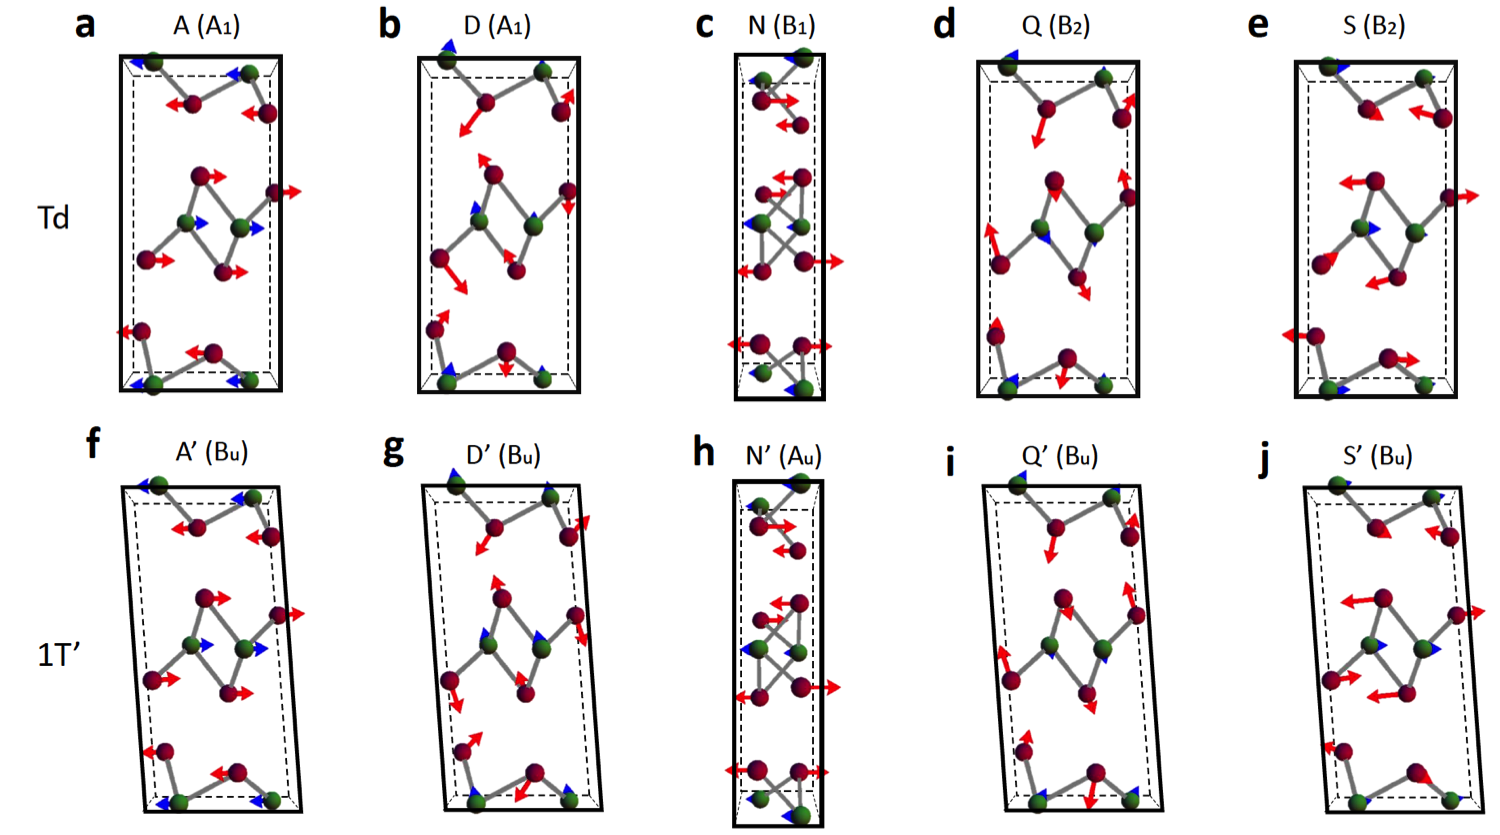
Figure 2 shows an overview of the polarized Raman spectra measured at 300 K and 150 K. Raman selection rules (see Supplementary Table 1, and Table 2) indicate that the Ag modes in 1T′ phase can be observed in the aa, bb, cc, and bc configurations, whereas the Bg modes can be observed in the ac and ab configurations. To obtain all possible phonon modes at low wave number in the 1T′ phase, we performed Raman measurements in the cc, ac, and ab configurations at 300 K. The azimuthal dependence of the Raman peak intensities for Ag and Bg modes (see Supplementary Figure 2) further confirm the good alignment Ribeiro2015Unusual ; He2016Coupling . Eight sharp peaks of pure Ag modes are detected in the cc configuration and all the six Bg modes are found in the ac and ab configurations. The sharp peaks observed are due to improved sample quality and more peaks can be resolved clearly. In the Td phase, the A1 modes can be observed in the aa, bb, and cc configurations, whereas the A2, B1, B2 modes can only be observed in the ab, ac, and bc configurations, respectively. The signal leakage of A1 in other polarization configurations is likely due to the imperfect cleavage of ac and bc surfaces from plate-like samples, but this does not intervene the conclusion. In the low temperature phase, we observe six pure A1 modes in the aa configuration, five A2 modes in the ab configuration, three B1 modes in the ac configuration, and six B2 modes in the bc configuration.
signature of phase transition and symmetry breaking. The comparison of Raman modes between experimental results and theoretical calculations in Table 1 shows a good agreement. Here we focus on Raman active modes that are sensitive to the breaking of the inversion symmetry across the phase transition. Owing to the crystal structure changes only slightly across the phase transition, we can track each phonon mode by comparing their vibrational pattern in these two phases. Since the breaking of inversion center, some Raman in-active modes that belong to Au or Bu representations in the 1T′ phase evolve to A1, B1, or B2 representations that are both IR and Raman active in the Td phase. Thus, the presence of these Raman modes reflects the transition into the noncentrosymmetric phase. Similarly, nonlinear optical method was employed to reveal the lack of inversion symmetry in few-layer MoS2 and h-BN Kumar2013 ; Li2013 .
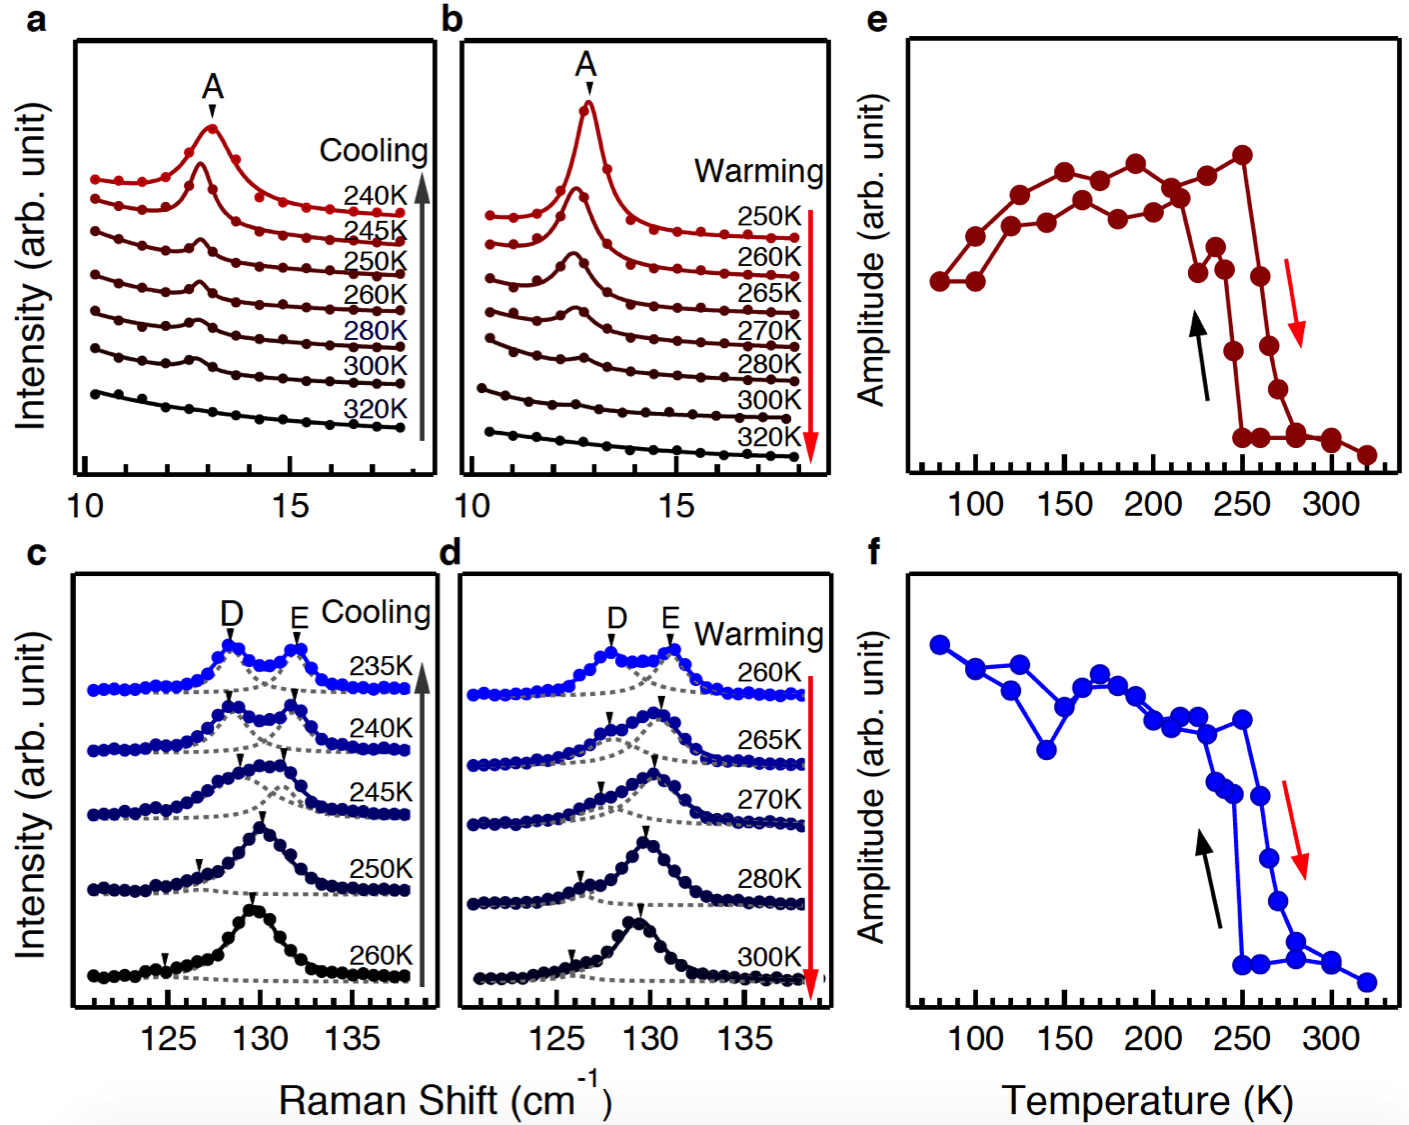
Figure 3 compiles the calculated vibrational patterns for such phonons that are directly sensitive to the inversion symmetry breaking, where the arrows scale the atomic displacements. The upper panels show the vibration modes labeled by A, D, N, Q, S, which indicated by red arrows in Fig. 2(b), where the irreducible representations in the Td phase are given in parenthesis. The lower panels show the corresponding vibration modes labeled by A′, D′, N′, Q′, S′ that belong to the Au and Bu irreducible representations in 1T′ phase. These phonons have almost identical vibrational patterns as A, D, N, Q, S respectively but no Raman activity due to the centrosymmetry. The A and A′ denote interlayer shear modes along the b axis and the A peak is also observed in a previous report Chen2016 . The absence of the vibrational mode along the a axis (labeled as S2 in Ref. Chen2016, ) in our measurements is likely due to Raman scattering matrix element effects or small Raman cross-section. Compared to previous work, here we present a systematic Raman characterization of the low temperature phase by distinguishing all modes that reflect the breaking of the centrosymmetry. The strongest Raman signals that distinguished these two phases are the interlayer shear mode A at 13 cm-1 and another out-of-plane vibration mode D at 130 cm-1. Similar vibrational modes have been reported in many 2D materials, such as multilayer graphene TanNatureMater ; Lui2012Observation ; Lui2013Measurement and TMDs e.g. MoS2, WSe2 TanChemSocRev ; Zhao2013 ; Zhao2013Lattice ; Zhang2013Raman . The low frequancy interlayer shear modes are sensitive to the stacking sequence, layer number, and symmetry, and can be used as a measure of interlayer coupling. In in-plane shear modes all atoms in the same layer all vibrates along the same direction while atoms in two adjacent layers vibrates along opposite directions. If there is an inversion center that lies in the layer, such shear modes have odd parity with respect to the inversion symmetry and therefore are Raman inactive. This is the reason why A mode is invisible in 1T′ MoTe2, opposite to high symmetric 2H-MoS2, MoSe2, WSe2, and 2H-MoTe2. However, when the crystal structure does not hold inversion symmetry, these modes are both Raman and IR active and visible in Raman spectroscopy, giving direct evidence on the breaking of centrosymmetry in the orthorhombic Td structure.
We further track the evolution of peaks A and D that link with the inversion symmetry breaking across the phase transition. The evolution of the A peak at 12.5 cm-1, and D peak at 128.3 cm-1 are displayed in Fig. 4(a-d). Upon warming, the intensity of the A and D peaks decreases with the sharpest decrease at 260 K and eventually disappears above 300 K. Upon cooling, the A and D peaks appears at a lower temperature, and their intensities sharply increases at 250 K, and reach the maximum below 200 K. The intensity of the A and D peaks as a function of temperature is shown in Fig. 4(e, f). The temperature-dependent peak position and FWHM are shown in Supplementary Figure 3. A discontinuity in the temperature dependent peak position can be regarded another signature of structural phase transition of MoTe2. The thermal hysteresis effect in the peak intensity is consistent with our transport measurement, confirming that these peaks directly indicate the structural phase transition from high temperature 1T′ to low temperature Td phase.
Discussion
To summarize, by performing a systematic Raman study using polarization selection rules combined with theoretical calculation, we reveal the Raman signatures of structural phase transition across the 1T′ to Td phase transition and provided unambiguous evidence on the absence of inversion symmetry of Td phase. Our work demonstrates that Td phase of MoTe2 is a strong candidate for both type-II Weyl semimetal and investigating the temperature induced topological phase transition.
Methods
Sample growth and Raman measurement. Single crystals of MoTe2 were grown by chemical vapor transport method as reported previously Deng2016 . Raman scattering experiments were performed in a confocal back-scattering geometry on freshly cleaved single crystal surfaces along the ab, ac, and bc planes. Parallel and cross polarizations between the incident and scattered lights were used. Raman spectra were measured using a Horiba Jobin Yvon LabRAM HR Evolution spectrometer with the = 514 nm excitation source from an Ar laser and a 1800 gr/mm grating. A liquid nitrogen-cooled CCD detector and BragGrate notch filters allow for measurements at low wave numbers. The temperature of the sample was controlled by a liquid-nitrogen flow cryostat and a heater in a chamber with a vacuum better than Torr.
First-principles calculations. To determine the phonon frequencies, we performed first-principles calculations of the phonon modes at the zone center using the Vienna abinitio simulation package (VASP) Kresse1996 with the local density approximation (LDA) Perdew1981 and the projector augmented wave potentials (PAW) Kresse1999 . We set a Monkhorst-Pack k-point mesh and 400 eV cutoff for plane waves. The coordinates and the cell shape in Ref.Dawson1987, have been fully relaxed until the forces acting on the atoms are all smaller than eV/Å. We use the phonopy package Togo2015 , which implements the small displacement method to obtain the phonon frequencies and vibration modes at the point.
Data availability. The data that support the plots within this paper and other findings of this study are available from the corresponding author upon reasonable request.
References
- (1) Wang, Q. H., Kalantar-Zadeh, K., Kis, A., Coleman, J. N. & Strano, M. S. Electronics and optoelectronics of two-dimensional transition metal dichalcogenides. Nat. Nanotechnol. 7, 699–712 (2012).
- (2) Chhowalla, M. et al. The chemistry of two-dimensional layered transition metal dichalcogenide nanosheets. Nat. Chem. 5, 263–275 (2013).
- (3) Qian, X., Liu, J., Fu, L. & Li, J. Quantum spin hall effect in two-dimensional transition metal dichalcogenides. Science 346, 1344–1347 (2014).
- (4) Zheng, F. et al. On the quantum spin hall gap of monolayer 1T′-WTe2. Adv. Mater (2016).
- (5) Soluyanov, A. A. et al. Type-II weyl semimetals. Nature 527, 495–498 (2015).
- (6) Weyl, H. Gravitation and the electron. PNAS 15, 323–334 (1929).
- (7) Xu, S. Y. et al. Topological matter. discovery of a weyl fermion semimetal and topological fermi arcs. Science 349, 613–617 (2015).
- (8) Lv, B. Q. et al. Observation of weyl nodes in TaAs. Nat. Phys. 11 (2015).
- (9) Lv, B. Q. et al. Experimental discovery of weyl semimetal TaAs. Phys. Rev. X 5, 031013 (2015).
- (10) Sun, Y., Wu, S.-C., Ali, M. N., Felser, C. & Yan, B. Prediction of weyl semimetal in orthorhombic . Phys. Rev. B 92, 161107 (2015).
- (11) Wang, Z. et al. Mote2: A type-II weyl topological metal. Phys. Rev. Lett. 117, 056805 (2016).
- (12) Deng, K. et al. Experimental observation of topological Fermi arcs in type-II Weyl semimetal MoTe2. Nat. Phys. doi:10.1038/nphys3871 (2016).
- (13) Huang, L. et al. Spectroscopic evidence for a type II weyl semimetallic state in MoTe2. Nat. Mater. doi:10.1038/nmat4685 (2016).
- (14) Jiang, J. et al. Observation of the Type-II Weyl Semimetal Phase in MoTe2. (2016). eprint Preprint at http://arxiv.org/abs/1604.00139 (2016).
- (15) Xu, N. et al. Discovery of Weyl semimetal state violating Lorentz invariance in MoTe2. (2016). eprint Preprint at http://arxiv.org/abs/1604.02116 (2016).
- (16) Liang, A. et al. Electronic Evidence for Type II Weyl Semimetal State in MoTe2. (2016). eprint Preprint at http://arxiv.org/abs/1604.01706 (2016).
- (17) Tamai, A. et al. Fermi arcs and their topological character in the candidate type-II Weyl semimetal MoTe2. (2016). eprint Preprint at http://arxiv.org/abs/1604.08228 (2016).
- (18) Clarke, R., Marseglia, E. & Hughes, H. P. A low-temperature structural phase transition in -MoTe2. Phil. Mag. B 38, 121–126 (1978).
- (19) Dawson, W. G. & Bullett, D. W. Electronic structure and crystallography of MoTe2 and WTe2. Journal of Physics C Solid State Physics 20, 6159–6174 (1987).
- (20) Chang, T.-R. et al. Prediction of an arc-tunable Weyl Fermion metallic state in MoxW1-xTe2. Nat. Commun. 7, 10639 (2016).
- (21) Hughes, H. P. & Friend, R. H. Electrical resistivity anomaly in -MoTe2 (metallic behaviour). Journal of Physics C Solid State Physics 11, L103–L105 (1978).
- (22) Ribeiro, H. B. et al. Unusual angular dependence of the raman response in black phosphorus. Acs Nano 9, 4270–4276 (2015).
- (23) He, R. et al. Coupling and stacking order of ReS2 atomic layers revealed by ultralow-frequency raman spectroscopy. Nano Lett. 16, 1404–1409 (2016).
- (24) Kumar, N. et al. Second harmonic microscopy of monolayer MoS2. Phys. Rev. B 87, 161403 (2013).
- (25) Li, Y. et al. Probing symmetry properties of few-layer MoS2 and h-BN by optical second-harmonic generation. Nano Lett. 13, 3329–3333 (2013).
- (26) Chen, S.-Y., Goldstein, T., Ramasubramaniam, A. & Yan, J. Inversion-symmetry-breaking-activated shear raman bands in -MoTe2. (2016). eprint Preprint at http://arxiv.org/abs/1602.03566 (2016).
- (27) Tan, P. et al. The shear mode of multilayer graphene. Nat. Mater. 11, 294 (2012).
- (28) Lui, C. H. et al. Observation of layer-breathing mode vibrations in few-layer graphene through combination raman scattering. Nano Lett. 12, 5539–5544 (2012).
- (29) Lui, C. H. & Heinz, T. F. Measurement of layer breathing mode vibrations in few-layer graphene. Phys. Rev. B 87, 1504–1509 (2013).
- (30) Zhou, X. et al. Phonon and raman scattering of two-dimensional transition metal dichalcogenides from monolayer, multilayer to bulk material. Chem. Soc. Rev. 44, 2757 (2015).
- (31) Zhao, Y. et al. Interlayer breathing and shear modes in few-trilayer MoS2 and WSe2. Nano Lett. 13, 1007–1015 (2013).
- (32) Zhao, W. et al. Lattice dynamics in mono- and few-layer sheets of ws2 and wse2. Nanoscale 5, 9677–83 (2013).
- (33) Zhang, X. et al. Raman spectroscopy of shear and layer breathing modes in multilayer mos2. Phys. Rev. B 87, 1504–1509 (2013).
- (34) Kresse, G. & Furthmüller, J. Efficient iterative schemes for ab initio total-energy calculations using a plane-wave basis set. Phys. Rev. B 54, 11169–11186 (1996).
- (35) Perdew, J. P. & Zunger, A. Self-interaction correction to density-functional approximations for many-electron systems. Phys. Rev. B 23, 5048–5079 (1981).
- (36) Kresse, G. & Joubert, D. From ultrasoft pseudopotentials to the projector augmented-wave method. Phys. Rev. B 59, 1758–1775 (1999).
- (37) Togo, A. & Tanaka, I. First principles phonon calculations in materials science. Scripta Materialia 108, 1 – 5 (2015).
Acknowledgements
This work is supported by the National Natural Science Foundation of China (grant No. 11274191, 11334006), Ministry of Science and Technology of China (No. 2015CB921001 and 2012CB932301).
Author contributions
S.Z. and Y.W. conceived the research project. K.Z., H.Z. and K.D. grew and characterized the samples under supervision of Y.W.. K.Z., C.B., X.R. and Y.L. performed the Raman measurements and analyzed the data. Q.G. and J.F. performed the first principle calculations. K.Z., C.B., Q.G. Y.W. and S.Z. wrote the manuscript, and all authors commented on the manuscript.
Competing financial interests The authors declare no competing financial interests.