The mass discrepancy acceleration relation in early-type galaxies: extended mass profiles and the phantom menace to MOND
Abstract
The dark matter (DM) haloes around spiral galaxies appear to conspire with their baryonic content: empirically, significant amounts of DM are inferred only below a universal characteristic acceleration scale. Moreover, the discrepancy between the baryonic and dynamical mass, which is usually interpreted as the presence of DM, follows a very tight mass discrepancy acceleration (MDA) relation. Its universality, and its tightness in spiral galaxies, poses a challenge for the DM interpretation and was used to argue in favour of MOdified Newtonian Dynamics (MOND). Here, we test whether or not this applies to early-type galaxies. We use the dynamical models of fast-rotator early-type galaxies by Cappellari et al. based on ATLAS and SLUGGS data, which was the first homogenous study of this kind, reaching , where DM begins to dominate the total mass budget. We find the early-type galaxies to follow an MDA relation similar to spiral galaxies, but systematically offset. Also, while the slopes of the mass density profiles inferred from galaxy dynamics show consistency with those expected from their stellar content assuming MOND, some profiles of individual galaxies show discrepancies.
keywords:
galaxies: elliptical and lenticular, cD – gravitation – dark matter1 Introduction
The masses of galaxies, and in fact of any larger dynamically bound structure in the Universe, inferred from dynamics are found to exceed the masses of the observed baryons in these structures (Zwicky, 1933, 1937; Rubin & Ford, 1970; Rubin et al., 1980; Bosma, 1978). This phenomenon is usually explained by postulating (non-baryonic) dark matter, which is also the backbone of structure formation in cosmological simulations (e.g. Davis et al., 1985; Boylan-Kolchin et al., 2009) and serves well in accounting for the characteristics of the cosmic microwave background radiation (e.g. Bond & Efstathiou, 1984; Efstathiou et al., 2015).
Sanders (1990) demonstrated a surprising characteristic of this discrepancy between dynamical and baryonic mass: it occurs below a characteristic acceleration level. van den Bosch & Dalcanton (2000) reproduced such a characteristic acceleration scale in the CDM context using semi-analytic models of galaxy formation, which were tuned to reproduce the Tully-Fisher relation. However, Sanders (1990) also found that the amplitude of this discrepancy correlates with the acceleration, the so-called mass discrepancy acceleration (MDA) relation. Moreover, there is only small scatter about this relation, as confirmed by McGaugh (2004). This correlation, and even more its tightness, is surprising in the context of hierarchical structure formation and the large variety of possible merger trees for individual galaxies in CDM cosmology (see also McGaugh 2004, 2014; Walker & Loeb 2014).
So far tests of the MDA relation have concentrated mainly on spiral galaxies. In these systems the H i gas makes it relatively easy to trace the dynamical mass far from the centre of the galaxy. However, spiral galaxies also possess large amounts of baryonic mass in the form of gas. The mass of this component is rather difficult to estimate accurately from observations and introduces uncertainties in the MDA relation. Early-type galaxies (ellipticals and lenticulars), due to their lower H i gas content, do not suffer from this problem, however they lack an easy to measure tracer. For this reason, studies addressing the MDA relation in early-type galaxies have had to largely rely on other tracers such as hot X-ray emitting gas or discrete tracers like planetary nebulae (PNe), globular clusters (GC), and satellite galaxies (e.g. Milgrom 2012; see however Gerhard et al. 2001). While theoretical efforts trying to reproduce the MDA relation in the CDM context are progressing (e.g. Di Cintio & Lelli 2016), it is desirable to push the observational side further, and probe the MDA relation systematically for a sample of early-type galaxies down to low accelerations.
Alternatively, the MDA relation, and its tightness, have been used to argue in favour of a modification of Newtonian dynamics (MOND; see, e.g. Famaey & McGaugh 2012; Wu & Kroupa 2015). A number of previous studies have discussed whether early-type galaxies can be used to falsify the theory (Milgrom & Sanders, 2003; Tiret et al., 2007; Weijmans et al., 2008; Klypin & Prada, 2009; Richtler et al., 2011; Famaey & McGaugh, 2012; Salinas et al., 2012; Samurović, 2014; Chae & Gong, 2015; den Heijer et al., 2015).
Recently, Cappellari et al. (2015, hereafter C+15) carried out dynamical modelling of a sample of 14 early-type galaxies, empowered by the combination of the inner stellar kinematics from ATLAS (Cappellari et al., 2011) and stellar kinematics reaching out to a median radius of about 4 half-light radii (; Arnold et al. 2014) from the SLUGGS survey (Brodie et al., 2014). This represents the first homogeneous, statistically meaningful sample of stellar kinematics of early-type galaxies (all of which are fast rotators as defined in Emsellem et al. 2011) reaching radii where dark matter is expected to dominate the mass budget (i.e. the dark matter fraction increases from 1/3 to 2/3 when measured within 2 and 4 , respectively).
Here we use C+15’s mass modelling results to test whether or not early-type galaxies follow the MDA relation. Furthermore, we test whether or not MOND, which was originally designed to reproduce the rotation curves of spiral galaxies (Milgrom, 1983), fails in early-type galaxies. Finally, we also consider results from mass modelling based on GC kinematics for an extended sample, including slow rotators and reaching even larger radii, also from the SLUGGS survey (Alabi et al., 2016).
2 Sample, Data and Dynamical Modelling
Our primary sample comprises 14 early-type galaxies in a stellar mass range of (Cappellari et al., 2013a). Mass models for these galaxies were built by C+15 using axisymmetric Jeans anisotropic modelling (JAM; Cappellari 2008) with a stellar and a dark matter component. To ensure the method to be applicable, and to achieve a homogenous sample of nearly axisymmetric galaxies, C+15 restricted the sample to fast rotators.
One input to the JAM modelling is the light distributions in these galaxies. Those were parametrized using Multi-Gaussian Expansions (MGE; Emsellem et al. 1994; Cappellari 2002) and were taken from various studies (Emsellem et al. 1999; Cappellari et al. 2006; Scott et al. 2009, 2013; C+15). Here, we use the same characterizations of the distributions of stars within the galaxies. Other galaxy parameters, such as half-light radius and distance, are taken from C+15, and the velocity dispersion within from Cappellari et al. (2013a) and Kormendy & Ho (2013) for NGC 3115.
The combination of data from ATLAS (Cappellari et al., 2011) and SLUGGS (Brodie et al., 2014) allowed C+15 to probe the stellar dynamics of the galaxies from their inner parts out to a median radius of 4 . The stellar kinematics were extracted in the optical (ATLAS; Emsellem et al. 2004; Cappellari et al. 2011) and Ca triplet spectral region (SLUGGS; Arnold et al. 2014), in both cases with pPXF (Cappellari & Emsellem, 2004). For the dynamical modelling the data were symmetrized, outliers were removed, and the two data sets combined. We refer the reader to C+15 for a description of the process. However, we do note the key characteristic of C+15 was the use of a very general parametrization for the dark halo in the modelling process, to be able to focus on the total density profile alone.
The JAM models are very accurate and robust, which was confirmed by comparison with the results of Serra et al. (2016) based on H i data, but despite the increase in radial extent when compared to similar earlier studies, they probe the dynamics to accelerations an order of magnitude higher than those typically probed in spiral galaxies. Alabi et al. (2016) recently applied the tracer mass estimator of Watkins et al. (2010) to the kinematics of the GC systems for a superset of early-type galaxies, mostly from the SLUGGS survey (Brodie et al., 2014). This method estimates the enclosed mass from the line-of-sight velocities of the tracer population based on assumptions for the power-law slope of the gravitational potential, the power-law slope of the tracer density profile, and the orbital anisotropy. While being less reliable, these models allow us to get indications about trends beyond 5 , and also for slow rotators. Alabi et al. analysed the dependence of their mass estimates on these assumptions, took into account corrections for non-sphericity and substructures in the tracer population, and compared their results to previous studies. Their total mass estimates with the assumption of isotropy agree with similar earlier studies within a factor of 1.6. We refer the reader for the details to Alabi et al. and adopt their estimates for isotropic orbits.
The SLUGGS galaxies were selected to be representative early-type galaxies across various environments (see Brodie et al. 2014) and span a wide mass range up to NGC 4486, i.e. M87. For 23 of the 25 SLUGGS galaxies Alabi et al. derived estimates for the total mass within and beyond. Most of the galaxies have rich enough GC data sets to derive not only a single dynamical mass estimate, but also radial mass density profiles. This applies for 10 of the 14 galaxies of our primary sample. Beyond the galaxies common to both samples, the study of Alabi et al. comprises NGC 1400, NGC 3607, NGC 4564, NGC 5866 and also the slow rotators NGC 720, NGC 1407, NGC 3608, NGC 4365, NGC 4374, NGC 4486, and NGC 5846.
3 MDA relation in early-type galaxies
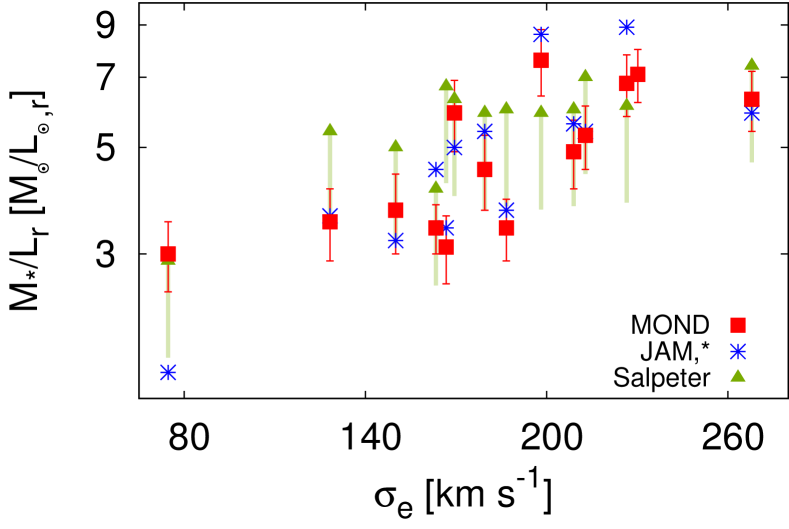
Before analysing the MDA relation, we need to convert the stellar light to stellar mass, in order to estimate the expected accelerations. Several options are available. The stellar populations can be fitted with models to infer a stellar mass-to-light ratio. This requires knowledge of the stellar populations and needs to assume a stellar initial mass function (IMF), which is suspected to vary from galaxy to galaxy (e.g. van Dokkum & Conroy, 2010; Cappellari et al., 2012), even in the framework of MOND (Tortora et al., 2014). The stellar mass-to-light ratio can also be obtained from the dynamical model. For ATLAS, the ratio is then based on the assumption of Newtonian gravity (Cappellari et al., 2013b, denoted as therein). Here, we also compute the stellar mass-to-light ratio by fitting the dynamics expected from the light profile based on MOND to the observed dynamical profile, and with a spatially constant mass-to-light ratio as fitting parameter. This fit is dominated by the inner regions where density and flux are highest.
We compare the various mass-to-light ratios in Fig. 1. Since the MGE used in the dynamical modelling came from observations with different photometric filters, we convert all mass-to-light ratios to the -band, using the photometric predictions of Vazdekis et al. (2012) and Ricciardelli et al. (2012). The various ways of determining the mass-to-light ratio all show the same trend of an increase with increasing velocity dispersion within (see also, e.g., Cappellari et al., 2006; van der Marel & van Dokkum, 2007). This trend is due to underlying changes of the stellar population characteristics, e.g. increasing age and metallicity (and increasing due to changes in the IMF). In the following we use the mass-to-light ratios from the MOND fitting for consistency with the comparisons in Section 4.
In the next step the enclosed mass is calculated, both for the dynamical mass from JAM, which is calculated from the density profiles of C+15, and for the stellar mass. The latter is obtained from the published MGEs of the galaxy light distribution and the spatially constant stellar mass-to-light ratio as follows. The mass of an axisymmetric MGE model, enclosed within a spherical shell of radius is given by
| (1) |
with the MGE parameters for width, flattening, and total mass (, , and ), for each Gaussian component respectively. This equation was obtained by integration of the density profile in terms of the MGE as given in footnote 11 of C+15.
In addition to stellar and dynamical mass, the Newtonian acceleration due to the baryons is needed for the MDA relation, and it is given in the spherical limit by
| (2) |
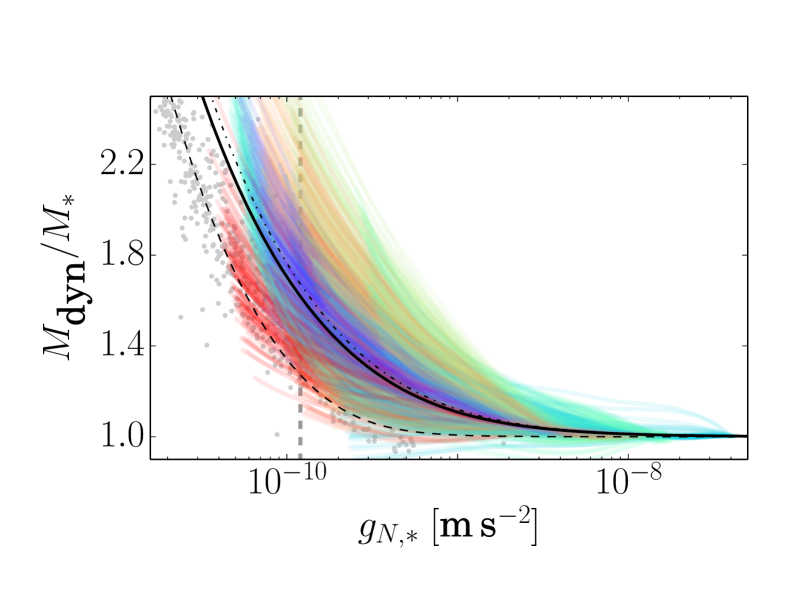
We calculate uncertainties in a Monte Carlo fashion, by randomly perturbing the density profiles of C+15 within their errors (see Sec. 4). However, rather than using only formal uncertainties, we try to be conservative and account for systematic uncertainties as follows. We adopt a 6% uncertainty in the overall mass normalization as inferred by Cappellari et al. (2013a) and an upper limit of 0.11 in the profile slope, derived from the observed scatter in C+15. Therefore, we perturb the profiles by adding a random constant with dex to log, and by adding a linear trend in versus with a random slope (). We calculate and plot for each galaxy 100 realizations of this process.
The resulting MDA relation is plotted for all 14 galaxies in the left-hand panel of Fig. 2. It shows that our fast rotators follow a relation similar to that found for spiral galaxies, with the dynamical to stellar mass discrepancy systematically increasing with decreasing acceleration at that radius.
4 Comparison to modified Newtonian Dynamics
Milgrom (1983) introduced a modification to Newtonian dynamics as an alternative to dark matter in explaining flat rotation curves in spiral galaxies (for recent reviews see Famaey & McGaugh 2012; Bugg 2015, and the entire Special Issue in which it was published).
In Newtonian dynamics the acceleration caused by a spherical matter distribution within a radius is given by Equation (2). In MOND the acceleration felt by matter is modified. Under the assumption of spherical symmetry the two quantities are related by
| (3) |
with the interpolating function and a characteristic acceleration scale m s-2. For high accelerations () , i.e. the modification vanishes and the Newtonian limit applies. Equation (3) can be easily inverted
| (4) |
with . One common choice for the interpolating function , especially on galactic scales, is the simple interpolating function , so that .
The dynamically inferred mass , when assuming Newtonian dynamics, is then given by (see, e.g., Milgrom, 2012)
| (5) |
This offers a natural explanation for flat rotation curves in disc galaxies and for the baryonic Tully-Fisher relation (see, e.g., Famaey & McGaugh 2012), and it means a Newtonian observer concludes the presence of – from the MOND point of view ‘phantom’ – dark matter given by .
In terms of the MDA this leads to a simple prediction, which is plotted as the black solid curve in Fig. 2 (see also, e.g., Kroupa 2015 for a more theoretical account). Given the uncertainties the MOND curve looks like a rather good representation for our sample.
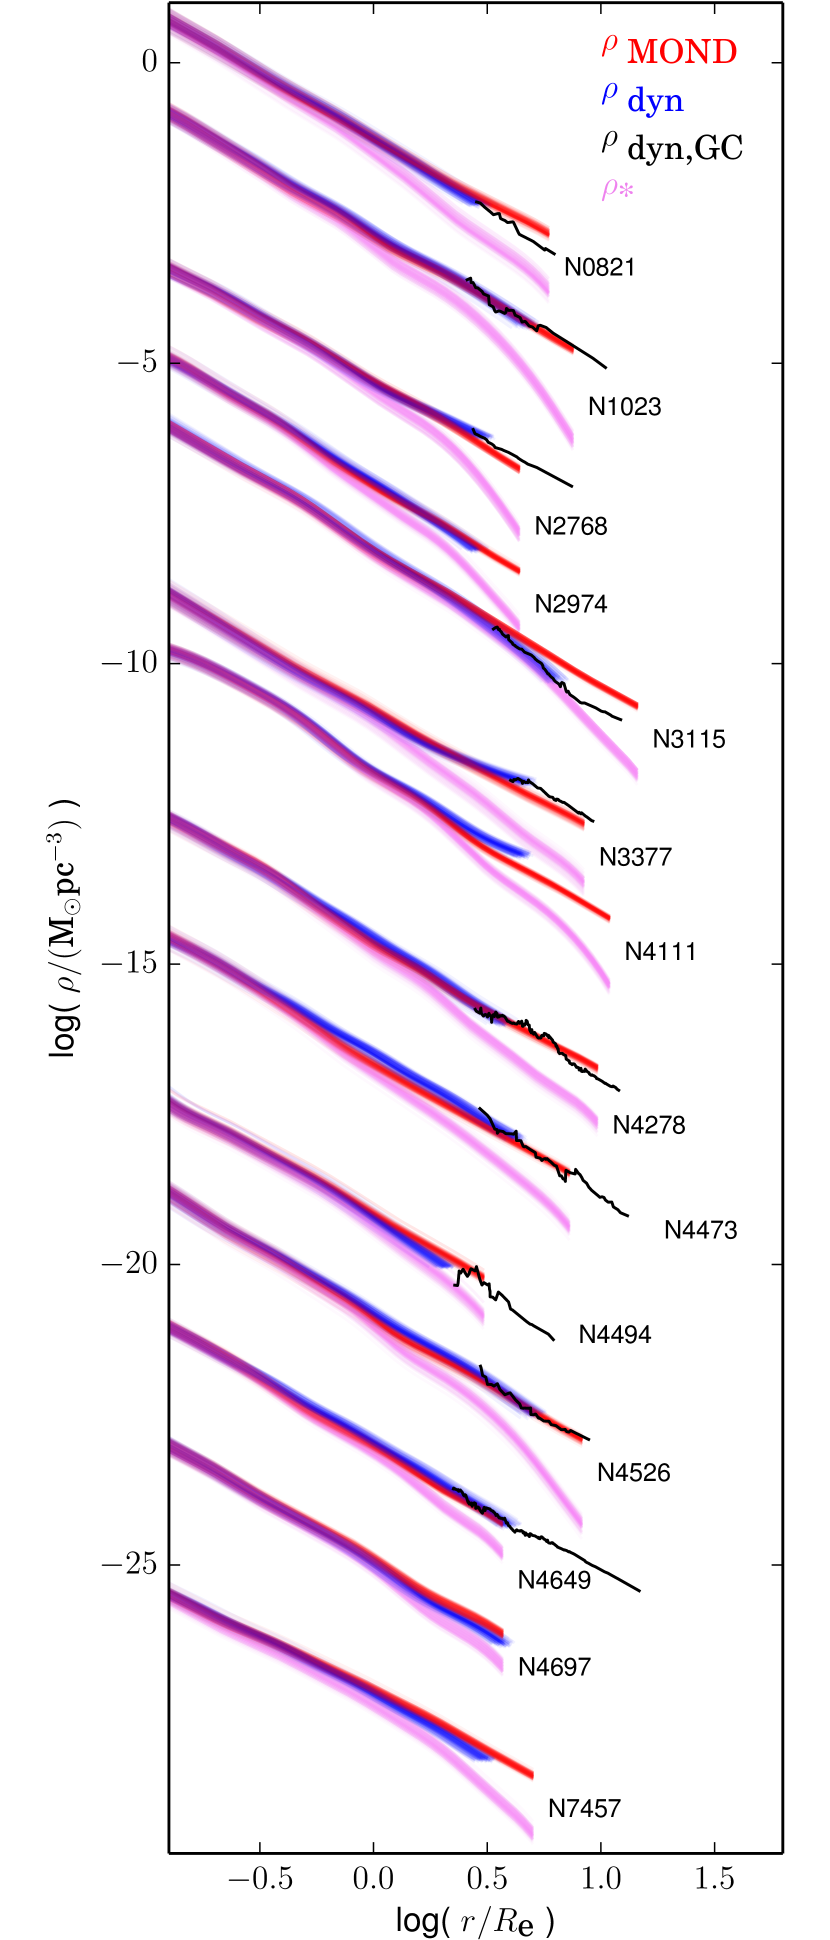
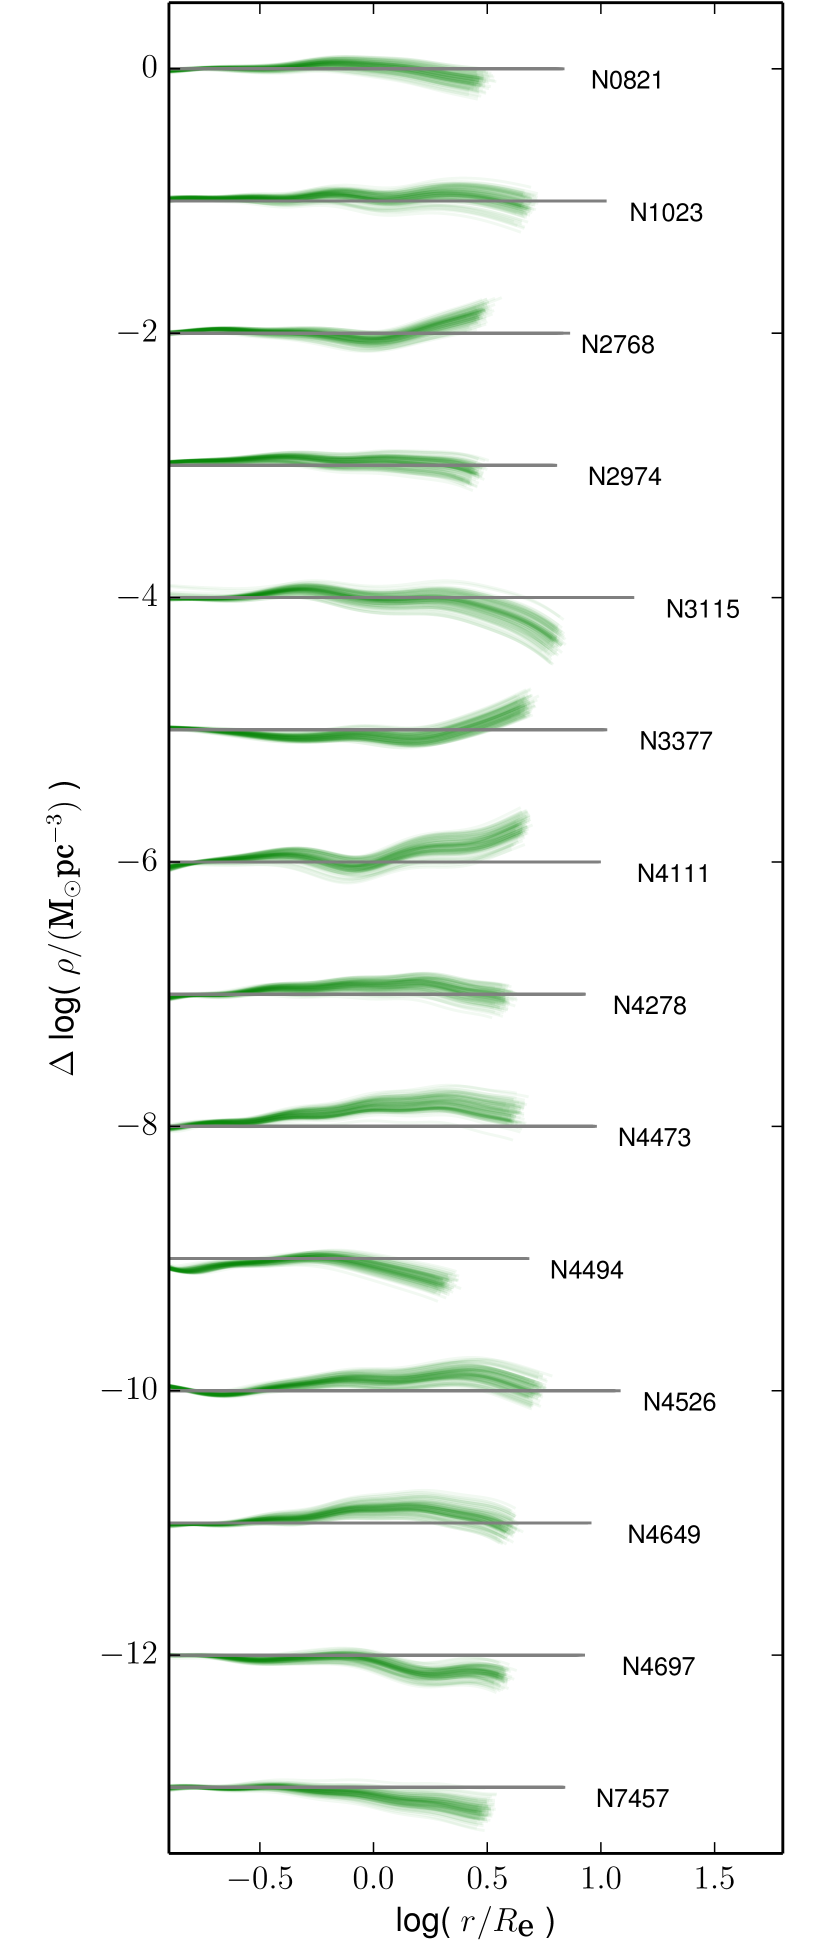
C+15 found the galaxies to have nearly isothermal mass density profiles (), with only small amounts of scatter, which was confirmed by Serra et al. (2016) for a sample of early-type galaxies based on H i data. In Fig. 3 the stellar density profile, the dynamical mass density profile from C+15, and that predicted from the stellar density profile using MOND are shown. It can be seen that the MOND profiles reproduce the slopes of the dynamically determined profiles well. This is not a surprise, since galaxies have asymptotically isothermal profiles in MOND. However, when compared in more detail, for each galaxy individually, inconsistencies become noticeable. There are galaxies like NGC 3115 that start to diverge strongly from the MOND prediction at the outermost radii, but also galaxies like NGC 4473 and NGC 4494 for which features at smaller radii are not well reproduced. This becomes especially evident when considering the residual profiles in the right panel, which are calculated individually for each Monte Carlo representation.
5 Discussion
The general reproduction of the MDA and the slopes of the density profile by MOND is intriguing at first. We note that this is achieved without fitting for the MOND acceleration scale, but using for all galaxies a value of m s-2, which was found by Begeman et al. (1991) for spiral galaxies, and which is still used in more recent studies (e.g. Famaey & McGaugh, 2012). The sensitivity to the exact value is not very critical, as can be seen in the comparison curve in the MDA relation for another value m s-2, which was also used for spiral galaxies (e.g. Famaey et al. 2007).
However, as C+15 showed, the dynamical profiles can also be expected to be simple power-laws in the CDM context out to about 10 . Furthermore, the profile for individual cases are less consistent as mentioned above.
Our analysis makes a few potentially limiting assumptions, such as a spatially constant mass-to-light ratio and anisotropy. C+15 accounted for two individual anisotropies in the inner and outer part. Also, for the calculation of the MONDian predictions we assumed spherical symmetry, which may seem to be a rather strong assumption given that the galaxies in our sample are – often flattened – fast rotators. Ciotti et al. (2006) and Nipoti et al. (2007) demonstrated that the expected deviations due to non-sphericity effects on the non-linear MOND equivalent of Poisson equation are however small even in flat spiral galaxies. The modelling uncertainties are dominated by systematics, which can be important in individual cases. For this reason significant progress can best be made in a statistical manner using large galaxy samples.
With this in mind, the following could be considered as a more serious challenge for MOND than the mismatches for individual galaxies. We showed our comparisons with the MOND predictions when using the simple interpolating function, since it gives more consistent results for our sample than the standard one (cf. also Famaey & Binney, 2005; Sanders & Noordermeer, 2007; Weijmans et al., 2008; Milgrom, 2012; Chae & Gong, 2015). While changing the MOND constant within the range of values used for spiral galaxies only leads to minor changes, switching to the standard interpolating function has more severe effects. The number of density profiles that are still consistent with MOND given our assumptions and estimates of uncertainties is roughly halved as compared to that when using the simple interpolating function. In the MDA relation this is even more evident. The calculation with the standard interpolating function largely underpredicts the mass discrepancy for our sample (Fig. 2) and marks essentially the lower edge of the trend of observed MDA curves, while the MDA relation calculated with the simple interpolating function runs through the middle of this trend. However, the opposite is true for the comparison sample of spirals from Famaey & McGaugh (2012), for which the standard interpolating function provides a superior representation. This is at odds with MOND, where there should be one universal interpolating function and MDA relation.
The above is consistent with Gerhard et al.’s (2001) results from stellar dynamics. They concluded that, from their analysis of the MDA for a sample of early-type galaxies, the upturn of the MDA relation occurs at higher accelerations than for spiral galaxies, in disagreement with MOND (when using accelerations based on the dynamics as in their fig. 19 our Fig. 2 looks similar). Their sample included two of our galaxies and also slow rotators. At that time, Milgrom & Sanders (2003) doubted that the change in the mass-to-light ratios, which is what Gerhard et al. actually plotted, marked the onset of the mass discrepancy, and pointed out discrepancies between the results of Gerhard et al. and the profiles of Romanowsky et al. (2003) for the galaxies common to both studies.
Even with the combination of stellar kinematics from ATLAS and SLUGGS surveys we only reach radii at which dark matter just starts to be dominant – and where the accelerations just decrease to values of the order of the MOND constant . Using GC kinematics from the SLUGGS survey, Alabi et al. studied dynamical models for a superset of galaxies reaching beyond . The conclusions based on these should be considered more tentative, since they are less robust than those from the JAM modelling. Here, we are interested in the comparison to the MOND expectations. These were obtained by fitting the MOND profile to the JAM density profile via the (spatially constant) mass-to-light ratio as a fitting parameter. In Fig. 3, we vertically shift the density profiles of Alabi et al. so that they match the JAM profiles in the radial overlap region for comparison to the same MOND profiles. The Alabi et al. profiles are less smooth due to the discrete nature of the tracers, but give nonetheless some indication how the dynamically inferred density profiles in Fig. 3 continue at larger radii. In some cases, e.g. NGC 821, the deviations from MOND increase, while in other cases, e.g. NGC 3377, the onset of the deviation appears less critical, since the continuation is close to consistent with MOND. Previous studies with dynamical tracers concluded that NGC 821 is MONDian to 3.5 , using PNe (Milgrom & Sanders, 2003), while Samurović (2014) could not reconcile NGC 3115 with MOND, similar to our analysis. The same applies to NGC 4278, which is in our analysis only marginally inconsistent.
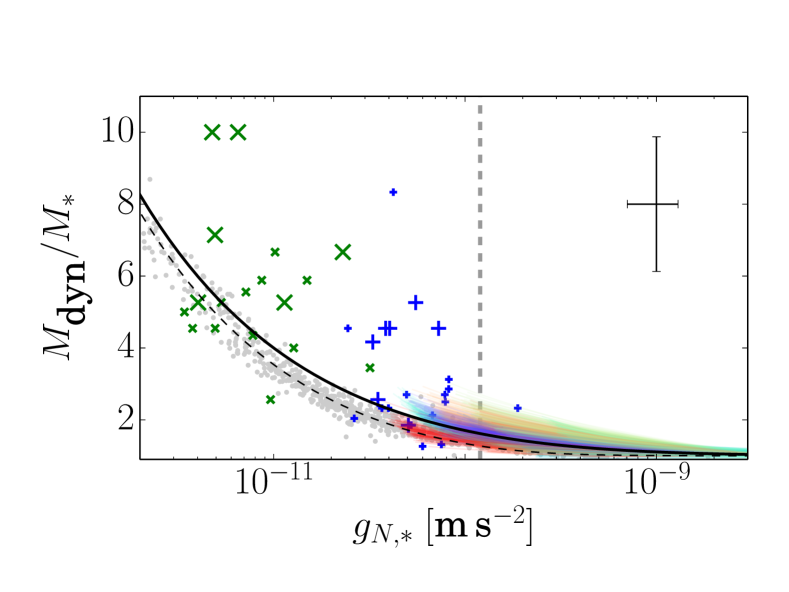
For the MDA relation, adding the Alabi et al. data is problematic, since their profiles are non-monotonic and ‘jumpy’, again due to the discrete nature of the tracers. Instead, we use the total masses and dark matter fractions at 5 and at from their table A4. The resulting dynamical-to-stellar mass ratios and accelerations are shown in the right-hand panel of Fig. 2, including their 11 additional galaxies. The sample of fast rotators, which overlaps with our sample of galaxies with stellar dynamics, generally appears to follow the same MDA. The even larger scatter prevents conclusions as to which interpolating function performs better.
However, the GC system data seem also to suggest that the slow rotators have systematically higher dynamical-to-stellar mass ratios, despite the large uncertainties. This is qualitatively consistent with Samurović (2014), who generally found more severe inconsistencies with MOND for slow rotators based on binned kinematics of GC systems, also using SLUGGS data (see also Angus 2008 for an account of pressure supported dwarf spheroidals within MOND). While these tentative GC based conclusions do not share the robustness of those based on the JAM models (which were reinforced by Serra et al. 2016), they suggest an interesting trend of increasing offsets in the MDA relation from spiral galaxies to fast rotators to slow rotators. In the framework of MOND, these findings may be explained by unseen (normal) matter, which is known to be required in this context on the larger scales of galaxy groups and clusters (Sanders, 1999; Angus et al., 2008).
In the above context it is noteworthy that den Heijer et al. (2015) found for the ATLAS galaxies with H i data that the baryonic Tully-Fisher relation has little scatter – which would be consistent with the MOND framework. However, Trujillo-Gomez et al. (2011) previously found an offset between the baryonic Tully-Fisher relation for spiral and early-type galaxies.
6 Summary
We analysed the mass discrepancy acceleration (MDA) relation for early-type galaxies by using the dynamical models for the stellar dynamics of 14 fast rotators of Cappellari et al. (2015). The range, robustness, and accuracy of these models allowed us to determine that, while the galaxies broadly follow such a relation, they are systematically offset from the comparison sample of spiral galaxies (Famaey & McGaugh, 2012). This adds to the challenges found for MOND when comparing the dynamically determined profiles to the MOND predictions for individual galaxies. Meanwhile, the simulations of Di Cintio & Lelli (2016) demonstrated that the MDA for spiral galaxies could arise in CDM from variations of the dark matter profile shape with galaxy mass, instead of a universal NFW profile. Our analysis predicts the corresponding models for fast-rotator early types to be offset from the MDA for spiral galaxies.
Acknowledgements
We are grateful for the referee’s suggestions, which improved the presentation of our results. JJ and DAF thank the ARC for financial support via DP130100388. MC acknowledges support from a Royal Society University Research Fellowship. LC was supported by the MIUR grant PRIN 2010-2011, project ‘The chemical and dynamical evolution of the Milky Way and Local Group Galaxies’, prot. 2010LY5N2T.
References
- Alabi et al. (2016) Alabi A. B., et al., 2016, MNRAS, 460, 3838
- Angus (2008) Angus G. W., 2008, MNRAS, 387, 1481
- Angus et al. (2008) Angus G. W., Famaey B., Buote D. A., 2008, MNRAS, 387, 1470
- Arnold et al. (2014) Arnold J. A., et al., 2014, ApJ, 791, 80
- Begeman et al. (1991) Begeman K. G., Broeils A. H., Sanders R. H., 1991, MNRAS, 249, 523
- Bond & Efstathiou (1984) Bond J. R., Efstathiou G., 1984, ApJ, 285, L45
- Bosma (1978) Bosma A., 1978, PhD thesis, Rijksuniversiteit Groningen
- Boylan-Kolchin et al. (2009) Boylan-Kolchin M., Springel V., White S. D. M., Jenkins A., Lemson G., 2009, MNRAS, 398, 1150
- Brodie et al. (2014) Brodie J. P., et al., 2014, ApJ, 796, 52
- Bugg (2015) Bugg D. V., 2015, Can. J. Phys., 93, 119
- Cappellari (2002) Cappellari M., 2002, MNRAS, 333, 400
- Cappellari (2008) Cappellari M., 2008, MNRAS, 390, 71
- Cappellari & Emsellem (2004) Cappellari M., Emsellem E., 2004, PASP, 116, 138
- Cappellari et al. (2006) Cappellari M., et al., 2006, MNRAS, 366, 1126
- Cappellari et al. (2011) Cappellari M., et al., 2011, MNRAS, 413, 813
- Cappellari et al. (2012) Cappellari M., et al., 2012, Nature, 484, 485
- Cappellari et al. (2013a) Cappellari M., et al., 2013a, MNRAS, 432, 1709
- Cappellari et al. (2013b) Cappellari M., et al., 2013b, MNRAS, 432, 1862
- Cappellari et al. (2015) Cappellari M., et al., 2015, ApJ, 804, L21 (C+15)
- Chae & Gong (2015) Chae K.-H., Gong I.-T., 2015, MNRAS, 451, 1719
- Ciotti et al. (2006) Ciotti L., Londrillo P., Nipoti C., 2006, ApJ, 640, 741
- Davis et al. (1985) Davis M., Efstathiou G., Frenk C. S., White S. D. M., 1985, ApJ, 292, 371
- den Heijer et al. (2015) den Heijer M., et al., 2015, A&A, 581, A98
- Di Cintio & Lelli (2016) Di Cintio A., Lelli F., 2016, MNRAS, 456, L127
- Efstathiou et al. (2015) Efstathiou G., et al., 2015, arXiv, p. arXiv:1502.01589
- Emsellem et al. (1994) Emsellem E., Monnet G., Bacon R., 1994, A&A, 285, 723
- Emsellem et al. (1999) Emsellem E., Dejonghe H., Bacon R., 1999, MNRAS, 303, 495
- Emsellem et al. (2004) Emsellem E., et al., 2004, MNRAS, 352, 721
- Emsellem et al. (2011) Emsellem E., et al., 2011, MNRAS, 414, 888
- Famaey & Binney (2005) Famaey B., Binney J. J., 2005, MNRAS, 363, 603
- Famaey et al. (2007) Famaey B., Gentile, G., Bruneton, J.-P., & Zhao, H. 2007, Phys. Rev. D, 75, 6
- Famaey & McGaugh (2012) Famaey B., McGaugh S. S., 2012, Living Reviews in Relativity, 15, 10
- Gerhard et al. (2001) Gerhard O., Kronawitter A., Saglia R. P., Bender R., 2001, AJ, 121, 1936
- Klypin & Prada (2009) Klypin A., Prada F., 2009, ApJ, 690, 1488
- Kormendy & Ho (2013) Kormendy J., Ho L. C., 2013, ARA&A, 51, 511
- Kroupa (2015) Kroupa P., 2015, Can. J. Phys., 93, 169
- McGaugh (2004) McGaugh S. S., 2004, ApJ, 609, 652
- McGaugh (2014) McGaugh S., 2014, Galaxies, 2, 601
- Milgrom (1983) Milgrom M., 1983, ApJ, 270, 365
- Milgrom (2012) Milgrom M., 2012, Phys. Rev. Lett., 109, 131101
- Milgrom & Sanders (2003) Milgrom M., Sanders R. H., 2003, ApJ, 599, L25
- Nipoti et al. (2007) Nipoti C., Londrillo P., Zhao H., Ciotti L., 2007, MNRAS, 379, 597
- Ricciardelli et al. (2012) Ricciardelli E., Vazdekis A., Cenarro A. J., Falcón-Barroso J., 2012, MNRAS, 424, 172
- Richtler et al. (2011) Richtler T., Famaey B., Gentile G., Schuberth Y., 2011, A&A, 531, A100
- Romanowsky et al. (2003) Romanowsky A. J., Douglas N. G., Arnaboldi M., Kuijken K., Merrifield M. R., Napolitano N. R., Capaccioli M., Freeman K. C., 2003, Science, 301, 1696
- Rubin & Ford (1970) Rubin V. C., Ford W. K. J., 1970, ApJ, 159, 379
- Rubin et al. (1980) Rubin V. C., Thonnard N., Ford W. K. J., 1980, ApJ, 238, 471
- Salinas et al. (2012) Salinas R., Richtler T., Bassino L. P., Romanowsky A. J., Schuberth Y., 2012, A&A, 538, A87
- Samurović (2014) Samurović S., 2014, A&A, 570, A132
- Sanders (1990) Sanders R. H., 1990, A&ARv, 2, 1
- Sanders (1999) Sanders R. H., 1999, ApJ, 512, L23
- Sanders & Noordermeer (2007) Sanders R. H., Noordermeer E., 2007, MNRAS, 379, 702
- Santos-Santos et al. (2016) Santos-Santos I. M., Brook C. B., Stinson G., Di Cintio A., Wadsley J., Domínguez-Tenreiro R., Gottlöber S., Yepes G., 2016, MNRAS, 455, 476
- Scott et al. (2009) Scott N., et al., 2009, MNRAS, 398, 1835
- Scott et al. (2013) Scott N., et al., 2013, MNRAS, 432, 1894
- Serra et al. (2016) Serra, P., Oosterloo, T., Cappellari, M., den Heijer, M., & Józsa, G. I. G. 2016, MNRAS, 460, 1382
- Tiret et al. (2007) Tiret O., Combes F., Angus G. W., Famaey B., Zhao H. S., 2007, A&A, 476, L1
- Tortora et al. (2014) Tortora C., Romanowsky A. J., Cardone V. F., Napolitano N. R., Jetzer P., 2014, MNRAS, 438, L46
- Trujillo-Gomez et al. (2011) Trujillo-Gomez S., Klypin A., Primack J., Romanowsky A. J., 2011, ApJ, 742, 16
- van den Bosch & Dalcanton (2000) van den Bosch F. C., Dalcanton J. J., 2000, ApJ, 534, 146
- van der Marel & van Dokkum (2007) van der Marel R. P., van Dokkum P. G., 2007, ApJ, 668, 756
- van Dokkum & Conroy (2010) van Dokkum P. G., Conroy C., 2010, Nature, 468, 940
- Vazdekis et al. (2012) Vazdekis A., Ricciardelli E., Cenarro A. J., Rivero-González J. G., Díaz-García L. A., Falcón-Barroso J., 2012, MNRAS, 424, 157
- Walker & Loeb (2014) Walker M. G., Loeb A., 2014, Contemp. Phys., 55, 198
- Watkins et al. (2010) Watkins L. L., Evans N. W., An J. H., 2010, MNRAS, 406, 264
- Weijmans et al. (2008) Weijmans A.-M., Krajnović D., van de Ven G., Oosterloo T. A., Morganti R., de Zeeuw P. T., 2008, MNRAS, 383, 1343
- Wu & Kroupa (2015) Wu X., Kroupa P., 2015, MNRAS, 446, 330
- Zwicky (1933) Zwicky F., 1933, Helv. Phys. Acta, 6, 110
- Zwicky (1937) Zwicky F., 1937, ApJ, 86, 217