AGN driven perturbations in the Intra-cluster medium of cool core cluster ZwCl 2701
Abstract
We present the results obtained from a total of 123 ks X-ray (Chandra) and 8 hrs of 1.4 GHz radio (Giant Metrewave Radio Telescope - GMRT) observations of the cool core cluster ZwCl 2701 ( = 0.214). These observations of ZwCl 2701 showed the presence of an extensive pair of ellipsoidal cavities along the East and West directions within the central region 20 kpc. Detection of bright rims around the cavities suggested that the radio lobes displaced X-ray emitting hot gas forming shell-like structures. The total cavity power (mechanical power) that directly heated the surrounding gas and cooling luminosity of the cluster were estimated to be 2.27 erg s-1 and erg s-1 , respectively. Comparable values of cavity power and cooling luminosity of ZwCL 2701 suggested that the mechanical power of the AGN outburst is large enough to balance the radiative cooling in the system. The star formation rate derived from the H luminosity was found to be 0.60 yr-1 which is about three orders of magnitude lower than the cooling rate of 196 yr-1. Detection of the floor in entropy profile of ZwCl 2701 suggested the presence of an alternative heating mechanism at the centre of the cluster. Lower value of the ratio (10-2) between black hole mass accretion rate and Eddington mass accretion rate suggested that launching of jet from the super massive black hole is efficient in ZwCl 2701. However, higher value of ratio (103) between black hole mass accretion rate and Bondi accretion rate indicated that the accretion rate required to create cavities is well above the Bondi accretion rate.
keywords:
galaxies:active-galaxies:general-galaxies:clusters:individual:ZwCl 2701-Intracluster medium-X-rays:galaxies:clusters1 Introduction
Active galactic nuclei (AGN) feedback plays an important role in the evolution of non-thermal radio jets and lobes (radio bubbles) ejected from the central supermassive black hole (SMBH). These jets and lobes, filled with relativistic plasma, interact with the surrounding environment releasing a large amount of energy. Such examples are seen in 70% relaxed, cool-core galaxy clusters (Burns 1990; Dunn & Fabian 2006; Best et al. 2007; Mittal et al. 2009). The brightest cluster galaxy (BCG) at the core of the cool core clusters is found to be radio loud galaxy (Gitti et al. 2015) where jets from the AGN in the galaxy extend outwards in a bipolar flow and inflate the lobes. These lobes push the X-ray emitting hot gas in the Intra-cluster Medium (ICM) and create X-ray deficiency regions called as “cavities” (Rafferty et al., 2006). The availability of high angular resolution X-ray imaging detectors onboard Chandra observatory made it possible to detect such cavities in several of the clusters (Rafferty et al. 2006; Bîrzan et al. 2008; Dunn et al. 2010; O’Sullivan et al. 2011; David et al. 2009; Pandge et al. 2013; Gitti et al. 2012). It is believed that these cavities are filled with non-thermal radio lobes consisting of relativistic particles and magnetic field. This has been supported by the observations of radio lobes that spatially match with the X-ray cavities in many clusters (Gitti et al. 2012; McNamara & Nulsen 2007). Independent studies of Perseus cluster by several researcher have demonstrated that the AGN in the cluster has sufficient power to offset the cooling flow by inflating cavities inducing weak shocks and sound waves (Fabian et al. 2006; Nulsen et al. 2005; Forman et al. 2005; Forman et al. 2007; Sanders & Fabian 2007; Fabian et al. 2003, 2006; Bîrzan et al. 2004; Dunn & Fabian 2006, 2008; Rafferty et al. 2006; McNamara & Nulsen 2007). A large number of studies of cavities in cluster galaxies also provided useful information on the AGN feedback mechanism (Bîrzan et al. 2004, 2008; Dunn et al. 2005; Dunn & Fabian 2006, 2008; Nulsen et al. 2007; Cavagnolo et al. 2010; Dunn et al. 2010; Dong et al. 2010; O’Sullivan et al. 2011; Hlavacek-Larrondo et al. 2012; Pandge et al. 2012, 2013; Sonkamble et al. 2015).
Positive gradient in the azimuthally averaged radial temperature profiles and short cooling times in the central region are the characteristic features of the cool core clusters and have been confirmed through numerous studies employing high resolution Chandra and XMM-Newton observations (Fukazawa et al. 1994; Kaastra et al. 2004; Sanderson et al. 2006; Hlavacek-Larrondo et al. 2012). Temperature of the ICM has been estimated to be K whereas the particle number density was found to be in the range of cm-3 at core of the clusters to cm-3 in the outer regions (Markevitch & Vikhlinin 2007). The ICM mainly consists of highly ionized hydrogen and helium and traces of ionized heavier elements (about one third of the solar abundance) that gradually increase to the solar value at the centre of the cluster. The higher gas density at the centre of the cluster corresponds to shorter cooling time and large flow of cooling material known as “cooling flow” (Sarazin 1986; Fabian et al. 1984; Fabian 1994). However, large number of Chandra and XMM-Newton observations showed the presence of significantly less amount of cooled material against that expected from the standard cooling flow model (Böhringer et al. 2001; Tamura et al. 2001; Peterson et al. 2001, 2003; Peterson & Fabian 2006; McNamara & Nulsen 2007).
Radio sources associated with the central AGN release large amount of kinetic energy in the form of jets and lobes (Begelman et al. 1984; McNamara et al. 2000; Forman et al. 2005; Nulsen et al. 2005). If the jets/lobes are powerful enough to get coupled effectively with the surrounding ICM of the host galaxy, it will prevent the cooling of the ICM and hence the star formation (Dunn & Fabian, 2004; Rafferty et al., 2006; Cavagnolo et al., 2010). Thus, the AGN feedback mechanism plays an important role in regulating the star formation in the cores of such clusters. In such cases, it is believed that the radio emission from the AGN and star formation in the core of a cluster may be related with the ICM-specific entropy distribution (Donahue et al. 2006; Cavagnolo et al. 2008). Being the fundamental quantity of the ICM, entropy measurement provides important information regarding the cooling and heating processes that are involved in the cores of the cluster (Voit et al. 2002, 2005; Cavagnolo et al. 2008). It holds the record of accretion history and influence of non-gravitational effects on the ICM (Pratt et al. 2010). Cavagnolo et al. (2008) studied the intra-cluster entropy profiles for a sample of 222 galaxy clusters and showed that H and radio emission are prominent when the entropy “floor” in the core region is less then a 30 keV cm2.
Apart from AGN feedback, there are other possible sources of ICM heating as suggested by several authors, which include merger, conduction, supernovae, cosmic ray heating etc. It is understood that several clusters are being formed because of merging of smaller mass concentrations through gravitational infall of matter. During merger process large amount of energy is carried by the gas which is being dissipated in the form of shocks and turbulence (Markevitch & Vikhlinin 2007; Peterson & Fabian 2006). The energy dissipated through shock and turbulence enhances the temperature of the ICM. Due to availability of high resolution imaging instruments onboard Chandra and XMM-Newton observatories, it is possible to identify these merger features in the form of cold fronts, shock fronts, sloshing, etc. The cold fronts are seen in the ICM when the gas temperature outside the edge is much higher than the inside. These cold fronts are known to be formed because of the ram pressure acting on the core of one of the cluster moving into the other cluster at high velocity. For a detailed description on merging features in clusters e.g. cold fronts, shocks, sloshing etc. refer to Markevitch & Vikhlinin 2007 and references therein. The outer atmosphere (beyond cooling radius) of cluster represents the reservoir of huge amount of thermal energy. The conduction of heat from the outer hot ICM into the cooler central region also act as a source of heating (Voigt & Fabian 2004; Zakamska & Narayan 2003). Supernova (SN) explosions also act as a heating source and can cause delay in the formation of cooling flow (Domainko et al. 2004). Another mechanism of ICM heating is known to be due to the cosmic rays (Colafrancesco et al. 2004; Totani 2004). Relativistic electrons form a minihalo in the core of the cluster and produce hard X-ray photons due to inverse Compton scattering. These relativistic electrons and hard X-ray photons heat the gas in the ICM (Peterson & Fabian 2006).
ZwCl 2701 is a known relaxed galaxy cluster (Cuciti et al. 2015; Kale et al. 2015) positioned at RA = 09:52:49.20, DEC = +51:53:05.19 and located at a redshift of 0.214. The presence of X-ray cavities in this system have been reported by Rafferty et al. (2006) in a broad study of a sample of 31 groups and cluster galaxies. Diehl & Statler (2008) also carried out similar kind of study and estimated masses of black holes located in the center of the brightest galaxies in groups and clusters including ZwCl 2701. The measure of radio flux (or luminosity) and their correlation with AGN-power (cavity power) of the clusters (including ZwCl 2701) and group galaxies was done by Bîrzan et al. (2008). Though this object has been studied along with several other clusters, a systematic study with an emphasis on the comparison of the X-ray and radio properties was not available in the literature. This paper presents a systematic study of imaging and spectroscopic properties of ZwCl 2701 using deep Chandra X-ray data and 1.4 GHz GMRT observations. The thermodynamical parameters of the ICM selected from different regions of interest from ZwCl 2701 are presented in this paper. The cavity detection and their energy content along with balance between the cavity power () and the radiative loss of the X-ray emission due to its cooling within the cooling region () have also been examined in this paper. Similar balance has been reported in several other cooling flow clusters (for e.g., Bîrzan et al. 2004; Binney & Tabor 1995; Tucker & David 1997; Ciotti & Ostriker 2001; Soker et al. 2001; O’Sullivan et al. 2012; Hlavacek-Larrondo et al. 2012; Hlavacek-Larrondo et al. 2013; Miraghaei et al. 2014). With an objective to investigate signatures of the interactions between the radio jets/lobes and the surrounding ICM, we tried to find association between the X-ray cavities and the radio emission maps derived from the analysis of 1.4 GHz GMRT data.
The structure of this paper is as follows: Section 2 describes the Chandra and GMRT observations and their reduction strategies. In Section 3, we report the results obtained from the imaging analysis of X-ray emission and estimation of the thermodynamical parameters of the X-ray emitting gas from different regions of interest through X-ray spectroscopy. This section also presents the detection and estimation of the energetics associated with X-ray cavities in this cluster. Section 4 & 5 provides brief discussion on the results derived from this study and conclusions, respectively. Throughout this paper we assume the CDM cosmology with = 70 km s-1 Mpc-1, = 0.3, and = 0.7 at a redshift of = 0.214 for the system ZwCl 2701. This cosmology corresponds to a scale of 1″ = 3.5 kpc and the luminosity distance of the cluster 1022 Mpc.
2 Observations and data reduction
2.1 Chandra X-ray data
ZwCl 2701 was observed with Chandra on 03 February 2011 in imaging mode for 96 ks (ObsID 12903) and on 04 November 2001 for 27 ks (ObsID 3195) with the source focused on the back-illuminated ACIS-S3 chip. Level-1 X-ray data sets available in the public domain of Chandra X-ray Centre111 http://cda.harvard.edu/chaser/ have been used for the present study. The data sets were reprocessed following the standard data reduction routines as described in Chandra Interactive Analysis of Observations (CIAO-4.6)222http://cxc.harvard.edu/ciao/threads/index.html. Latest calibration files (CALDB V 4.6.2) were used in our data analysis. Bad pixels and other artefacts were identified and removed from the level 1 data sets by running the script chandrarepro. As ZwCl 2701 is positioned on chip S3, where the gas distribution of the cluster may cover the entire chip, the background light curve was extracted from the back-illuminated ACIS-S1 chip. The script lcsigmaclip within Sherpa was used for the removal of the segments of high background flaring events (with 3 clipping threshold). Light curve obtained from the dataset with ObsID 3195 showed a few flaring episodes with count rate exceeding the mean count rate during the observation. Removal of such flaring segments from the data reduced the effective exposure of the observation to 24.4 ks. However, there were no flares in the light curve obtained from the observation with ObsID 12903.
We used ACIS-S blank-sky observations provided by the CXC for sky background subtraction from the science data. CIAO task was used to identify the blank-sky data corresponding to ZwCl 2701 observations and the background count rates in 9 - 12 keV band were adjusted so as to match those in the source image (Markevitch 2002, David et al. 2009). As ZwCl 2701 observations were performed in Very Faint (VFAINT) telemetry format, VFAINT background screening was applied to the blank sky file after including events with “status=0”. Exposure maps and exposure corrected images of ZwCl 2701 in 0.3 - 3 keV energy band were created using standard CIAO fluximage script. Contaminating point sources across the field of view detected through the CIAO script wavdetect (Vagshette et al. 2013) were excluded from further analysis. The source spectra, background spectra, response and effective area files were created by using specextract task of CIAO. Spectral fitting was performed by using XSPEC-12.8.1 package.
2.2 GMRT radio data
ZwCl 2701 cluster was observed with the Giant Meterwave Radio Telescope (GMRT), Pune, India at frequency of 1.4 GHz (L-band) with 32-MHz band width divided in 512 channels (Project Code 26_064). The observations were carried out in two observing runs, on 7 September 2014 and 13 September 2014, for 4 hours duration in each run. The observations were performed using GMRT hardware back-end in upper and lower side bands (USB and LSB). The data were recorded in the LL and RR polarizations with an integration time per visibility of 16 sec during both the observations. The standard point like radio sources 3C 147 and 0834+555 were used as flux density and phase calibrator, respectively.
The data calibration and reduction was carried out using the NRAO Astronomical Image Processing System (AIPS) package (Version 31DEC2013). We followed the standard data reduction procedure of GMRT observations as described in Giacintucci et al. (2011); Giacintucci et al. (2014). The normal flagging was done by removing non-working antennae, bad baselines, channels and time ranges. Later careful editing was carried out to identify and remove those visibilities affected by the radio frequency interference (RFI). The visibilities were then calibrated for the bandpass response of the antennas using the flux calibrator 3C 147.The source and calibrator flux densities were set to the best VLA values suggested by Perley & Taylor (1999) extension to the Baars et al. (1977) scaled at 1.4 GHz using SETJY task of AIPS. Few noisy channels were seen at the end of each band, which were then discarded from the further analysis. Several cycles of self-calibration (using IMAGR and CALIB task) were performed in order to get the image. The residual phase variations from the data sets were also removed so as to obtain the good quality image of the source ZwCl 2701.
The measured values of noise on the USB and LSB were found to be 26.7 Jy/beam, which were corrected from GMRT primary beam response333http://www.ncra.tifr.res.in:8081/%7Engk/primarybeam/beam.html using PBCOR task of AIPS. The resultant flux image was obtained after combining the corrected USB and LSB data sets. The ZwCl 2701 cluster has been detected in the flux image at position of RA=09:52:49.14 and DEC=+51:53:06.2. The flux density of ZwCl 2701 cluster was derived by fitting the Gaussian model to the source using JMFIT task. The restoring beam image was obtained with the Briggs “robustness” parameter set to -3 (ROBUST = -3) in IMAGR task for uniform weighting. Final image of the cluster was obtained at the beam with FWHM 2.82″1.27″ resolution with position angle of 84. The 1 rms noise level of 26.7 Jy/beam was achieved at the center of the source in the final image.
3 Results
3.1 X-ray Imaging
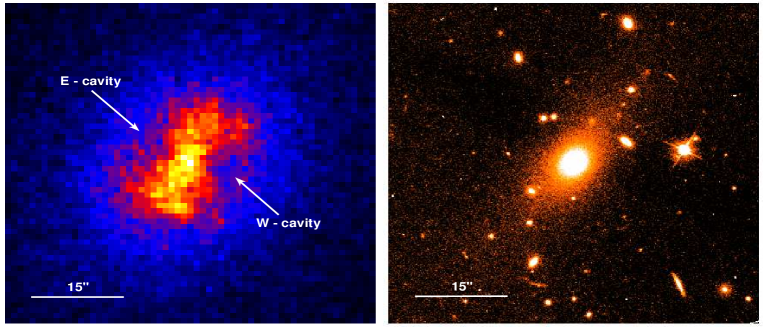
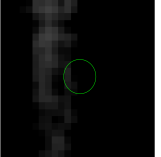
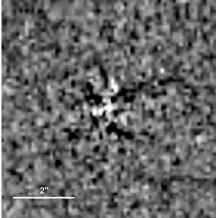
Background subtracted and exposure corrected 0.3 - 3 keV Chandra image of ZwCl 2701 is shown in Figure 1 (left panel) whereas the image in the right panel delineates HST 606 image of the cluster. To examine the presence of any offset between optical and X-ray centers of the cluster, we identified the optical and X-ray peaks in corresponding images and found that both the peaks are well aligned with a maximum offset of 0.5″. Both of these images are well aligned along the North-West and South-East directions. Several extended sources surrounding the central brightest object are clearly evident within 1′ 1′ field of the HST image of the cluster, while the X-ray emission from this cluster mapped using Chandra telescope appears as a single extended source covering about a few arcmin of the region centred on the core of ZwCl 2701. In addition to the extended emission, the hot gas distribution also provide evidences of depressions in the X-ray emission and are marked by arrows on the East and West directions of the X-ray peak of the cluster. To highlight these depressions in the X-ray image, we have used various techniques that are discussed below.
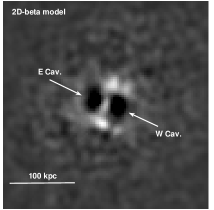
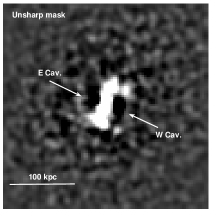
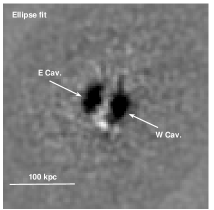
For the systematic investigation of X-ray cavities and other hidden features in the environment of ZwCl 2701, we have derived residual map after subtracting a smooth model from the original image (Dong et al. 2010), an unsharp mask image (David et al., 2009) and residual image generated by using IRAF ellipse fit task (Patil et al. 2007; Vagshette et al. 2012). The 2D smooth model was derived by fitting 2D- model to the isophotes in 0.3-3 keV Chandra image of the cluster. The 2D- model resulted into the best-fit parameters of slope , core radius , ellipticity and position angle . The smooth model was then subtracted from the original image and the resultant residual map is shown in left panel of Figure 2. The unsharp mask image was obtained by subtracting a 6 Gaussian smoothed 0.3-3 keV image from that smoothed with 1 Gaussian image in same energy band and shown in the middle panel of Figure 2. For smoothing the images, we used the task aconvolve within CIAO. Right panel of Figure 2 shows the residual image generated by using the IRAF ellipse task. The ellipse task fits the elliptical isophotes to galaxy image and gives the isophote intensity table file. Using this table file, a model image is being built and then subtracted from the original image. All these three images obtained from different techniques clearly reveal a pair of cavities or bubbles in the X-ray surface brightness distribution (darker shades) and appear to be surrounded by bright rim-like features. In addition to the pair of cavities, two bright knots (N-knot and S-knot) are also evident in these figures.
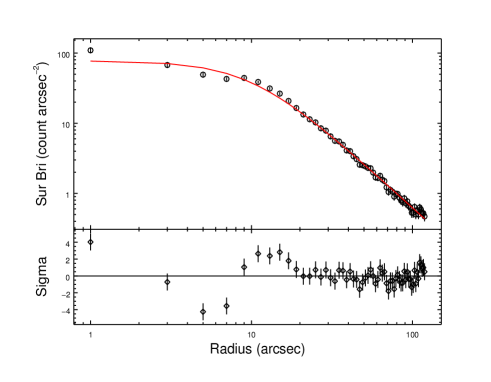
To investigate extent of the X-ray emission from this cluster, we have generated its surface brightness profile. This was done by extracting 0.3-3 keV X-ray photons from a series of concentric elliptical annuli, each of 2″ bin-width, centred on the X-ray peak of the cluster upto 2′ radius. The resulting background subtracted exposure corrected radial surface brightness profile is shown as solid line in Figure 3. Assuming that the ICM and the galaxies in the cluster are in hydrostatic equilibrium, we fit this surface brightness profile with a single model
|
|
(1) |
where , and represent the central brightness, the core radius and the slope, respectively. The fitted slop and core radius were found to be 0.51 and 9.75 (33.95 kpc), respectively.
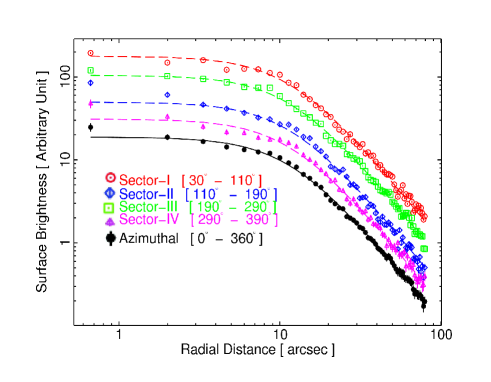
To elucidate these depressions, we derived similar radial surface brightness profiles for X-ray photons extracted from four different wedge shaped sectors covering Sector I ( - ), Sector II ( - ), Sector III ( - ) and Sector IV ( - ). The resultant radial surface brightness profiles for above four sectors are also shown in Figure 3. To better represent these profiles, arbitrary scales were applied on the surface brightness. To compare the distribution of estimated values of surface brightness profiles for each sector, the best fitted azimuthally averaged 1D- model with fixed slope and core radius was over plotted in the figure. The surface brightness plots showed that the gas distribution in ZwCl 2701 cluster is not symmetric in all directions but indicate the presence of marginal depressions in distribution along Sectors I & III. Apart from this, the profiles shows an excess emission at 8″- 20″ region and a highly complex nature above 20″ radii.
Despite the clear detection of cavities in the residual of 2D- model (Figure 2), depressions seen in the surface brightness profiles obtained from all the four sectors (left panel of Figure 3) are marginal. To investigate the presence of depressions, the surface brightness from both the cavity side regions were extracted and added together and then compared with that from the non-cavity side 1D-beta model. The best fitted 1D-beta model parameters are found to be core radius r0 = 10.03 arcsec and = 0.51. Combined surface brightness profile of cavity sides and the non-cavity side 1D-beta model are shown in the right top panel of Figure 3 whereas the deviation between them is shown in the right bottom panel. The presence of surface brightness depressions can be clearly seen in 3–7 arcsec radii from the core of the cluster and agrees with the residual images.
3.2 X-ray Spectral Analysis
To investigate thermodynamical properties of the ICM, we extracted 0.5-7 keV X-ray spectra from 24 concentric elliptical annuli, each of width 5 ″, centred on the X-ray peak of ZwCl 2701. Background spectrum was extracted from the blank sky background file. Response matrices and photon weighted effective area files were generated for each of the spectrum using the task specextract of CIAO. After appropriate background subtraction, each spectrum was fitted independently assuming the collisionally-ionized diffuse gas (ATOMDB code) subjected to the Galactic photoelectric absorption model (WABS APEC). The APEC code has three free parameters i.e. plasma temperature (in keV), metal abundance (in solar units) and the normalization component (cm-5). In spectral fitting, all the three parameters were allowed to vary while the value of the equivalent hydrogen column density in the source direction was kept fixed at the Galactic value (7.9 cm-2). Electron density of the gas was estimated from the APEC normalization which is directly related to the density through the relation
| (2) |
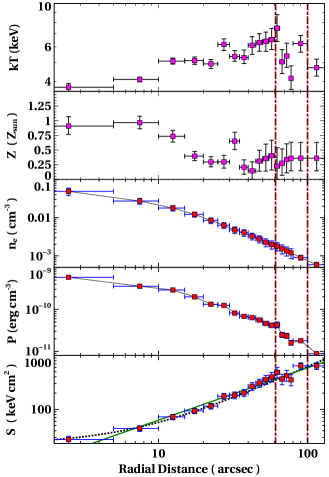
where, is the angular diameter distance to the source (cm), and are the electron and hydrogen densities (cm-3). Here, we assume for the solar abundance (for more details see Gitti et al. 2012). Once the values of temperature and density of the gas were found, the gas pressure P and entropy S were estimated by using relations P = ( being total density = 1.92 ) and . The error on density, pressure and entropy were calculated by using error propagation method described by Bevington & Robinson (2003).
The resulting radial profiles of temperature (kT), metallicity (), electron density (), pressure (P) and entropy (S) of the ICM from ZwCl 2701 are shown in top to bottom panels of Figure 4, respectively. Estimated temperature, electron number density and gas pressure at the core of the cluster were found to be 3.8 keV, 0.05 cm-3 and 0.35 keV cm-3, respectively. As ZwCl 2701 is a cool core cluster, the value of the estimated temperature from the core gradually increases up to a maximum of 7.25 keV at 60″ whereas the electron density and gas pressure profiles showed a monotonous decrease in the corresponding values. A small drop in the gas temperature and pressure profiles was evident in the region about 60″– 90″ from center of the cluster. However, the electron number density profile do not show any deviation. Similar nature of radial profiles of gas temperature, electron number density and pressure profiles were also reported for the system MS 0735.6+7421 (McNamara et al. 2005).
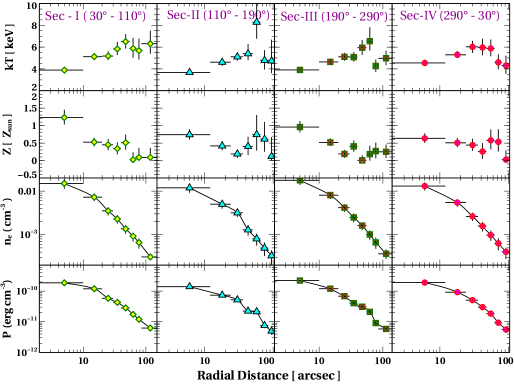
We have also obtained projected temperature, abundance, electron density and pressure profiles of the X-ray photons extracted from the same four sectors as discussed above and the resultant profiles are plotted from left to right panels in Figure 5. Except the temperature profiles along all the four sectors showed positive gradient as a function of radial distance from the core. A minor dip is evident in the temperature profiles along all the four sectors at 60″. However, the metal abundance profiles showed an overall negative gradient nature as expected in the cool core clusters. In general, all the profiles look similar to those expected for cool core clusters with the temperature dropping in the core almost by a factor of 2 relative to the peak temperature at 100″. The metallicity profiles along sector II and IV are on-jet profiles whereas sector I and III are off-jet. The profiles along the on-jet side show rise in metallicity at larger radii (60″- 80″). Our results on metallicity profiles of ZwCl 2701 along the on-jet side coroborates the results obtained for other clusters such as 2A 0335, Hydra A and A 2052 (Kirkpatrick & McNamara 2015). The elemental abundance present in BCGs is uplifted due to the rising cavities (bubbles) from central twenty kiloparsec to an altitude of several hundred kiloparsec. This causes higher metallicity at larger radii.
To examine the global properties of the hot gas within ZwCl 2701, source spectrum in 0.3-7 keV range was extracted from a circular region of 2′ centred on the X-ray peak. The spectrum was then fitted with a simple collisionally ionized plasma model with the photo-electric absorption fixed at the Galactic value. The best-fit parameters of the spectrum are listed in Table 1.
| Reg. | kT (keV)/ | Z (Z⊙) | L0.3-10keV (1042 erg s-1) | counts | ||
|---|---|---|---|---|---|---|
| 2’( 420 kpc) | 5.14 0.12 | 0.36 0.04 | 678 04 | 68661 | – | 359.00354 |
| Clumpy | 4.11 0.16 | 0.54 0.07 | 165 2.00 | 16183 | – | 209.09216 |
| E Cav. | 3.47 0.50 | 0.70 0.40 | 6.99 0.04 | 707 | 57.5356 | – |
| W Cav. | 5.36 0.90 | 0.94 0.50 | 10.1 0.03 | 875 | 63.0867 | – |
| S Knot | 4.01 0.52 | 0.74 0.36 | 10.1 0.02 | 965 | 75.3176 | – |
| N Knot | 4.10 0.58 | 0.66 0.35 | 9.95 0.22 | 951 | 60.4871 | – |
| Nucli | 3.52 0.61 | 0.32 0.30 | 3.66 0.30 | 354 | 26.7029 | – |
| 1.97 0.11 | – | – | 354 | 29.9230 | – |
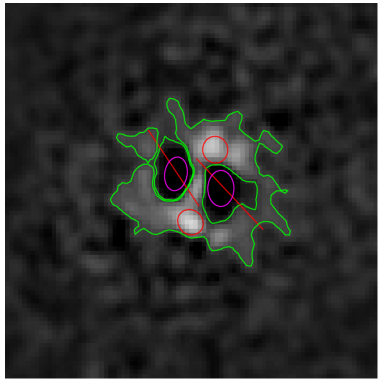
We have also performed spectroscopy by extracting source spectrum from the regions of interest separately. Several interesting features such as cavities, clumpy regions, knots and nucleus were seen in the residual image of ZwCl 2701 (Figure 6). The X-ray deficient cavity regions are shown by dark shades while the knots (excess emission) appeared as the bright regions in the figure and are highlighted with magenta ellipses and red circles, respectively. As the shape of each of the feature was irregular, it was difficult to extract source spectrum for each of the features accurately. To study these feature independently, we have extracted source spectra from these regions separately. The spectrum for the clumpy region was obtained by extracting X-ray photons from the regions shown by green contours and excluding cavity regions (Figure 6). Spectra extracted from these regions of interest were then fitted using APEC model within XSPEC. The results from the best-fit spectra of clumpy, cavity regions and the knots are presented in Table 1.
To investigate nature of the nuclear source associated with this cluster, we extracted a 0.3 - 8 keV spectrum from within the central 1.5″ region centred on RA=9:52:49.198, DEC=+51:53:05.19. The central source appears to be embedded within the diffuse gas, which may contaminate the hard spectral component. We fitted this spectrum with a simple power law and a single temperature APEC model independently, with the Galactic absorption () fixed. The best fit power-law component yielded the photon index whereas the single temperature model yielded gas temperature kT = and metal abundance (Table 1). X-ray luminosity of the nuclear source was found to be 2.27 erg s-1 .
3.3 Temperature and abundance maps
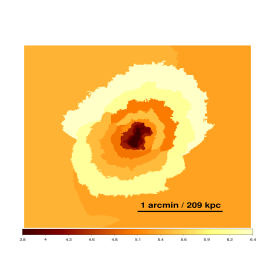
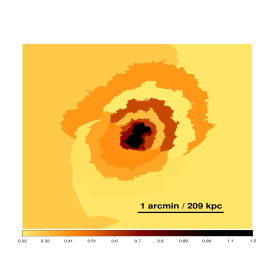
The superb spatial resolution capability of Chandra was used to investigate the temperature and metallicity distribution across the cluster ZwCl 2701. Therefore, we used the central 160″160″ (558 558 kpc) image to construct the temperature and abundance maps of the ICM within ZwCl 2701. Contour binning algorithm of Sanders (2006) was used for generating these maps. This algorithm generates contours on an adaptively smoothed map and bins the X-ray data according to the surface brightness distribution in such a way that each of the selected region has at least 3600 counts (S/N 60). The spectra and appropriate response files were generated for each of the contour. As discussed earlier, the blank sky files were used for the background estimation. Each of the contour spectrum was grouped in such a way that it contained at least 25 counts per bin. The extracted spectra were then fitted with a simple APEC model with the fixed Galactic absorption and varying temperature, abundance and normalization parameters. The resulting temperature and metallicity maps of the contour binning are shown in Figure 7.
Temperature map (left panel of Figure 7) showed that the gas in the core of ZwCl 2701 cluster is coolest (3.8 keV) whereas maximum temperature of 6.4 keV was detected along the North direction at about 60″. From the metallicity map (right panel of Figure 7), it is apparent that the highest metallicity (1.2 ) is seen in the central region of the cluster which then decreases up to 0.22 in the outward direction. Thus, the gradual rise in temperature and fall in metallicity (Figure 5) are confirmed in the temperature and metallicity maps. The lower temperature and higher metallicity at the core relative to the outer region – typical characteristics of the cool core clusters, have been noticed in ZwCl 2701.
3.4 Radio and X-ray imaging
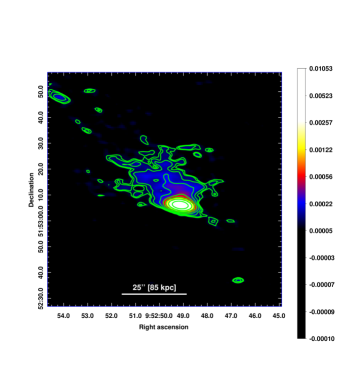
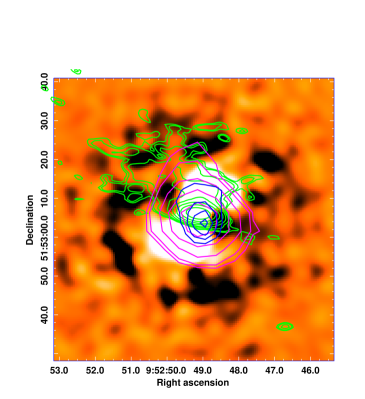
Multi-frequency radio observations are proxy to understand the AGN feedback activities in the cores of galaxy clusters (Bîrzan et al., 2008). Radio jets originating from the AGN are believed to inflate bubbles in the ICM. Radio observations of the cool core clusters have demonstrated that the radio emission from the lobes fills the X-ray cavities and hence confirm their ubiquitous nature (Bîrzan et al., 2004; Rafferty et al., 2006; Cavagnolo et al., 2010). Therefore, it is important to find a link between them by investigating their association in ZwCl 2701. With these objectives, we have observed ZwCl 2701 at 1.4 GHz with the GMRT, Pune. 1.4 GHz radio image with 2″.82 1″.27 resolution (shown in Figure 8 left panel) delineates the extended morphology of the radio emission that is elongated along the North-East and South-West direction. This confirms the center of the radio source in ZwCl 2701 coinciding with the X-ray peak and also with the brightest central galaxy. To compare the X-ray and radio emission features, we used the X-ray unsharp image of ZwCl 2701 cluster and overlay 1.4 GHz radio emission contours. The resultant image is shown in the right panel of Figure 8. The extended nature of the radio emission appears to trace both the X-ray cavities. The maximum distance of the radio jet from the radio peak is evident along the North-East direction and is 59″ (206 kpc). Further, elongation of the radio emission along the North-East direction exhibits its resemblance with the higher temperature gas seen in the temperature map (Figure 7).
Total flux density and flux density of core of ZwCl 2701 at 1.4 GHz frequency were estimated to be 119 mJy with rms = 0.03 mJy and 11.30 mJy with rms of 0.04 mJy, respectively. Bîrzan et al. (2008) using VLA multi-frequency radio data (except at 1.4 GHz) estimated the integrated radio luminosity of ZwCl 2701 to be erg s-1 , where they assume a power-law nature , being the spectral index . Our estimate of total radio luminosity of this source at 1.4 GHz using GMRT observations is found to be erg s-1 .
4 Discussion
4.1 AGN Feedback
To estimate the total amount of energy (enthalpy) injected by the radio jets in to the ICM, we measured energy content of each of the cavity and the work done by them on their surrounding following (Bîrzan et al. 2004; Rafferty et al. 2006)
| (3) |
where p and V are the surrounding gas pressure and volume of each of the cavity, respectively. X-ray cavities in the 2D-beta model subtracted residual image appeared as well-defined prolate ellipsoidal systems. Therefore, volume of the cavities were estimated by measuring their locations and sizes in the residual map as V=, where is the semi-major axis and is semi-minor axis. Though we adopted ellipse fitting method to show the presence of X-ray cavities in this cluster, it was important to determine the cavity size appropriately. We followed visual inspection method to determine the position and size of the cavity as used by Bîrzan et al. (2004) for several clusters. Apart from the visual inspection, the sectorial radial profiles of ZwCl 2701 (right panels of Figure 3) provide a hint to determined the semi-minor axis of the cavity. The semi-major axis of the cavity, however, can be estimated by extracting the counts from annular region around the depression. The uncertainty involved in determining the size of cavities by above method contributed towards the estimation of cavity enthalpy. Here, we assume that both the cavities are filled with relativistic plasma of = 4/3 so that the total enthalpy release to be . The gas pressure of the cavities in the surrounding region ( where =1.92) was obtained from the temperature and density profiles of the plasma. Once we have pressure and volume of the cavity, its enthalpy content can be derived, though it is difficult to estimate the error associated with it. This is because measuring size (or volume) of the cavity itself has certain uncertainty. The error measurement on the enthalpy reported in Table 2 is only due to the pressure. The estimates of projected centroids, major and minor axes, cavity volume, density, temperature and enthalpy are reported in Table 2.
The total power injected by the radio jets into the surrounding medium was estimated by dividing the total enthalpy content of the cavities () by their ages. The cavity power was derived by assuming all the three methods discussed by Bîrzan et al. (2004) which are, the time taken by the cavities to rise to the present position from the core at the sound crossing time (); the time required for the cavities to rise buoyantly at their terminal velocities (); and the time required to refill the displaced volume of gas as bubble rise in upward direction (). The cavity ages estimated by all the three methods are listed in Table 2 and lies in the range between 2.03 - 9.42 107 yr (see Pandge et al. 2013 for more detail). The total jet power required to create a cavity pair is simply Pjet = Ecav/tage, where Ecav is the total cavity pair enthalpy and tage is the age of the cavity. For convenience, we assumed buoyancy age estimation method for the estimation of age of the cavities. While age estimated using sound crossing time and refill time are the upper and lower limit to the age of the cavity, respectively (Bîrzan et al. 2004). The total jet power is calculated to be Pjet = 2.27 erg s-1 with upper and lower limits of 4.57 erg s-1 and erg s-1, respectively.
The presence of X-ray cavities in Zwcl 2701 cluster has been earlier reported by Rafferty et al. (2006) in a broad study of a sample of 31 groups and cluster galaxies. In that study, Chandra archival data of significantly less exposure (27 ks) were used, while the present study reports analysis of Chandra 123 ks exposure data. As mentioned in previous paragraph, the accuracy in the measurement of cavity size depends on the signal-to-noise ratio (exposure time) of the data. Considering this point, our estimation of cavity size that leads to the calculation of enthalpy, jet power are more reliable. Apart from these estimation from Chandra X-ray data, we also used GMRT 1.4 GHz radio observations of the cluster to investigate the cavity position. Therefore, our estimation of cavity size and thermodynamical parameters are relatively more accurate compared to those reported earlier.
| Parameters | E cavity | W cavity |
|---|---|---|
| (kpc) | 12.25 | 14.0 |
| (kpc) | 8.75 | 10.5 |
| (kpc) | 18.9 | 19.25 |
| Vol ( cm3) | 2.67 | 3.73 |
| kT (keV) | 4.23 | 4.79 |
| ( cm-3) | 9.62 | 9.01 |
| ( erg cm-3) | 1.25 | 1.34 |
| E ( erg) | 1.14 | 1.99 |
| (km s-1) | 945 | 1175 |
| (km s-1) | 513 | 554 |
| ( yr) | 2.46 | 2.03 |
| ( yr) | 4.52 | 4.30 |
| ( yr) | 8.59 | 9.42 |
4.2 Central engine in ZwCl 2701
As the central engine is responsible for the formation of X-ray cavities and other substructures evident in the cluster ZwCl 2701, it is important to probe properties of the central engine. In this regard, estimation of the black hole mass in the central dominant galaxy of the cluster is one of the most important aspect (Hlavacek-Larrondo et al. 2013) and can be estimated by using the well established relation between the black hole mass and the central stellar dispersion velocity (Tremaine et al. 2002). For ZwCl 2701, the stellar dispersion velocity was estimated by using the SDSS spectrum and was found to be 283 km s-1. The relation lead to the central black hole mass of and is consistent with reported by Rafferty et al. (2006) using the K-band luminosity. It is understood that the accreted mass on to the SMBHs is responsible for the AGN outburst, creating X-ray deficiency regions or cavities. We estimated mass accretion rate on to the SMBH in central dominant galaxy of ZwCl 2701 by using the relation suggested by Rafferty et al. (2006) and found to be yr-1.
In the case of a fully ionized gas, the Eddington accretion rate is a function of the black hole mass and radiative efficiency and is given by , where, is the Eddington luminosity. Here we assume = 0.1 for the present calculation though its upper limit for the radiative efficiency is 0.06 for a non-rotating black hole (Frank et al., 2002) and that for an extreme Kerr black hole, it is 0.4 (Rafferty et al. 2006). For a black hole mass of 5.44 as in the case of ZwCl 2701, the Eddington luminosity is erg s-1 = erg s-1 . This lead to yr-1. The ratio of is below the threshold limit of 0.01 required for the accretion flow to be radiatively inefficient (Narayan & Yi 1994). This suggests that the launching of powerful jets from the SMBH in ZwCl 2701 is efficient when the accretion flow in the vicinity of the black hole has large scale height (O’Sullivan et al. 2012).
We also calculated the Bondi accretion rate of the SMBH defined as a function of the ambient gas density and the black hole mass (Bondi 1952). We estimated the gas density by analysing the X-ray spectrum extracted from the central 1.5″ region and was found to be cm-3. The Bondi accretion process occurs within Bondi radius of under the influence of black hole, where is the sound speed in the surrounding medium and is the black hole mass. However, the size of the region selected for the spectral extraction was not sufficiently small to resolve the Bondi radius. Therefore, the true temperature and density within the Bondi radius could be marginally different. This leads to the underestimation of the Bondi accretion rate which was estimated by using the relation . For the given ambient density and Bondi radius (3.23 pc), the Bondi accretion rate was found to be yr-1 and provides a lower limit for a given back hole mass. Ratio of the required accretion rate () to the Bondi rate suggest that the accretion rate required for carving X-ray cavities in this cluster is much higher, at least by a factor of one thousand than the Bondi rate.
4.3 Cooling versus Heating of the ICM
In the absence of central heating, the ICM is supposed to radiatively cool and get deposited at the core of the cluster. The time required for cooling of the gas by radiating its enthalpy can be obtained by using the relation (Cavagnolo et al., 2009)
| (4) |
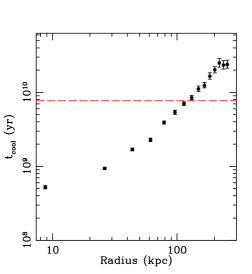
where, and are the electron and hydrogen densities, respectively, while represents the cooling function. We assume total number density for the fully ionized plasma. Values of the and for ICM in ZwCl 2701 were derived by analyzing azimuthally averaged projected spectra from concentric annuli, as discussed earlier. The resultant cooling time profile of the ICM in ZwCl 2701 is shown in Figure 9 with the cooling time of the core of the cluster (within 5″) equal to yr. The horizontal dashed line represents the “cooling radius” which is defined as the radius within which the gas has a cooling time less than 7.7 109 yr (Bîrzan et al. 2004), also called the cosmological time. Following McDonald et al. (2012), we estimate the cooling rate , being the 2-10 keV X-ray luminosity within cooling radius, the molecular weight and the gas temperature, to be 196 yr-1 within the cooling radius of = 105 kpc (30″).
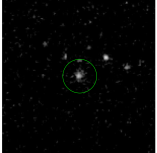
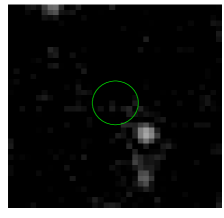
Existence of the cool molecular gas in the core of the cluster was investigated by employing the infrared (IR) observations of the ZwCl 2701. For this, we used Spitzer archival IR and mid/far-infrared (MIR/FIR) data. Spitzer IRAC 8 image (top left panel of Figure 10) showed the presence of a bright point source within the radius of 4″, however, failed to exhibit the signature of the extended features. On the other hand, no emission was evident in the MIR 24 and FIR 70 images (top right and bottom left panel of Figure 10). This confirms the marginal or no detection of the molecular gas in the core of ZwCl 2701. Further, residual image obtained after subtracting a smooth elliptical model of the HST 606 optical image (Patil et al., 2007; Vagshette et al., 2012) could not substantiate the expected signatures of dust features (bottom right panel of Figure 10). Marginal detection of dust and undetectable or very weak MIR/FIR emission from the core of this cluster indicate a very low rate of star formation. We made an attempt to quantify the star formation by using optical spectroscopic observations available in the archive of Sloan Digital Sky Survey (SDSS)444http://cas.sdss.org/dr7/en/tools/explore/obj.asp. The deblended emission line flux ( erg cm-2 s-1) yielded the star formation rate (SFR) of 0.60 yr-1 (Kennicutt 1998) which is very low compared to the expected one (196 yr-1) and hence confirms the cooling-flow problem in this cluster. A correlation between the BCG colour and separation between the BCG center and X-ray peak is being discussed on the context of SFR (see Figure 11 of Rafferty et al. 2008). However, similar kind of investigation can not be done in the case of ZwCl 2701 due to the lack of UV data.
Evidence regarding the intermittent heating and offsetting of cooling in the core of the cluster was confirmed by the observed floor in the “entropy profile” of the ICM (Lloyd-Davies et al. 2000). The entropy profile of the ICM in the environment of ZwCl 2701 was derived by performing spectral analysis of X-ray emission and using the thermodynamical parameters as derived above. The resultant entropy profile of the ICM is shown in Figure 4 (bottom panel). We tried to fit this profile by employing two different models, (i) a simple power law () and (ii) a power law plus a constant term i.e., (Cavagnolo et al. 2009) where represents the excess entropy value above the best fitted power law at larger radii and is known as the entropy floor. Power law plus a constant model resulted in the best fit (solid line in bottom panel of Figure 4) of the entropy profile with the parameters keV cm2, and keV cm2, and are consistent with those obtained by Cavagnolo et al. (2009) for a larger sample of cool core clusters. Similar results were also reported by Sonkamble et al. (2015) for Abell 2390. The excess entropy keV cm2 in the core of this cluster confirms that some intermittent heating is operative in the core of ZwCl 2701.
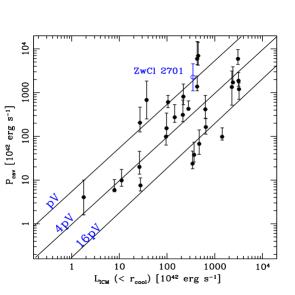
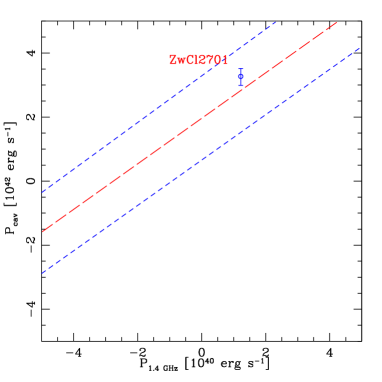
The observed X-ray cavities, the floor in the entropy profile and the diffuse radio emission tracing the regions of X-ray cavities point towards the ongoing mechanical-mode feedback in the core of this cluster. To confirm whether the AGN feedback is powerful enough to quench cooling of the ICM in this cluster, we compare the cavity power () with the total radiative luminosity within the cooling radius () as suggested by Rafferty et al. (2006) and is shown in Figure 11 (left panel). Filled circles represent the data points from the sample of Rafferty et al. (2006). Position of the ZwCl 2701 is shown by the open triangle and occupies a position little above the 4 line. Solid diagonal lines in this plot represent the equivalence between the two ( = ) at , 4 and 16 of the total enthalpy. For the case of ZwCl 2701, we estimated the cooling luminosity erg s-1 , while the total cavity power erg s-1 , which means AGN feedback from the core offsets the cooling. Further confirmation of the balance between the two was provided by the comparison between the 1.4 GHz radio luminosity and the cavity power. For this, we plot the measured value of GMRT 1.4 GHz total radio power of the source associated with ZwCl 2701 ( 2.20 1041 erg s-1 ) against the mechanical power of the X-ray cavities and is shown in Figure 11(right panel). The long dashed line in this figure represents the best fit relation of Cavagnolo et al. (2010) for a sample of giant ellipticals (gEs) with the upper and lower limits shown by the short dashed lines. In this plot, ZwCl 2701 occupies position close to the best-fit line obtained by Cavagnolo et al. (2010), suggesting that the radio source hosted by this system is powerful enough to meet the balance. The ratio between the two is , and is comparable to the measurements of cool core clusters (Gitti et al. 2014; Bîrzan et al. 2008).
5 Conclusions
In this paper we presented a detailed multi-wavelength study of the cool core cluster ZwCl 2701. The study is based on the analysis of 123 ks Chandra and 8 hrs GMRT, archival optical (HST) and IR (Spitzer) data sets. The primary findings from this study are summarized as:
-
1.
The morphological analysis of Chandra image confirmed the presence of surface brightness depressions (cavities) in the central region of the cluster ZwCl 2701.
-
2.
1.4 GHz radio map derived from the GMRT data detected large scale radio emission that filled the X-ray cavities in the central region of the cluster.
-
3.
Comparison of the average cavity power ( erg s-1 ) with the X-ray luminosity of the gas within the cooling radius (105 kpc) erg s-1 suggested that the mechanical power of the AGN outburst is large enough to balance the radiative loss in the system.
-
4.
Ratio of the 1.4 GHz radio luminosity and the total power contained within the cavities is found to be which is comparable to that of other cluster galaxies.
-
5.
The back hole accretion rate in the brightest galaxy in ZwCl 2701 cluster was estimated to be 0.11 yr-1 which is well below the Eddington limit (12 yr-1) but above the Bondi accretion rate yr-1.
Acknowledgements
We sincerely thank the referee for his/her valuable comments and suggestions which improved the paper. The authors thank C. H. Ishwara-Chandra, Ruta Kale and Dharam V. Lal of NCRA, TIFR, India for their help in GMRT data analysis and inputs on the manuscript. MKP and SSS acknowledge the use of computing and library facilities of IUCAA, Pune, India and use of the High performance computing facility procured under the DST, New Delhi’s FIST scheme (F No. SR/FST/PS-145/2009). This work has made use of data from the Giant Metrewave Radio Telescope (GMRT), Chandra data archive, SDSS (Sloan Digital Sky Survey), archival data obtained with the Spitzer Space Telescope, archival data from HST, Extragalactic Database (NED) and and software provided by the Chandra X-ray Centre (CXC). SSS acknowledges financial support from the Ministry of Minority Affairs, Govt. of India, under the Minority Fellowship Program (Award No. F-17.1/2010/MANF-BUD-MAH-2111/SA-III/Website).
References
- Baars et al. (1977) Baars J. W. M., Genzel R., Pauliny-Toth I. I. K., Witzel A., 1977, A&A, 61, 99
- Begelman et al. (1984) Begelman M. C., Blandford R. D., Rees M. J., 1984, Reviews of Modern Physics, 56, 255
- Best et al. (2007) Best P. N., von der Linden A., Kauffmann G., Heckman T. M., Kaiser C. R., 2007, MNRAS, 379, 894
- Bevington & Robinson (2003) Bevington P. R., Robinson D. K., 2003, Data reduction and error analysis for the physical sciences
- Binney & Tabor (1995) Binney J., Tabor G., 1995, MNRAS, 276, 663
- Bîrzan et al. (2008) Bîrzan L., McNamara B. R., Nulsen P. E. J., Carilli C. L., Wise M. W., 2008, ApJ, 686, 859
- Bîrzan et al. (2004) Bîrzan L., Rafferty D. A., McNamara B. R., Wise M. W., Nulsen P. E. J., 2004, ApJ, 607, 800
- Böhringer et al. (2001) Böhringer H., Belsole E., Kennea J., Matsushita K., Molendi S., Worrall D. M., Mushotzky R. F., Ehle M., Guainazzi M., Sakelliou I., Stewart G., Vestrand W. T., Dos Santos S., 2001, A&A, 365, L181
- Bondi (1952) Bondi H., 1952, MNRAS, 112, 195
- Burns (1990) Burns J. O., 1990, AJ, 99, 14
- Cavagnolo et al. (2008) Cavagnolo K. W., Donahue M., Voit G. M., Sun M., 2008, ApJ, 683, L107
- Cavagnolo et al. (2009) Cavagnolo K. W., Donahue M., Voit G. M., Sun M., 2009, ApJS, 182, 12
- Cavagnolo et al. (2010) Cavagnolo K. W., McNamara B. R., Nulsen P. E. J., Carilli C. L., Jones C., Bîrzan L., 2010, ApJ, 720, 1066
- Ciotti & Ostriker (2001) Ciotti L., Ostriker J. P., 2001, ApJ, 551, 131
- Colafrancesco et al. (2004) Colafrancesco S., Dar A., De Rújula A., 2004, A&A, 413, 441
- Cuciti et al. (2015) Cuciti V., Cassano R., Brunetti G., Dallacasa D., Kale R., Ettori S., Venturi T., 2015, A&A, 580, A97
- David et al. (2009) David L. P., Jones C., Forman W., Nulsen P., Vrtilek J., O’Sullivan E., Giacintucci S., Raychaudhury S., 2009, ApJ, 705, 624
- Diehl & Statler (2008) Diehl S., Statler T. S., 2008, ApJ, 687, 986
- Domainko et al. (2004) Domainko W., Gitti M., Schindler S., Kapferer W., 2004, A&A, 425, L21
- Donahue et al. (2006) Donahue M., Horner D. J., Cavagnolo K. W., Voit G. M., 2006, ApJ, 643, 730
- Dong et al. (2010) Dong R., Rasmussen J., Mulchaey J. S., 2010, ApJ, 712, 883
- Dunn et al. (2010) Dunn R. J. H., Allen S. W., Taylor G. B., Shurkin K. F., Gentile G., Fabian A. C., Reynolds C. S., 2010, MNRAS, 404, 180
- Dunn & Fabian (2004) Dunn R. J. H., Fabian A. C., 2004, MNRAS, 355, 862
- Dunn & Fabian (2006) Dunn R. J. H., Fabian A. C., 2006, MNRAS, 373, 959
- Dunn & Fabian (2008) Dunn R. J. H., Fabian A. C., 2008, MNRAS, 385, 757
- Dunn et al. (2005) Dunn R. J. H., Fabian A. C., Taylor G. B., 2005, MNRAS, 364, 1343
- Fabian (1994) Fabian A. C., 1994, ARA&A, 32, 277
- Fabian et al. (1984) Fabian A. C., Nulsen P. E. J., Canizares C. R., 1984, Nature, 310, 733
- Fabian et al. (2003) Fabian A. C., Sanders J. S., Allen S. W., Crawford C. S., Iwasawa K., Johnstone R. M., Schmidt R. W., Taylor G. B., 2003, MNRAS, 344, L43
- Fabian et al. (2006) Fabian A. C., Sanders J. S., Taylor G. B., Allen S. W., Crawford C. S., Johnstone R. M., Iwasawa K., 2006, MNRAS, 366, 417
- Forman et al. (2007) Forman W., Jones C., Churazov E., Markevitch M., Nulsen P., Vikhlinin A., Begelman M., Böhringer H., Eilek J., Heinz S., Kraft R., Owen F., Pahre M., 2007, ApJ, 665, 1057
- Forman et al. (2005) Forman W., Nulsen P., Heinz S., Owen F., Eilek J., Vikhlinin A., Markevitch M., Kraft R., Churazov E., Jones C., 2005, ApJ, 635, 894
- Frank et al. (2002) Frank J., King A., Raine D. J., 2002, Accretion Power in Astrophysics: Third Edition
- Fukazawa et al. (1994) Fukazawa Y., Ohashi T., Fabian A. C., Canizares C. R., Ikebe Y., Makishima K., Mushotzky R. F., Yamashita K., 1994, PASJ, 46, L55
- Giacintucci et al. (2014) Giacintucci S., Markevitch M., Brunetti G., ZuHone J. A., Venturi T., Mazzotta P., Bourdin H., 2014, ApJ, 795, 73
- Giacintucci et al. (2011) Giacintucci S., O’Sullivan E., Vrtilek J., David L. P., Raychaudhury S., Venturi T., Athreya R. M., Clarke T. E., Murgia M., Mazzotta P., Gitti M., Ponman T., Ishwara-Chandra C. H., Jones C., Forman W. R., 2011, ApJ, 732, 95
- Gitti et al. (2012) Gitti M., Brighenti F., McNamara B. R., 2012, Advances in Astronomy, 2012, 6
- Gitti et al. (2014) Gitti M., Tozzi P., Brunetti G., Cassano R., Dallacasa D., Edge A., Ettori S., Feretti L., Ferrari C., Giacintucci S., Giovannini G., Hogan M., Venturi T., 2014, ArXiv e-prints
- Gitti et al. (2015) Gitti M., Tozzi P., Brunetti G., Cassano R., Dallacasa D., Edge A., Ettori S., Feretti L., Ferrari C., Giacintucci S., Giovannini G., Hogan M., Venturi T., 2015, Advancing Astrophysics with the Square Kilometre Array (AASKA14), p. 76
- Hlavacek-Larrondo et al. (2013) Hlavacek-Larrondo J., Allen S. W., Taylor G. B., Fabian A. C., Canning R. E. A., Werner N., Sanders J. S., Grimes C. K., Ehlert S., von der Linden A., 2013, ApJ, 777, 163
- Hlavacek-Larrondo et al. (2013) Hlavacek-Larrondo J., Fabian A. C., Edge A. C., Ebeling H., Allen S. W., Sanders J. S., Taylor G. B., 2013, MNRAS, 431, 1638
- Hlavacek-Larrondo et al. (2012) Hlavacek-Larrondo J., Fabian A. C., Edge A. C., Ebeling H., Sanders J. S., Hogan M. T., Taylor G. B., 2012, MNRAS, 421, 1360
- Kaastra et al. (2004) Kaastra J. S., Tamura T., Peterson J. R., Bleeker J. A. M., Ferrigno C., Kahn S. M., Paerels F. B. S., Piffaretti R., Branduardi-Raymont G., Böhringer H., 2004, A&A, 413, 415
- Kale et al. (2015) Kale R., Venturi T., Cassano R., Giacintucci S., Bardelli S., Dallacasa D., Zucca E., 2015, A&A, 581, A23
- Kennicutt (1998) Kennicutt Jr. R. C., 1998, ARA&A, 36, 189
- Kirkpatrick & McNamara (2015) Kirkpatrick C. C., McNamara B. R., 2015, MNRAS, 452, 4361
- Lloyd-Davies et al. (2000) Lloyd-Davies E. J., Ponman T. J., Cannon D. B., 2000, MNRAS, 315, 689
- Markevitch (2002) Markevitch M., 2002, ArXiv Astrophysics e-prints
- Markevitch & Vikhlinin (2007) Markevitch M., Vikhlinin A., 2007, Phys. Rep., 443, 1
- McDonald et al. (2012) McDonald M., Bayliss M., Benson B. A., Foley R. J., Ruel J., Sullivan P., Veilleux S., Aird K. A., Ashby M. L. N., Bautz M., Bazin G., Bleem L. E., Brodwin M., Carlstrom J. E., Chang C. L., Cho H. M., Clocchiatti A., et. al. 2012, Nature, 488, 349
- McNamara & Nulsen (2007) McNamara B. R., Nulsen P. E. J., 2007, ARA&A, 45, 117
- McNamara et al. (2005) McNamara B. R., Nulsen P. E. J., Wise M. W., Rafferty D. A., Carilli C., Sarazin C. L., Blanton E. L., 2005, Nature, 433, 45
- McNamara et al. (2000) McNamara B. R., Wise M., Nulsen P. E. J., David L. P., Sarazin C. L., Bautz M., Markevitch M., Vikhlinin A., Forman W. R., Jones C., Harris D. E., 2000, ApJ, 534, L135
- Miraghaei et al. (2014) Miraghaei H., Khosroshahi H. G., Klöckner H.-R., Ponman T. J., Jetha N. N., Raychaudhury S., 2014, MNRAS, 444, 651
- Mittal et al. (2009) Mittal R., Hudson D. S., Reiprich T. H., Clarke T., 2009, A&A, 501, 835
- Narayan & Yi (1994) Narayan R., Yi I., 1994, ApJ, 428, L13
- Nulsen et al. (2007) Nulsen P., McNamara B. R., David L. P., Wise M. W., Leahy J. P., 2007, in American Astronomical Society Meeting Abstracts #210 Vol. 39 of Bulletin of the American Astronomical Society, The AGN Outburst In Hercules A: Jet, Shocks And Cavities. p. 148
- Nulsen et al. (2005) Nulsen P. E. J., Hambrick D. C., McNamara B. R., Rafferty D., Birzan L., Wise M. W., David L. P., 2005, ApJ, 625, L9
- Nulsen et al. (2005) Nulsen P. E. J., McNamara B. R., Wise M. W., David L. P., 2005, ApJ, 628, 629
- O’Sullivan et al. (2012) O’Sullivan E., Giacintucci S., Babul A., Raychaudhury S., Venturi T., Bildfell C., Mahdavi A., Oonk J. B. R., Murray N., Hoekstra H., Donahue M., 2012, MNRAS, 424, 2971
- O’Sullivan et al. (2011) O’Sullivan E., Giacintucci S., David L. P., Gitti M., Vrtilek J. M., Raychaudhury S., Ponman T. J., 2011, ApJ, 735, 11
- O’Sullivan et al. (2011) O’Sullivan E., Worrall D. M., Birkinshaw M., Trinchieri G., Wolter A., Zezas A., Giacintucci S., 2011, MNRAS, 416, 2916
- Pandge et al. (2012) Pandge M. B., Vagshette N. D., David L. P., Patil M. K., 2012, MNRAS, 421, 808
- Pandge et al. (2013) Pandge M. B., Vagshette N. D., Sonkamble S. S., Patil M. K., 2013, Ap&SS, 345, 183
- Patil et al. (2007) Patil M. K., Pandey S. K., Sahu D. K., Kembhavi A., 2007, A&A, 461, 103
- Perley & Taylor (1999) Perley R. T., Taylor G. B., , 1999, VLA Calibrator Manual, Tech. rep., NRAO (http://www.vla.nrao.edu/astro/calib/manual/baars.html)
- Peterson & Fabian (2006) Peterson J. R., Fabian A. C., 2006, Phys. Rep., 427, 1
- Peterson et al. (2003) Peterson J. R., Kahn S. M., Paerels F. B. S., Kaastra J. S., Tamura T., Bleeker J. A. M., Ferrigno C., Jernigan J. G., 2003, ApJ, 590, 207
- Peterson et al. (2001) Peterson J. R., Paerels F. B. S., Kaastra J. S., Arnaud M., Reiprich T. H., Fabian A. C., Mushotzky R. F., Jernigan J. G., Sakelliou I., 2001, A&A, 365, L104
- Pratt et al. (2010) Pratt G. W., Arnaud M., Piffaretti R., Böhringer H., Ponman T. J., Croston J. H., Voit G. M., Borgani S., Bower R. G., 2010, A&A, 511, A85
- Rafferty et al. (2008) Rafferty D. A., McNamara B. R., Nulsen P. E. J., 2008, ApJ, 687, 899
- Rafferty et al. (2006) Rafferty D. A., McNamara B. R., Nulsen P. E. J., Wise M. W., 2006, ApJ, 652, 216
- Sanders (2006) Sanders J. S., 2006, MNRAS, 371, 829
- Sanders & Fabian (2007) Sanders J. S., Fabian A. C., 2007, MNRAS, 381, 1381
- Sanderson et al. (2006) Sanderson A. J. R., Ponman T. J., O’Sullivan E., 2006, MNRAS, 372, 1496
- Sarazin (1986) Sarazin C. L., 1986, Reviews of Modern Physics, 58, 1
- Soker et al. (2001) Soker N., White III R. E., David L. P., McNamara B. R., 2001, ApJ, 549, 832
- Sonkamble et al. (2015) Sonkamble S. S., Vagshette N. D., Pawar P. K., Patil M. K., 2015, Ap&SS, 359, 21
- Tamura et al. (2001) Tamura T., Kaastra J. S., Peterson J. R., Paerels F. B. S., Mittaz J. P. D., Trudolyubov S. P., Stewart G., Fabian A. C., Mushotzky R. F., Lumb D. H., Ikebe Y., 2001, A&A, 365, L87
- Totani (2004) Totani T., 2004, Physical Review Letters, 92, 191301
- Tremaine et al. (2002) Tremaine S., Gebhardt K., Bender R., Bower G., Dressler A., Faber S. M., Filippenko A. V., Green R., Grillmair C., Ho L. C., Kormendy J., Lauer T. R., Magorrian J., Pinkney J., Richstone D., 2002, ApJ, 574, 740
- Tucker & David (1997) Tucker W., David L. P., 1997, ApJ, 484, 602
- Vagshette et al. (2012) Vagshette N. D., Pandge M. B., Pandey S. K., Patil M. K., 2012, New A, 17, 524
- Vagshette et al. (2013) Vagshette N. D., Pandge M. B., Patil M. K., 2013, New A, 21, 1
- Voigt & Fabian (2004) Voigt L. M., Fabian A. C., 2004, MNRAS, 347, 1130
- Voit et al. (2002) Voit G. M., Bryan G. L., Balogh M. L., Bower R. G., 2002, ApJ, 576, 601
- Voit et al. (2005) Voit G. M., Kay S. T., Bryan G. L., 2005, MNRAS, 364, 909
- Zakamska & Narayan (2003) Zakamska N. L., Narayan R., 2003, ApJ, 582, 162