Pulse-wise GRB correlation: implication as a cosmological tool
Abstract
Gamma-ray bursts (GRBs) are cosmological explosions which carry valuable information from the distant past of the expanding universe. One of the greatest discoveries in modern cosmology is the finding of the accelerated expansion of the universe using Type Ia supernovae (SN Ia) as standard candles. However, due to the interstellar extinction SN Ia can be seen only up to a redshift . GRBs are considered as the potential alternative to push this limit to as high as , a redshift regime corresponding to an epoch when the universe just started to form the first structures. There exist several correlations between the energy and an observable of a GRB which can be used to derive luminosity distance. In recent works, we have studied spectral evolution within the individual pulses and obtained such correlations within the pulses. Here we summarize our results of the pulse-wise GRB correlation study. It is worth mentioning that all GRB correlations are still empirical, and we cannot use them in cosmology unless we understand the basic physics of GRBs. To this end, we need to investigate the prompt emission spectrum which is so far generally described by the empirical Band function. We shall discuss our current understanding of the radiation process particularly the finding of two blackbodies and a powerlaw (the 2BBPL model) as the generic spectral model and its implication. This is a work in progress and we expect to obtain the most fundamental GRB correlation based on our improved spectral model.
keywords:
gamma-ray burst; observational; data analysis1 Introduction
Gamma-ray bursts (GRB) are cosmological explosions which produce an enormous amount of energy erg within a few seconds to a few minutes by means of a highly relativistic jet. A GRB light curve generally consists of a single or multiple broad pulses and rapid variability within the pulses on a timescale down to a few milliseconds.[1] On the other hand, the spectrum is a continuum which is generally attributed to an optically thin synchrotron emission.[1, 2] Interestingly, the spectrum generally shows a hard to soft evolution within the individual pulses.[3] Hence, pulses are important and should be considered independently.
In recent works, [4, 5] we have given particular attention to the individual GRB pulses and obtained the timing and spectral informations. We have then used the GRB pulses to study GRB correlations[6, 7] similar to the Amati correlation[8]. Such studies are important due to several reasons: (1) As the correlation hold within the pulses it shows that the correlation is a pulse property, (2) it also shows that the correlation is real and not due to selection bias, (3) it provides a larger sample compared to the burst average studies. Though pulse-wise GRB correlation is powerful and indicates a basic mechanism of pulse generation, our pulse description is still empirical. Here we review the results of our correlation studies and the possible improvements based on our new findings on the GRB spectrum.
2 Pulse-wise GRB correlation
We have developed a pulse model which describes a pulse simultaneously in energy and time domain.[4] For this we use the spectral model as Band function[9], lightcurve as Norris model[10] and spectral evolution as Liang-Kargatis model[11] (hereafter LK96). Our model is implemented in the X-ray spectral fitting package XSPEC as a table model with two parameters — the peak energy at the beginning of a pulse () and the characteristic evolution parameter (). We apply this model on GRB 090618 and generate the individual pulses. We derive various pulse properties e.g., lightcurve and pulse width in various energies, spectral lag. A comparison with the data shows an excellent agreement. We then use this model for a set of Fermi GRBs with known redshift (). We find that the bears a strong correlation with the energy () within the individual pulses with a Pearson coefficient, and a chance probability, .
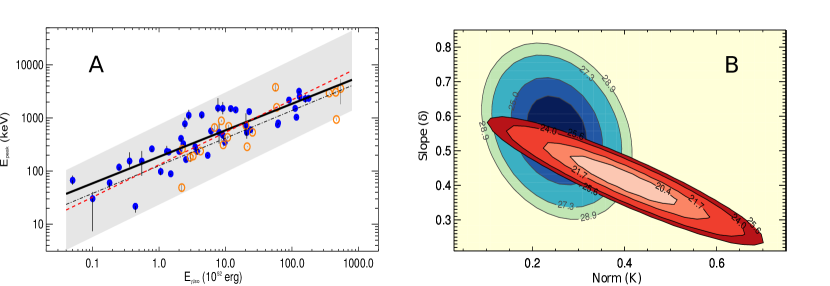
In a recent work,[7] we have studied pulse-wise Amati correlation for a set of 19 GRBs with 43 pulses. We again obtain a good correlation (see Fig. 1A). One of the major goal of GRB correlation study is their application to constrain the cosmological parameters like matter and dark energy density at high redshifts, compared to that provided by the type Ia supernovae ( in optical wavelengths). However, we need to investigate whether the GRB correlation holds for different redshifts. In Fig. 1B, we plot the contours ( for single parameter and for two parameters) of the correlation parameters for different bins, and we clearly see that they match within . Hence, our correlation is stable with .
3 Radiation Mechanism — Thermal Component
The pulse model we have developed is an empirical one. It is worthwhile to mention that all GRB correlations are empirical and shows considerable data scatter. This is also found in our pulse-wise correlation study (Fig. 1A). Hence, it is important to understand the physical mechanism of pulse emission and spectral characteristics. In some studies, the synchrotron origin of the spectrum has been challenged by observations of a spectral photon index higher than -1.5 (or even higher than -2/3), which is disallowed in the fast cooling (slow cooling) regime.[13]
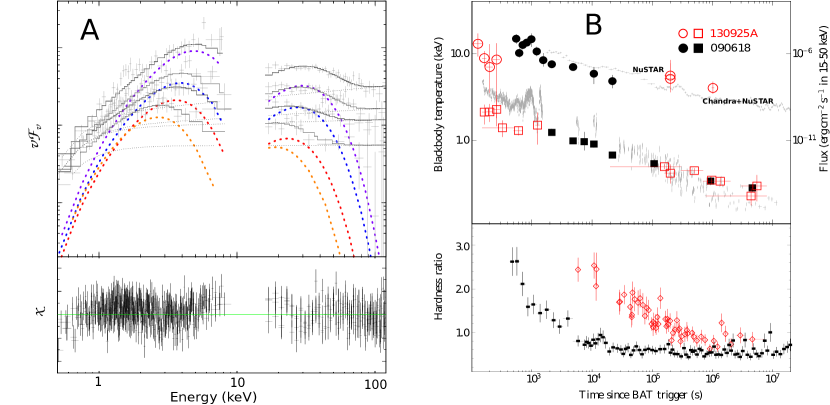
In recent works it is found that the GRB spectrum also contains a thermal component.[14] In general the spectrum is a combination of the thermal and non thermal emission. However, the correct shape of the components is debatable, e.g., a blackbody+powerlaw (BBPL)[14], multi-colour blackbody+powerlaw (mBBPL)[15], two blackbodies+powerlaw (2BBPL)[5, 16, 17, 18, 19], 2BB+cutoff powerlaw (2BBCPL)[18] etc. Moreover, the thermal emission is not always statistically significant. One way to find the correct model is to analyze the data with good spectral resolution e.g., Swift X-ray telescope (XRT), NuSTAR, Chandra. However, due to the focusing nature of these instruments such observations are rare. Recently, we have found two such cases, GRB 090618[18] and GRB 130925A.[19] In Fig. 2A, we have shown the 2BBPL model fitted to the time resolved data of GRB 090618 obtained from Swift burst alert telescope (BAT) and the XRT. In Fig. 2B the temperature and hardness evolution of this GRB is compared with that found for GRB 130925A observed with the XRT, the NuSTAR and the Chandra. We see a remarkable similarity of the spectral evolution which denotes a common radiation mechanism.
We note here that the pulse emission in GRBs can have a wide variety. We have studied all such varieties and found a clear evidence of the two blackbodies in all cases, namely, (1) GRBs with single pulse[5], (2) GRBs with separable multiple pulses[16] and (3) those having highly variable lightcurve[17]. Hence, the model appears to be a generic spectral shape.
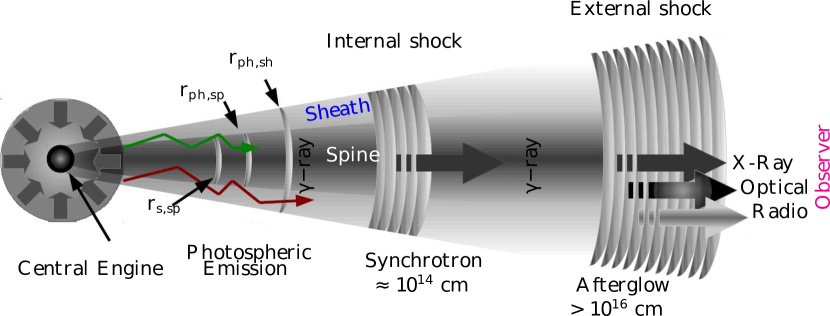
We suggest a spine-sheath jet structure to explain our observations (see Fig. 3).[20, 21] Such a structure is theoretically expected as the GRB jet pierces through the envelop of the progenitor star. The two blackbodies are produced at the two photospheres of the jet, while the photons crossing the boundary layer of the spine and sheath are inverse-Compotonized and form a cutoff powerlaw. In addition, internal shocks produced at larger radius will also contribute to the non-thermal emission. We are planning to pin down the mechanism by developing a spine-sheath jet model[22] and then applying this model on a large set of GRBs to obtain the physical parameters of the jet.

4 Discussion
The 2BBPL model is primarily found to be consistent with the data in keV–MeV or lower (e.g., the XRT) energies. It is useful to apply this model to the prompt emission data in these energies and then investigate the predicted flux in other energies. In the following we perform such analysis to see how much we can explain the emission at very high energies (GeV) based on the spectral model fitted to the lower energy data.
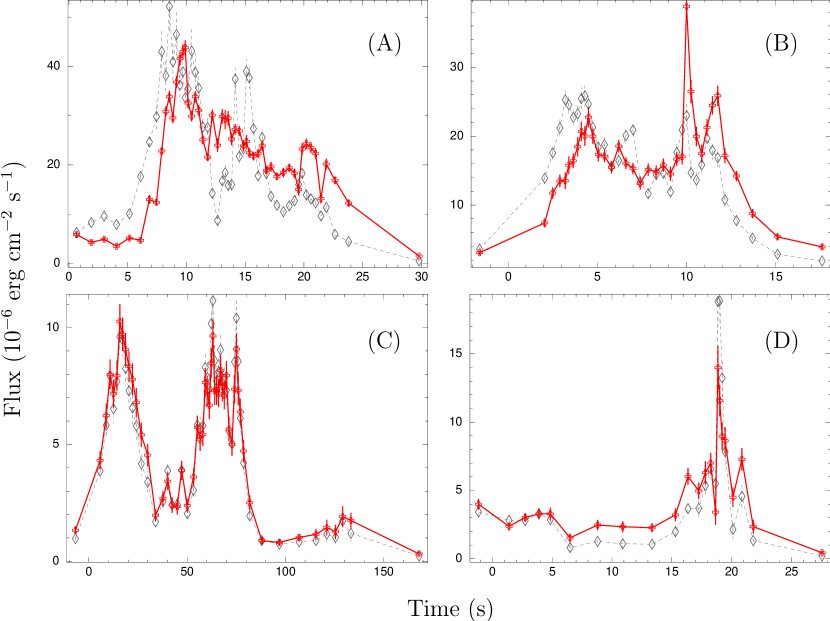
The very high energy (GeV) emission is detected in some GRBs with Fermi large area telescope (LAT). This emission is delayed compared to the prompt keV–MeV emission by a few seconds. It is well known that the Band function cannot capture the wide spectrum from keV to GeV. Also, the GeV flux is found to be uncorrelated with the prompt keV–MeV flux. It is interesting to fit the keV–MeV data with the 2BBPL model and then compare with the flux at GeV energies. Analyzing a set GRBs detected by the LAT, we find a significant correlation of the GeV photon fluence with that of the non-thermal (powerlaw) component of the 2BBPL model fitted to the keV–MeV data.[23] Also, the powerlaw flux of GRBs with high GeV emission tend to have a delayed onset, and this component lingers at the final phase of the prompt emission (see Fig. 4). Remembering that the GeV emission is delayed and long lasting than the keV–MeV emission, we strongly suggest that the powerlaw component of the 2BBPL model shares a common origin with the GeV emission. In the framework of the spine-sheath jet model, this emission is produced at higher radius probably by synchrotron emission. On the other hand, the GeV photons of GRBs with low GeV emission are probably produced due to inverse-Compton of photons crossing the spine-sheath boundary. Clearly such finding strongly validates the 2BBPL model.
In future we shall test whether one or more spectral components of the 2BBPL model can be used to study the GRB correlation. For example, in our pulse model we have assumed that the spectral evolution is given by the LK96 law. We have found that fitting the spectrum with an additional blackbody component leads to a similar evolution. Now, the blackbody temperature shows a similar behaviour as shown by the (see Fig. 5). Such findings give us hope to further improve the pulse description and finally obtain the fundamental GRB correlation based on the physical spectral model.
Acknowledgement
RB is a stipendiary of START program of the Polish Science Foundation (2016) and supported by Polish NCN grants 2013/08/A/ST9/00795, 2012/04/M/ST9/00780, 2013/10/M/ST9/00729, and 2015/18/A/ST9/00746.
References
- [1] T. Piran, Reviews of Modern Physics 76, 1143 (2004).
- [2] M. J. Rees and P. Meszaros MNRAS 258 41 (1992).
- [3] J. Hakkila, T. W. Giblin, J. P. Norris et al. ApJL 677, 81 (2008).
- [4] R. Basak and A. R. Rao, ApJ 745, 76 (2012).
- [5] R. Basak and A. R. Rao, MNRAS 442, 419 (2014).
- [6] R. Basak and A. R. Rao, ApJ 749, 132 (2012).
- [7] R. Basak and A. R. Rao, MNRAS 436, 3082 (2013).
- [8] L. Amati, F. Frontera, M. Tavani et al. A&A, 390, 81 (2002).
- [9] D. Band, J. Matteson, L. Ford et al. ApJ 413, 281 (1993).
- [10] J. P. Norris, J. T. Bonnell, D. Kazanas et al. ApJ 627, 324 (2005).
- [11] E. Liang and V. Kargatis, Nature 381, 49 (1996).
- [12] L. Nava, R. Salvaterra, G. Ghirlanda et al. MNRAS 421, 1256 (2012).
- [13] R. D. Preece, M. S. Briggs, R. S. Mallozzi et al. ApJL 506, 23 (1998).
- [14] F. Ryde ApJ 614, 827 (2004).
- [15] F. Ryde, M. Axelsson, B. B. Zhang et al. ApJL 709, 172 (2010).
- [16] R. Basak and A. R. Rao, ApJ 768, 187 (2013).
- [17] A. R. Rao, R. Basak, J. Bhattacharya, J. et al. Research in Astronomy and Astrophysics 14, 35 (2014).
- [18] R. Basak and A. R. Rao, ApJ 812, 156 (2015).
- [19] R. Basak and A. R. Rao, ApJ 807, 34 (2015).
- [20] E. Ramirez-Ruiz, E., A. Celotti and M. J. Rees MNRAS 337, 1349 (2002).
- [21] W. Zhang, S. E. Woosley and A. Heger ApJ 608, 365 (2004).
- [22] H. Ito, S. Nagataki, S., M. Ono et al. ApJ 777, 62 (2013).
- [23] R. Basak and A. R. Rao, ApJ 775, 31 (2013).