Dependence of the Sr-to-Ba and Sr-to-Eu Ratio on the Nuclear Equation of State in Metal Poor Halo Stars
Abstract
A model is proposed in which the light r-process element enrichment in metal-poor stars is explained via enrichment from a truncated r-process, or “tr-process.” The truncation of the r-process from a generic core-collapse event followed by a collapse into an accretion-induced black hole is examined in the framework of a galactic chemical evolution model. The constraints on this model imposed by observations of extremely metal-poor stars are explained, and the upper limits in the [Sr/Ba] distributions are found to be related to the nuclear equation of state in a collapse scenario. The scatter in [Sr/Ba] and [Sr/Eu] as a function of metallicity has been found to be consistent with turbulent ejection in core collapse supernovae. Adaptations of this model are evaluated to account for the scatter in isotopic observables. This is done by assuming mixing in ejecta in a supernova event.
1 Introduction
Historically the general properties of the r-process have been well identified (Burbidge et al., 1957; Woosley et al., 1994; Wallerstein et al., 1997; Farouqi et al., 2009). The site of the r-process has been identified as originating either in core collapse supernovae (Woosley et al., 1994; Takahashi et al., 1994; Farouqi et al., 2009), or in mergers of binary neutron stars (Freiburghaus, Rosswog, & Thielemann, 1999). Recent efforts have called the former site into question, although the simulations of the conditions that occur in the centers of core collapse supernovae are yet to be simulated in three dimensions and incorporating general relativity. Effects that are generally not included in such calculations, e.g., those that would be imposed by sterile neutrinos (Wu te al., 2014; Warren et al., 2014), could also impact those conclusions. Some of the recent studies have suggested neutron star mergers as a possible site of the r-process, though they may only result in late galactic production of r-process elements (Wanajo et al., 2014; Goreily, Bauswein, & Janka, 2011; Freiburghaus, Rosswog, & Thielemann, 1999). Neutron star mergers, on the other hand, may be complementary to SNe as an r-process source (Qian, 2000; Shibagaki et al., 2016). In particular, the role of multiple r-process sites has been explored including sites incorporating fission cycling as a contribution to galactic abundances (Shibagaki et al., 2016).
In the present paper we study high-resolution spectroscopic data on the logarithmic ratios [Sr/Ba] and [Sr/Eu] where [A/B] for extremely metal poor stars (EMPs, defined as stars for which [Fe/H] -3.0). These data are known to exhibit large fluctuations, over two orders of magnitude, for different stars at the same metallicity, as their metallicity, defined by [Fe/H], approaches -3.5.
The current status of these data is indicated in Figure 1. The data in that figure were selected from the world’s collection of data for EMP stars (Suda et al., 2008, 2011; Yamada et al., 2013) for which the abundances of Ba and Sr were determined from the same study; these were thought to be the most reliable data for these two elements. The selection criterion for these data is the same as in Aoki et al. (2013), but all the data are renormalized by the same solar abundances by Asplund et al. (2009), based on the recent update of the SAGA database (Suda et al., 2016). In the case of the data selection here, the statistics for these data is described in Aoki et al. (2013). The definition of carbon-enhanced stars, [C/Fe] , is the same as in Suda et al. (2011)(see also Aoki et al. (2007b)), all of which are excluded from the sample. However, the fiducial values of [C/Fe] for individual stars are redetermined by the average of all the reported abundances of carbon abundances after the renormalization by the solar abundances of Asplund et al. (2009).
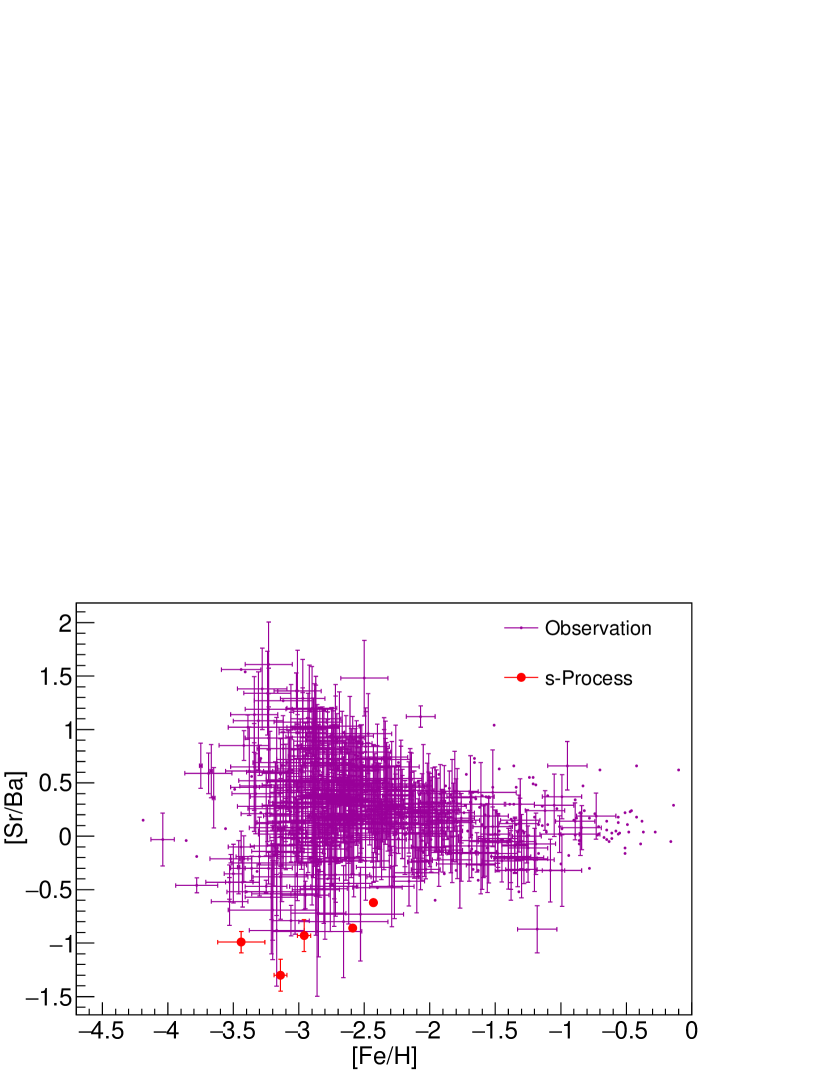
It is particularly interesting to note the sharp decline in observations for [Fe/H]-3.6 (Aoki et al., 2013). In prior work (Aoki et al., 2013) this cutoff was noted, and the reduced number of observations of stars with observable Sr and Ba abundances was pointed out. Since then, there have been more observations of stars with [Fe/H]-3.6 with [Sr/Ba]0.05, though the number still remains low.
We study these data in the context of two models, the Qian-Wasserburg (QW) model (Qian & Wasserburg, 2008) and the truncated r-process (tr-process) model (Boyd et al., 2012). The former QW model is a phenomenological model that describes the EMP star data in terms of three components. This model evaluates the galactic chemical evolution (GCE) of r-process elements from low-mass SNe, normal SNe, and hypernovae (HNe) as the sources of r-process enrichment in the ISM. In particular, the QW model explores the production of Sr and Ba, and results from this model are used to examine [Sr/Ba] as a function of [Fe/H] in metal-poor stars. Because the three sources explored in this model evolve at different rates, this model makes some progress in explaining the evolution of [Sr/Ba] in the galaxy. This model assumes incomplete mixing of the outputs from the progenitor stars which produced the abundances of the EMP stars being observed; the fluctuation in this mixing is assumed to produce the large spread in the [Sr/Ba] ratio. In the tr-process model, the apparent termination in the [Sr/Ba] data at about [Fe/H] = -3.5 is the result of progenitor stars that exceed the minimum mass for direct collapse to black holes (BHs), thereby expelling no r-process nuclides to the ISM. Stars with lower masses would have some of their r-process production expelled into the ISM.
The model explored in this paper only attempts to explain the maximum [Sr/Ba] ejected in a single r-process event; we note that reductions in this ratio may result from mixing between outer and inner ejecta in the explosion or from asymmetric explosion mechanisms. We also note that the observed large values of [Sr/Fe], [Ba/Fe], and [Eu/Fe] (so-called r-II stars) can be reproduced by turbulent ejection (as suggested in Aoki et al. (2013)). The model here represents one potential avenue for producing these extremes.
We explore a previously-proposed model, referred to as the tr-process (Boyd et al., 2012), by which the abundance of r-process nuclides in very metal-poor stars is the result of ejection and subsequent enrichment of the interstellar medium (ISM) from a single-event. The model assumes an r-process in a core-collapse scenario which is halted due to an accretion-induced collapse into a BH or a stalled shock. In this model, newly synthesized nuclei are only partially emitted into the ISM, resulting in an abundance distribution enriched in the light r-process elements. While this process is proposed to occur in the neutrino-driven winds of core collapse supernovae followed by accretion-induced collapse, the current model is general enough that it could occur in other similar events. A possible other site in which a partial r-process may occur in a collapse scenario is that of magneto-hydrodynamic (MHD) jets (Hidaka, Kajino, and Mathews, 2015; Nakamura et al., 2015). It is thought that these phenomena may be associated with collapsed massive stars or possibly even hypernovae (Nakamura et al., 2015). In one scenario, the ram pressure of the jet is sufficient to allow material to escape the collapse of a massive star (even to a BH) and drive the nucleosynthesis within the jet. The model here is similar in that it assumes material escapes the central core in a collapse. Furthermore, the proposed model is not only capable of producing the observed scatter in [Sr/Ba] and [Sr/Eu] at very low metallicity, but it is shown to relate the nuclear equation of state (EOS) to the observed upper limits in [Sr/Ba] and [Sr/Eu].
The scenario described here is used to explain the highest values of [Sr/Ba] and [Sr/Eu] in halo stars and to ascribe a physical explanation to these values and their possible extremes. Here, massive stars which produce type II supernovae (SNII) may collapse due to subsequent fallback. Regardless of the ultimate fate of the collapse, the ensuing fallback can halt the ejection of mass layers deeper in the star. These layers are the ones that produce the heavier r-process elements. Only the outer layers are ejected prior to the collapse; and it is these layers that result in an r-process enriched in the lighter r-process elements. In this model, the layers that are successfully ejected are determined by the collapse time; only layers which have been ejected prior to the collapse result in ejection of r-process elements into the ISM. The collapse time is, in turn, dependent on the explosion energy, which is directly dependent on the nuclear EOS. Layers ejected early are enriched in Sr relative to Ba. Thus, it is proposed that the value of [Sr/Ba] is an observable of the nuclear EOS. Since the more massive stars have shorter lifetimes, and since the collapse time decreases with progenitor mass, more Sr is expected to be produced earlier in galactic history relative to Ba.
The model proposed here is only phenomenological. While we seek to provide an explanation for the extreme [Sr/Ba] values in metal-poor halo stars, the more quantitative evaluation will be developed in a future paper. Though the proposed model is simple, it allows us to address the observed values of [Sr/Ba] at very low metallicity in a GCE model. This model is also supported by prior work to address the role of failed superonovea in the galaxy, particularly as they relate to the so-called ”red supergiant problem” (Hidaka, Kajino, and Mathews, 2015). While prior work has sought to address the problem of light-element enhancement in metal-poor stars via various processes (Arcones & Montes, 2011; Cristallo et al., 2015; Shibagaki et al., 2016; Travaglio et al., 2004), the model here addresses the contribution of failed SNe to galactic chemical evolution via the so-called ”tr-process” (Boyd et al., 2012).
In §2, we give an overview of the collapse scenario in which a tr-process proceeds. This is followed by a description of the collapse and network calculations used to predict abundance distributions in §3. In this section, we show that the collapse time is dependent on nuclear EOS. We describe our results in §4 with concluding remarks in §5.
2 Black Hole Collapse Model of the tr-Process
In this paper, we examine the possibility of the ”tr-process” described in a prior work (Boyd et al., 2012; Famiano et al., 2013) in light of its possible effects on GCE. In this model, the r-process is halted as mass in a type II supernova (SNII) does not escape fallback onto the suface of the nascent neutron star. Mass that is ejected undergoes r-processing, while mass that does not escape the resulting fallback does not contribute to the total r-process enrichment of the ISM. While the tr-process discussed in prior work assumes that a BH collapse is what prevents mass shells from being ejected after the collapse, the model may be applicable to any fallback scenario.
The model described her follows prior work in which the Sr, Ba, and Eu production in an r-process is directly related to the post-bounce time of BH formation, . As with the initial tr-process model, we assume that the r-process is universal in post-bounce ejection time of r-processing zones in a type II supernova independent of the mass of the progenitor star. As the goal of this work is to examine the sensitivity of the EOS dependence of the ejection prior to the post-bounce collapse, we maintain this assumption of universality in this simplified model. We use a simple phenomenological model. A ”canonical” SN r-process site is assumed in which the mass fraction of an r-process element as a function of time is the same for all progenitors, regardless of mass. While this certainly lacks computational rigor, the purpose is to obtain an approximate evaluation of how cutoffs in a partial or failed explosion may affect galactic r-process abundances and to gauge the effects of the the nuclear EOS on galactic abundances.
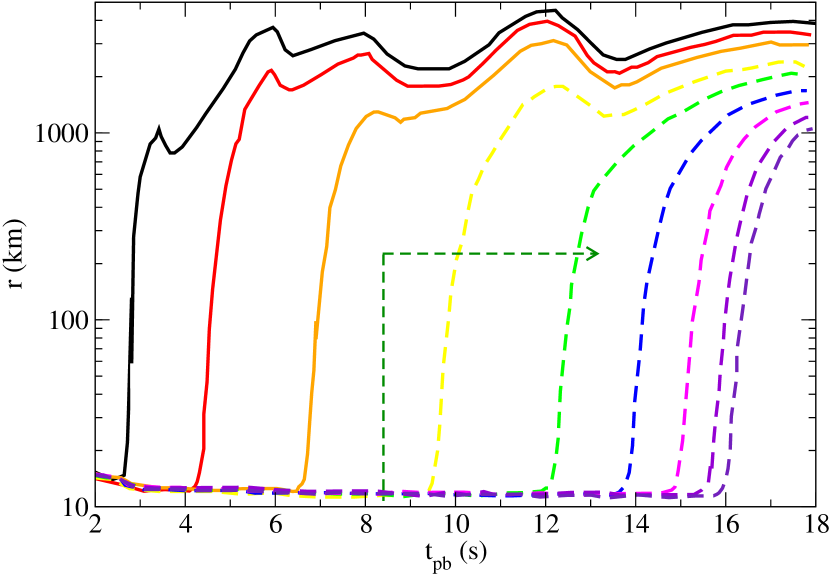
The model is described schematically in Figure 2. (In all figures, is any time post-bounce, is the post-bounce time at which a collapse - potentially to a black hole - occurs.) In this model, the radii of mass shells ejected from a SNII are plotted as a function of time. Some mass shells escape the surface of the nascent neutron star and enrich the ISM in r-process elements, while others fall back to the surface of the star. In the tr-process, mass shells not ejected are assumed to be those that are not ejected at the time of BH collapse. The tr-process as described can have the following effects on the GCE of Sr and Ba. More massive non-rotating stars will exhibit fallback and collapse at earlier times than less massive stars, cutting off ejection of material deeper in the star in a SN explosion. This will result in a higher proportion of lighter r-process elements ejected into the ISM by more massive stars. Further, since more massive stars have shorter lifetimes, higher proportions of lighter r-process elements are expected to be observed at earlier times in the galaxy, resulting in higher [Sr/Ba] values for metal-poor halo stars with lower [Fe/H]. As the galaxy evolves, the values of [Sr/Ba] tend towards the average value observed on Population I stars. However, it is the high [Sr/Ba] values that are of interest in this model. In addition, the epoch at which those values appeared (corresponding to specific [Fe/H]) is also of interest. In the tr-process, the collapse time of a star directly depends on the nuclear EOS with a stiffer EOS resulting in a more energetic bounce and later collapse time. A stiffer EOS ultimately results in more Ba ejected into the ISM prior to collapse. Thus, the EOS dictates the time in galactic history that a particular [Sr/Ba] value is produced. This could mean that the maximum [Sr/Ba] values are observables of the nuclear EOS.
In prior calculations (Boyd et al., 2012; Aoki et al., 2013) the Sr, Ba, and Eu yields in a truncated r-process are directly related to the post-bounce time in an accretion-induced BH (Woosley et al., 1994) or fallback SNII. The Sr, Ba, and Eu yields in a GCE model were based on a primary r-process source using existing GCE abundances where available (Ishimaru et al., 2004; Cescutti et al., 2006). For the accretion-induced BH the collapse time was computed based on progenitor mass and metallicity and the nuclear equation of state (O’Connor & Ott, 2010a). This collapse time was then assumed to be the truncation time in a dynamic tr-process. Longer truncation times would permit mass shells closer to the proto-neutron star core - which are blown off later in the explosion model - to be ejected, either by achieving a velocity in excess of the escape velocity or perhaps by being ejected in a jet. Since these lower-lying ejecta tend to produce heavier r-process nuclides, they enhance the production yields of heavier r-process elements. The mass-weighted yields of Sr and Ba produced in a tr-process can then be scaled based on the collapse time and ultimately on the progenitor mass and metallicity. In this simplified model, although the collapse time is a function of the initial mass and metallicity of the progenitor, the scaling of Sr, Ba, and Eu is a function only of the collapse time (Boyd et al., 2012).
In the r-process, most of the Sr is produced in the early-stage ejecta, while most of the Eu and Ba is produced in the later-stage ejecta of a type-II supernova (SNII). Thus, in an explosion model the Sr yields in a tr-process are fairly constant with collapse time and fairly close to their complete r-process values except for very short collapse times for which essentially no r-process material is ejected. The Ba yields, on the other hand, are very small for early and intermediate collapse times and do not reach their full r-process values until fairly late collapse times (several seconds post-bounce).
In order to relate the collapse time to the progenitor, results from the spherical collapse code GR1D(O’Connor & Ott, 2010a) were used to study the relationship between the progenitor star’s mass and metallicity and the Sr, Ba, and Eu yields, which involves the black hole collapse time, for several nuclear equations of state. It is noted that these yields are minimum yields, since in the non-rotating spherical models employed here, the collapse times are minimum collapse times. Longer collapse times may result from effects such as asymmetric explosions, rotations, and neutrino heating.
The Sr, Ba, and Eu yields as a function of progenitor mass and metallicity were calculated in a multi-zone GCE model to determine the metallicity evolution, for example, of [Sr/Ba] (Timmes, Woosley, & Weaver, 1995). Results for halo stars have been determined. The GCE model parameters employed in this study are the same as those used in Timmes, Woosley, & Weaver (1995). In this model, Sr and Ba yields in massive stars are based on the GCE results of Ishimaru et al. (2004) and Cescutti et al. (2006). For a star enriched by the r-process in this model, the Sr and Ba yields are scaled from the initial yields of Ishimaru et al. (2004) and Cescutti et al. (2006) according to the mass and metallicity of the progenitor for each EOS.
We note that there are significant similarities between our model and the phenomenological three component QW model (Qian & Wasserburg, 2008). Their model has two of their three components competing in the EMP star region, with hypernovae dominating for [Fe/H] -3.5. They attribute production only of lighter nuclei, especially Fe, to hypernovae, although other studies (e.g. Caballero, McLaughlin, & Surman (2012); Izutani, Umeda, & Tominaga (2009)) suggest that hypernovae might also produce a relative enrichment in the lighter r-process elements. The QW model explains the large dispersion of [Sr/Ba] data by assuming spatial inhomogeneities in the products of the two competing components, and assuming a parameter to define the relative contributions of the two components.
Mathematically the QW model is similar to our model, although ours attempts to constrain one specific r-process site. The mixing parameters of QW could be used to characterize the relative deviations of Sr (light r-process nuclides) and Ba (heavy r-process nuclides) galactic abundances predicted by this model. The two models differ primarily in the sharpness of the cutoff of [Sr/Ba] at [Fe/H] -3.5; it would be expected to be more gradual in the QW model than in our model.
Another critical feature of the discussion of the predictions of the two models lies in the upper and lower limits on the [Sr/Ba] values that the two models impose. In the QW model, these limits are fixed by the parameter that describes the fraction of the two components that are assumed to dominate the EMP data. These are relatively well determined functions of [Fe/H].
However, the upper and lower limits in the range of [Fe/H] values in the tr-process model are determined quite differently. The upper limit is essentially infinite, that is, we will show that stars might be expected to have huge [Sr/Ba] values, but these would not be included in the data sample because their Ba abundances would be so low that they would not be detectable. Thus the upper limit is actually set by the observational limits that exist for Ba (Jacobson et al., 2015).
By contrast, the lower limit would be set by the regions of the collapsing star that were able to undergo at least a partial r-process, but that produced a maximum amount of Ba together with a minimum amount of Sr. We have used the r-process calculations of Woosley et al. (1994) to try to estimate what the extreme values of these two isotopes would be. That paper studies the processing in a neutrino wind from the nascent neutron star of a series of shells that are emitted from the surface of the star’s core. The shells that produce the values that are critical to our conclusions are also the ones that were found in that study to produce a successful r-process, that is, they produced both the A = 130 and 195 peaks in reasonable agreement with those observed.
In the study of Woosley et al. (1994), a succession of 40 trajectories (i.e., thin shell wind elements), all originating deep within the (spherically symmetric) star, but having different initial density, temperature, entropy, and electron fraction, were emitted from the star, thus contributing to the total r-process nucleosynthesis. The bubble evolved in time, so that the conditions under which the individual trajectories were processed changed with the identity of the trajectory. We also assumed that the different trajectories were emitted from the star successively, but ceased when the collapse to the BH occurred. This would be consistent with Woosley et al. (1994), who assumed successive emissions of the trajectories to generate a good representation of the solar r-process abundances.
3 Model Calculations
Code calculations are described in Boyd et al. (2012) and are mentioned here for convenience.
The network calculation employed the libnucnet libraries for the reaction networks (Meyer & Adams, 2007) along with the nuclear and reaction data from the JINA reaclib database (Cyburt et al., 2010). As with previous calculations using this model (Boyd et al., 2012), the hydrodynamic model of Woosley et al. (1994) was used as a starting point; trajectories 24-40 were found in that study to produce a successful or partial r-process. Network calculations began at the point where dropped below 2.5. and used initial abundances from the Woosley et al. (1994) results. As with prior work, we assumed an initial abundance of massive nuclei from a single nuclear seed (plus neutrons, protons, and -particles) derived from the average mass and electron fractions, in the trajectories of Woosley et al. (1994), corresponding to the result that the isotopic distribution is peaked around this seed. Each calculation was continued until the abundance distribution versus mass number had frozen out.
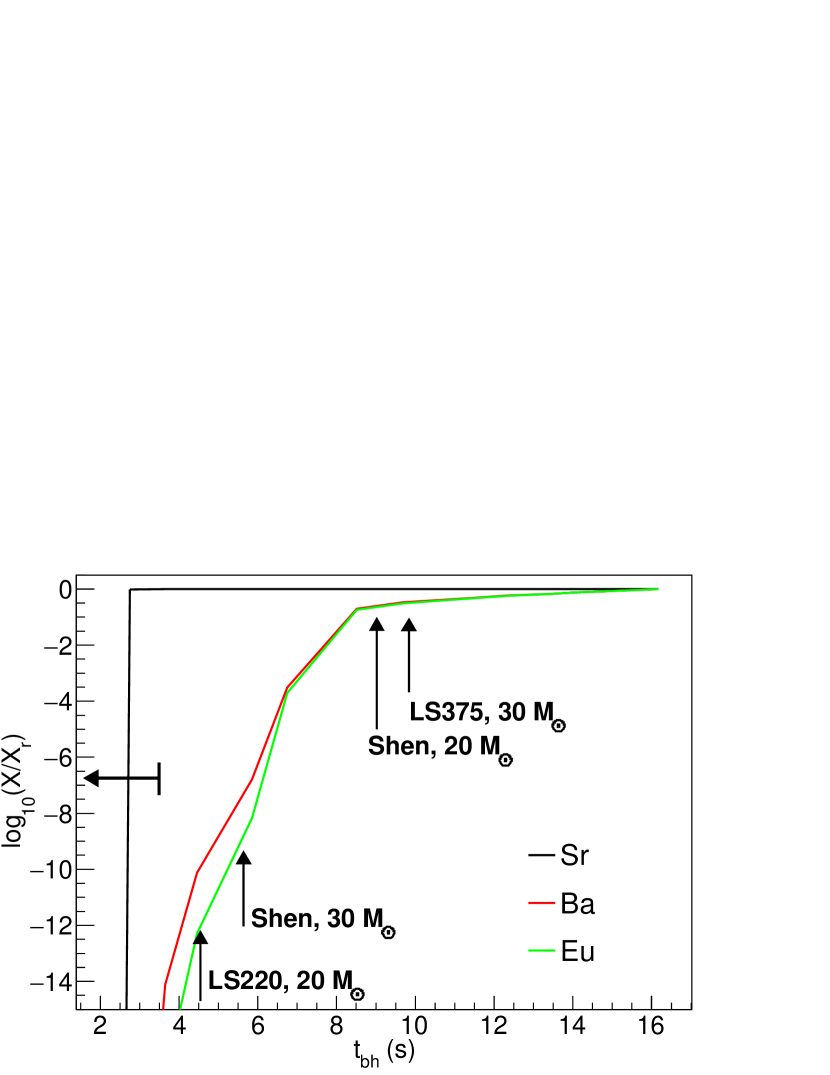
The Sr, Ba, and Eu mass fractions normalized to those of a complete r-process are shown as a function of post-bounce collapse time in Figure 3 for various assumptions about the nuclear EOS (Boyd et al., 2012), which contributes to the collapse time (discussed below). These data use the thermodynamic results from the late-time ejected trajectories in the wind model of Woosley et al. (1994) and a network calculation to compute ejected mass fractions as a function of post-bounce time. A value of one indicates that the resultant mass fraction in the r-process site is equal to that of a complete r-process (i.e., one in which all mass shells in the SN progenitor have been successfully ejected, in which an ensuing r-process produces a robust A195 peak). In this explosion model, the r-process does not proceed until after the ejected mass shell temperature drops well below =10. This does not occur until after the mass shell is rapidly blown off the surface of the nascent neutron star. The temporal evolution of Sr, Ba, and Eu production depends not only on the progress of the r-process within that mass shell, but also on the point in time at which the mass shell is ejected. Sr is produced very early in the r-process evolution because the mass shell in which Sr is produced is ejected early on; only extremely early collapse times result in a significant reduction of the Sr production, while the Ba and Eu abundances are built up more slowly in time; delayed BH collapse or failed explosions can therefore cut off the later ejected mass shells, which produce more robust Ba and Eu abundances. Thus, any shells which may not be ejected due to fallback or a delayed failed explosion will not contribute to the final r-process abundances, resulting in a partial r-process abundance distribution. We use this model to parametrize the Sr, Ba, and Eu production as a function of collapse time in all collapse scenarios.
The relationship between the stellar progenitor and the compactness has been shown in previous works (O’Connor & Ott, 2010a), where the compactness parameter is defined at bounce as
| (1) |
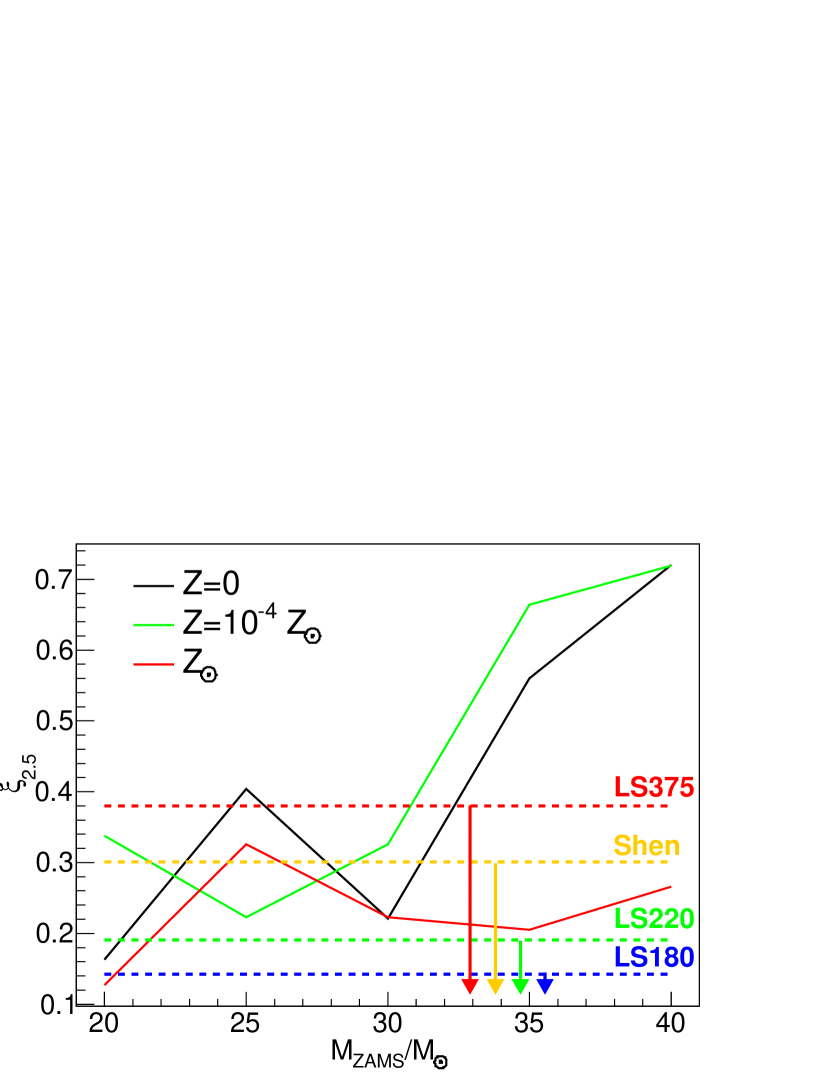
In this case, it is convenient to choose the compactness at , . This relationship is shown in Figure 4 for various progenitor masses and metallicities, and varies slightly with the nuclear EOS. In this figure, progenitor masses are taken from the compilation of Woosley, Heger & Weaver (2002).
The relationship between the compactness and the BH collapse time for several nuclear EOSs is shown in Figure 5 (O’Connor & Ott, 2011). Each data point represents the results of a GR1D calculation for a particular progenitor model. It can be seen that the collapse time can be determined using only the compactness and the EOS. In this way, the details of the bounce, which depend on the stellar mass and metallicity, are conveniently contained within the compactness parameter. For each EOS, the collapse time in seconds can be parametrized as
| (2) |
In Figure 5, long collapse times (t3.5 s) are extrapoloated based on the value of in the collapse. The uncertainty of these long collapses will be discussed later. At the suprasaturation densities of neutron star interiors, a stiffer EOS, such as the LS375, will result in a larger neutron partial pressure, and the collapse time will be longer than in the case of a softer EOS, such as the LS220.
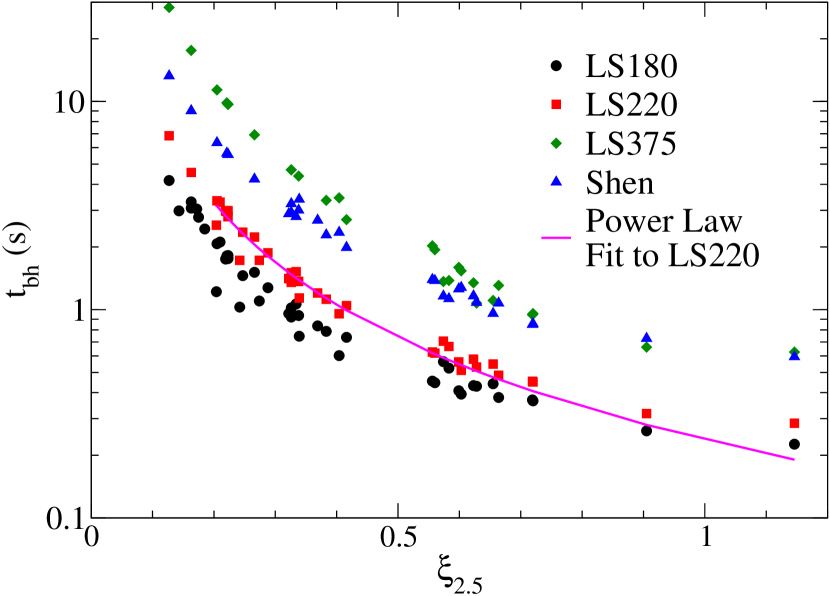
The collapse times in this figure can be compared to those determined in prior evaluations (Sumiyoshi, Yamada, & Suzuki, 2008). While they are comparable in models for 40 evaluated by Sumiyoshi, Yamada, & Suzuki (2008), the slightly longer collapse times in that work are most likely due to the fact that the progenitor models used (Woosley & Weaver, 1995) did not include mass loss resulting in a higher compactness at bounce.
Given the results in Figures 3, 4, and 5, the Sr, Ba, and Eu yields in a tr-process (normalized to those produced in a full r-process) can be determined as a function of progenitor mass and metallicity. As noted, these yields are minimum yields. That is, in the non-rotating spherical models employed here, the collapse times in Figure 5 are minimum collapse times.
It is noted, however, from Figure 5 that the collapse time as a function of becomes very sensitive to below a certain cutoff in . Previous models have assumed that a collapse time s represents a successful explosion (O’Connor & Ott, 2011). Similarly, other models have evaluated the success rate of the explosion as a function of (Horiuchi et al., 2014). In either case, the explosion success is determined as a fraction of models calculated with the same zero-age main sequence (ZAMS) mass, with model variations determined by various model parameters for individual ZAMS mass. In the parametric model here, we evaluate the tr-process cutoff times in two different ways. First, we assume that t3.5 s is possible, and evaluate these times in the tr-process model. Second, we assume that any collapse longer than 3.5 s is not possible, and a full r-process results. This assumption, though arbitrary, is supported by prior work (O’Connor & Ott, 2011). Further, this allows us to gauge the uncertainty in the collapse in our model; if long collapse times are not possible, we have an estimate of the effect of not including these times in the calculation.
It is worthwhile at this point to mention the relationship between the collapse time, the compressibility, and how a collapse or failed explosion is determined. For example, let us consider Figure 3. Because the Sr-producing shells are ejected early on, as mentioned previously, Sr is produced earlier than Ba or Eu, which is produced in shells ejected later. Thus, any collapse which occurs in the intervening time between the Sr-producing shells and the Ba-producing shells will result in Sr-enriched matter ejected into the ISM. Any collapse occurring after the ejection of the Ba-producing shells will result in a more robust r-process. Any collapse prior to this will prevent these Ba-producing shells from begin ejected. As it turns out, many of the stars in our calculations have collapse times less than 3.5 s. This time range is shown as a horizontal double arrow in Figure 3. Examining this time range, it is noted that nearly all collapse scenarios will result in no production of Ba and Eu, while it may result in partial or full production of Sr because the collapse time is less than the time necessary to produce Ba. The tr-process is binary in this respect.
There are then three regions of interest in Figure 3. The first is for collapse times between about 3 and 4 s. For these stars, 100% of the produced Sr is ejected, and essentially no Ba and Eu is ejected. These would include the more massive and some intermediate-mass stars, depending on the EOS. The second region is the region where the collapse time is less than 3 s. In this region, the Sr abundance drops precipitously. This region would include the most massive stars in this model.
The third region is perhaps the most interesting. This is the region where the collapse time is greater than about 4 s. Using Equation 2 and Figures 2 and 4, collapse times can be determined for various masses and EOSs. Stars with calculated collapse times between 4 s and 17 s are shown in this figure. For these stars, this model assumes that - while 100% of the produced Sr is ejected into the ISM - only a fraction of the Ba and Eu is ejected. These stars are assumed to have successful explosions. However, in this model, consistent with the assumptions of the tr-process, we assume this computed collapse time in creating a parameter to gauge the amount of ejected material. This also helps to compensate for the binary nature of our model in terms of explosion or failed explosion. That is, the fraction of failed explosions for stars in the intermediate mass range (Horiuchi et al., 2014; O’Connor & Ott, 2011) is simulated in our model by simulating a fractional r-process for stars in this range.
We can also obtain a rough idea of whether or not a star will collapse in this model and how. Using this result and using the cutoff time of 3.5 s as the time above which no Ba and Eu is produced (also the time above which no collapse is assumed to occur in the referenced collapse model (O’Connor & Ott, 2011)), one can determine the compactness for which a star will then collapse using Equation 2. This critical compactness, , depends on the EOS, and is shown in Figure 4. For a chosen EOS, any star with will collapse at a time greater than 3.5 s. For example, for a stiffer EOS in this model, only the most massive low-metallicity stars will result in a collapse at 3.5 s. However, for the softest EOS, all but the least massive stars will result in a collapse. Because of the binary nature of this model (collapse probability is either zero or unity), and because a collapse generally (but not always) results in only Sr escaping the star, this becomes relevant in relating the [Sr/Ba] ratio to the predicted GCE abundances. If only the most massive stars collapse as in the case of a stiffer EOS, one expects lower overall [Sr/Ba] values, whereas if only the lighter stars successfully explode, one expects higher overall [Sr/Ba] values. Because the collapse probability is set to unity in this model, an upper limit on [Sr/Ba] can be placed in the GCE calculation.
4 Results
Assuming a tr-process model resulting in Sr, Ba, and Eu production yields given in Figure 3, the [Sr/Fe], [Ba/Fe], and [Eu/Fe] values as a function of metallicity [Fe/H] are shown in Figure 6 for various assumptions of the EOS. Four different EOSs are examined in this calculation. These include three variations of the Lattimer-Swesty EOS (Lattimer & Swesty, 1991) and the Shen EOS (Shen et al., 2011). It is clear that the EOS has a significant effect on the value of [Ba/Fe] and [Eu/Fe] as a function of stellar metallicity with only a slight effect on the [Sr/Fe] values. A tr-process event will produce less Ba and Eu for a softer EOS. Roughly correlating metallicity, [Fe/H] to galactic age (Timmes, Woosley, & Weaver, 1995), we can explain this behavior as follows.
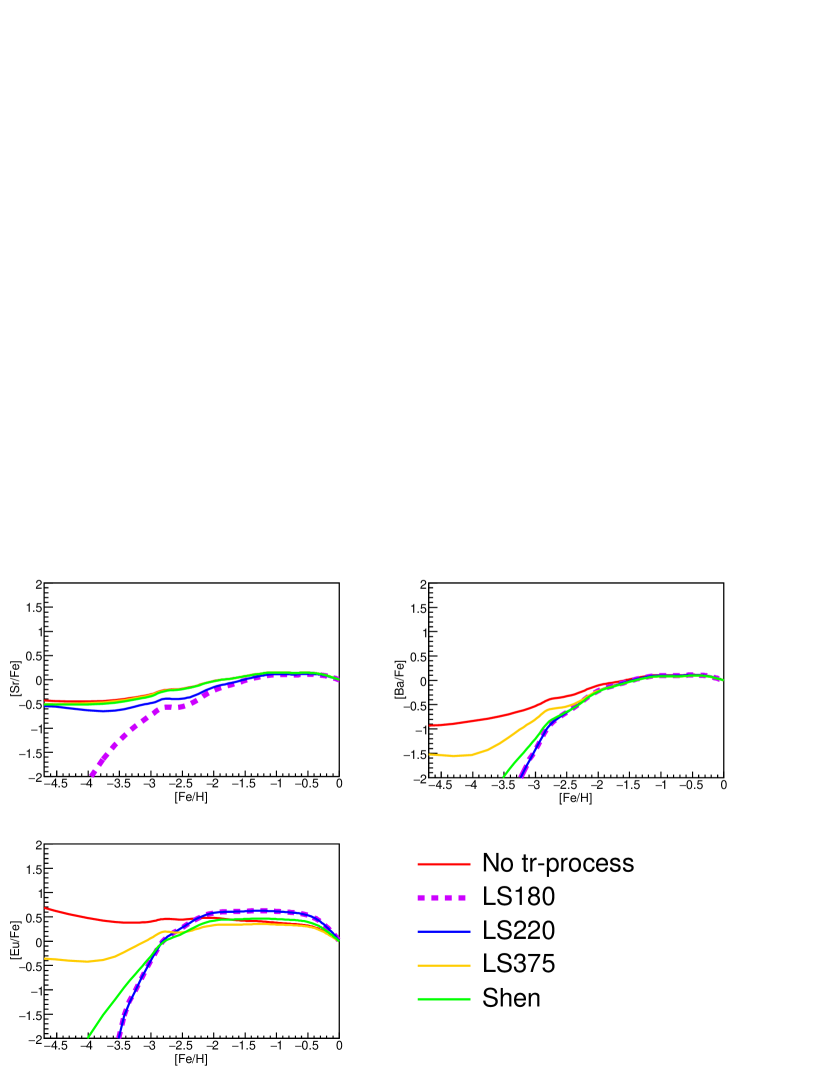
A stiffer EOS will have a longer collapse time as the neutron partial pressures are larger in the high-density, isospin-asymmetric core. This longer collapse time can permit more material ejection during the r-processing phase. The net result is that the r-process progenitor element ejection into the ISM will not vary as much from that of a typical r-process (in which the “collapse time,” is assumed to be infinite). On the other hand, for a softer EOS, the faster collapse time will significantly reduce the amount of Ba and Eu ejected as this is produced in layers closer to the core, which are ejected later. For an earlier collapse time, the cutoff in production will occur prior to the ejection of the mass shells responsible for the production of r-process elements beyond the A130 peak. Since the collapse time also roughly depends on progenitor mass, more massive stars will produce higher [Sr/Ba] ejecta earlier in galactic history, shifting [Sr/Ba] as a function of [Fe/H] in GCE predictions.
The effects of the collapse on Sr production are not as pronounced, since Sr is produced in the very early stages of the r-process (and likely has a contribution from the s-process as later times in the galactic evolution corresponding to higher metallicitiy). In fact, only very early collapse times corresponding to stars with progenitor masses M25M⊙ will result in a tr-process in which the Sr yields are significantly reduced. Given the Salpeter initial mass function (IMF) used in this model, this would comprise a small fraction of the Galactic Sr yield.
The calculated [Sr/Ba] and [Sr/Eu] values are also shown in Figures 7 and 8 compared to observed values. The significant changes in the Ba and Eu ejection in a collapse scenario results in a dramatic change in the [Sr/Ba] and [Sr/Eu] ratios. In a previous paper (Aoki et al., 2013), changes in [Sr/Ba] were suggested to be caused at least in part by turbulent ejection of material in a collapse scenario. It is seen that for a softer EOS, the minimum(maximum) values in [Ba/Fe]([Sr/Ba]) and [Eu/Fe]([Sr/Eu]) as a function of metallicity can be achieved in a tr-process for partial enrichment of r-process elements in a GCE model. As noted above, the GCE results shown in these figures represent extremes in these ratios as they are produced in collapse scenarios corresponding to the minimum collapse time to a BH.
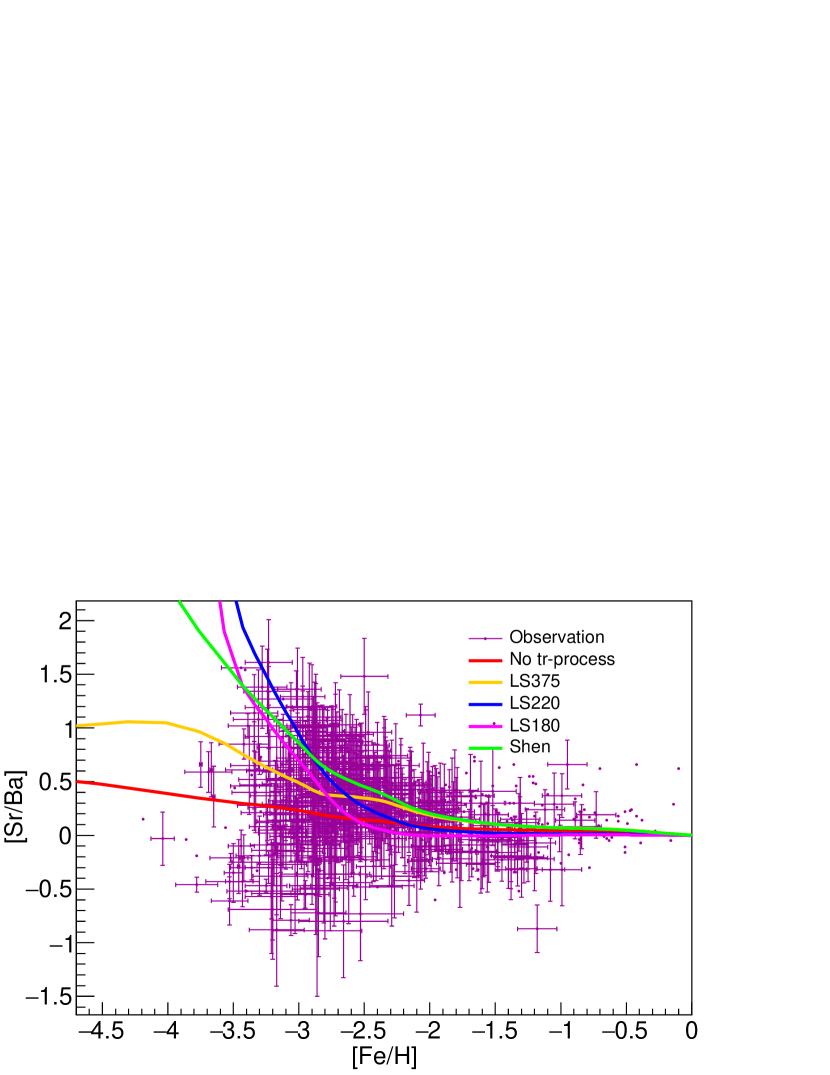
In examining the abundance ratios of [Sr/Ba] and [Sr/Eu] as they relate to the EOS, one sees that these ratios generally increase as the EOS softens. However, at some point, the EOS becomes so soft that the collapse time becomes early enough to prohibit Sr ejection, and the ratios of [Sr/Ba] and [Sr/Eu] begin to decrease with the softness of the EOS. This may occur for an EOS with a softness somewhere between the Shen EOS and the LS220 EOS, as one sees that the [Sr/Ba] and [Sr/Eu] ratios calculated using an LS220 EOS drop below those calculated using a Shen EOS at metallicities -2.5[Fe/H]-2.
We also note the interesting structure of the [Sr/Ba] values for the Shen EOS. While we don’t place a large quantitative weight on this model, we point out that the Shen EOS is not quite as stiff as the LS375, but much stiffer than the LS220 EOS. For the Shen EOS, 20 and 30 Z=0 stars collapse (see Figure 4), but with long collapse times. Also, 25 stars with Z=0 and Z=Z⊙ explode with collapse times less than 3.5 s, but 25 stars with Z=10 do not. These stars may be major contributors to Ba enrichment at [Fe/H]-3.
One sees from an examination of Figures 6 - 8 that there appears to be a sharp lower limit in the [Ba/Fe] and [Eu/Fe] ratios as a function of metallicity corresponding to a sharp upper limit in [Sr/Ba] and [Sr/Eu]. We note that a softer EOS will produce this trend. However, if the EOS is not soft enough, this trend cannot be produced by a tr-process alone. On the other hand, if the EOS is too soft, the lower(upper) limit in [Ba/Fe]([Sr/Ba]) and [Eu/Fe]([Sr/Eu]) exceeds the limits of the observations. These observed limits then provide observational constraints on the stiffness of the nuclear EOS. In comparing these results to those of Aoki et al. (2013), one may conclude that it is possible that the tr-process may be responsible for not only the upper and lower limits in the heavy metal production early in the galaxy, but it may also be responsible for the observed scatter in these elemental abundances. The extremes are directly dependent on the EOS in this model.
We also note that in all cases, the value of [Sr/Ba][Sr/Eu], regardless of the EOS chosen or the collapse time cutoff chosen. This is consistent with observations (see Figures 7 and 8). This results primarily from the fact that Eu is produced in later ejecta in the explosion model. Since it is ejected at later times, the overall value of [Sr/Ba] is expected to exceed that of [Sr/Eu].
4.1 Uncertainties in Results
In Figures 7 and 8, an arbitrarily long collapse time (as a function of ) has been assumed. However, these longer collapse times may be uncertain, so we evaluate the uncertainty induced by assuming a collapse time. To do this, we repeat the calculation of Figures 7 and 8, but we assume that any collapse time in excess of 3.5 s is not possible, and the explosion mechanism produces a complete r-process (i.e., no tr-process). Exclusion of these longer collapse times from the tr-process, while somewhat arbitrary, corresponds to prior evaluations, in which the calculated collapse time is assumed to be less than 3.5 s (O’Connor & Ott, 2011). The results of this analysis are shown in Figure 9. In this figure, we compare the GCE calculations of Figures 7 and 8 to results of the same GCE evaluation; however, we assume that collapse times cannot be greater than 3.5 s. That is, if a collapse time is determined to be greater than 3.5 s, then a full r-process results in that scenario since all shells in the SN are ejected. In these figures, the range between the dashed and solid lines is the range for which this model can be taken to predict the [Sr/Ba] and [Sr/Eu] values. This analysis is applicable to stars with collapse times between 3.5 s and 16 s (for which a full r-process will occur in the ejecta). Collapse times longer than 16 s will not be affected (even if the stars collapse at this time) because the tr-process will have already produced Ba and Eu abundances matching those of the r-process.
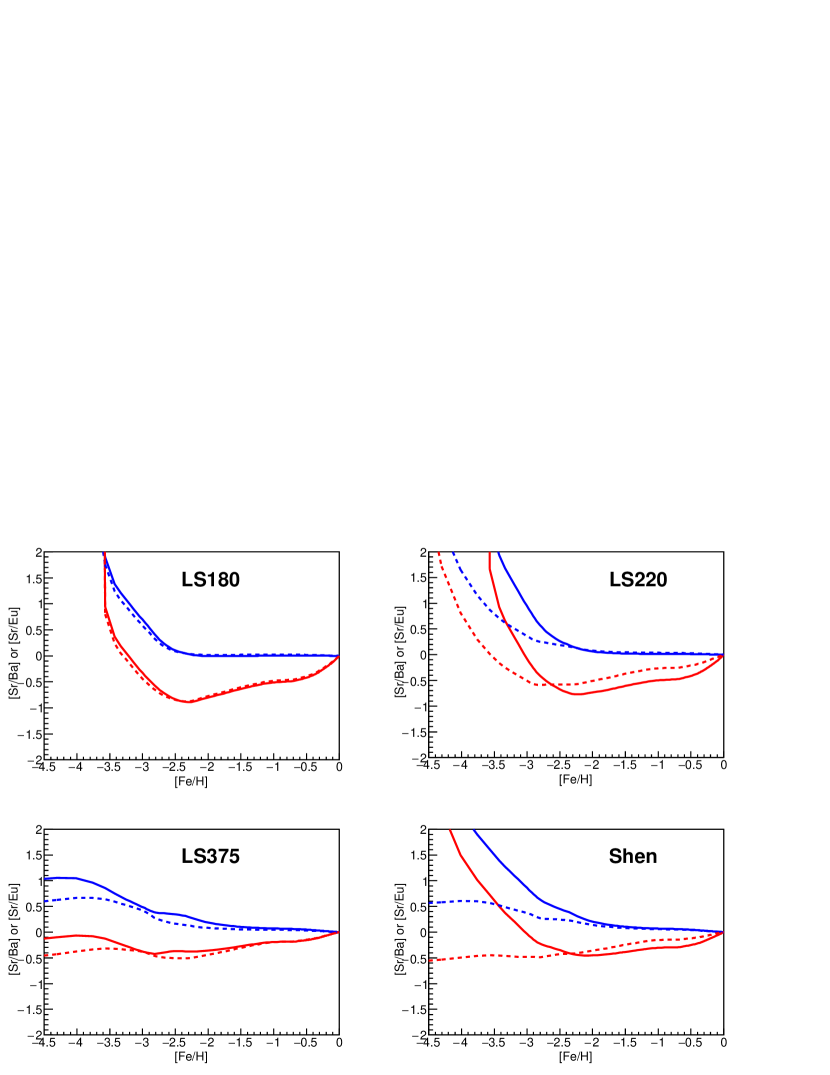
We see from Figure 9 that the very soft LS180 EOS does not change significantly if long collapse times are neglected. This is because for the LS180 EOS, only the least massive stars escape collapse into a BH. We can expect this, if we examine Figure 4. In this figure, nearly all stars fall above the 3.5 s limiting line for the LS180 EOS, indicating that nearly all stars will collapse above 20 M⊙, and no r-process is possible.
For the LS220 EOS, however, it would appear that if we assume a full r-process for a calculated collapse time greater than 3.5 s, then Ba and Eu is produced earlier on in galactic history. This is because Z=0, 20 M⊙ stars, with calculated collapse times of just over 4.5 s, are now able to eject Ba in an r-process event. (These stars are indicated in Figure 3.) If a collapse time of 4.5 s is assumed, then a negligible amount of Ba and Eu is produced. Given the larger population of 20 M⊙ stars in the IMF, this shifts the [Sr/Ba] drop to earlier times in galactic history. Most of the collapse times are in a range between about 1 and 3.5 s in this work, as indicated in Figure 3. This range is important because for collapse times in this range, either all or none of the Sr will be produced. However, it can be seen from this figure that, in general (though not always), a collapse will result in a maximum amount of Sr ejection but no Ba ejection.
A small change is noticed for the very stiff LS375 EOS. Very little change is expected because nearly all stars explode successfully (or have collapse times long enough to produce a full r-process). This model shifts slightly closer to the model with no tr-process.
Perhaps the most dramatic shift is for the the Shen EOS. If a full r-process is assumed for long collapses, then the Shen assumption produces results which approach those of no tr-process. In the case of the Shen EOS, several stars have collapse times greater than 3.5 s, but less than 16 s. These are the Z=0, 20 M⊙ and 30 M⊙ stars, the low-metallicity 25 M⊙ star, and all but the 25 M⊙ solar metallicity star. Moving production of these collapse scenarios from a tr-process to a full r-process can dramatically change the outcome.
If this production is a result of the tr-process, then the EOS dependence of the collapse time has a direct effect on the Sr and Ba production. Since the plotted values of [Sr/Ba] are maximum values, then it would appear that in this model a very stiff EOS cannot produce the upward scatter in [Sr/Ba]. A softer EOS is necessary. It’s also noted that the upper limit of observed [Sr/Ba] values provides an observed lower limit on the softness of the EOS.
4.2 Turbulence and Mixing
Because of the 1D nature of the collapse studied and the phenomenological assumption that a collapse or fallback is directly related to shell ejection time of a shell in a SNII, mixing and turbulent ejection is not dealt with in a strict quantitative fashion. However, a simplistic evaluation of how mixing and turbulence may affect fallback and collapse scenarios is provided.
Two situations are studied. For a tr-process, the ejected mass fraction of an element ejected from the proto-neutron star is a sum of mass fractions for individual mass elements up to the mass cutoff in the collapse
| (3) |
where is the amount ejected for a shell of mass at mass and the mass cutoff is determined by the collapse time. The point below which material falls back to the surface of the neutron star is at , and is the outer-most mass shell in the SN in which an r-process occurs. In the case of turbulent mixing, the mass fraction of a species as a function of the ejected mass can be mixed between mass shells and is represented by a convolution between individual shells. The adjusted mass fraction is:
| (4) |
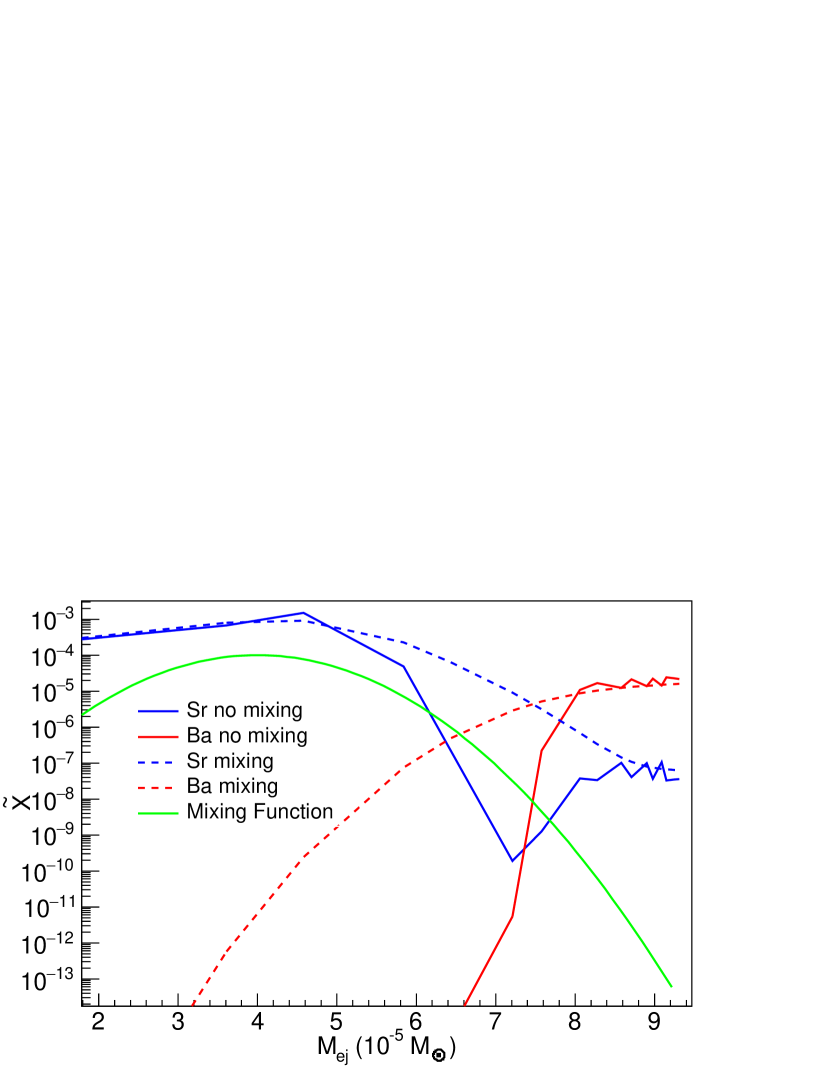
where and is the top and bottom mass shell of the mixing zone, or the maximum and minimum of the mixing function, respectively. The function is a function representing mixing between a shell at mass and one at mass . This function has a peak at and decreases monotonically for values above and below . In this model, is negligibly small at and The mixing is taken over all shells, including those below the mass cutoff. In this case, a mixing of matter between adjacent shells is implemented. For rapid changes in yields between adjacent shells, this can have large effects around the mass cut. We refer to this as the “turbulent mixing” case. For this example, the weighting function is taken to be a Gaussian function of width =510-6M⊙. The net result is that isotopic composition in an ejected shell becomes a weighted average over that shell and adjacent shells. In general, this should have little overall effect for a complete explosion in this model. However, for a partial explosion, matter below the mass cutoff may be moved outward in the ejection. The concept of turbulent ejection is shown in Figure 10, which shows the differential normalized yields of Sr and Ba as a function of mass coordinate of the ejected shell. The net effect is not to change the overall amount of material that is ejected in an r-process, but to redistribute it somewhat. In this case, there is little effect on the Sr in a tr-process as most of that is ejected early on, and only short collapse times will reduce the Sr abundance. One sees that the Ba ejection as a function of mass is increased by several orders of magnitude for early stage (low mass) ejecta.
Another effect of turbulence, referred to as the “turbulent ejection” case, involves the preferential ejection of matter into the ISM due to ejection of pockets of material near the collapse radius. This is similar to the turbulent mixing case except that the turbulence is assumed to occur in a specific location of the star, thus, the weighting function is fixed about a specific mass element in the neutrino-driven wind
| (5) |
In this case, only mass elements near are ejected. Turbulent ejection is very similar to turbulent mixing in that the amount of matter does not change in a complete r-process. However, it is redistributed by weighting one particular mass shell over the other. One may think of this as moving material from one mass shell to another, creating a “turnover” or ”exchange” in the mass distribution. The treatment of the differential ejecta is very similar to that shown in Figure 10, but a single mass element from a single area is redistributed. In this case, if the mixing is near the early stage ejecta, Sr near the surface of the star is mixed with deeper layers, resulting in a somewhat delayed ejection of Sr. The ramifications for a tr-process are clear in that the Sr ejection may be reduced for slightly later stage collapse times. The redistribution of mass in this model may result in a reduced amount of Sr ejected early on. The earlier stage collapse times will then result in a reduction in the Sr production while the Ba production, with the bulk of its yield ejected later, remains largely unchanged.
The turbulent mixing case results in a sort of “averaging” between individual mass elements in the ejection. This is explained physically by mixing between adjacent shells. In this case, some matter which would otherwise be ejected then falls below the mass cut in the collapse. On the other hand, some material which would otherwise fall below the mass cut in the collapse is then ejected above the cut due to mixing and escapes the star. In this case, Ba production is more strongly affected as it is produced closer to the protoneutron star surface. For ejection times corresponding to mass cuts at smaller radii, Ba which is ejected much later in the SN explosion is mixed near the mass cut. The averaging of ejecta producing significant amounts of Ba with adjacent shells producing only a small amount of Ba can result in small changes in the Ba production around the mass cut. However, this type of mixing has significant effects on the tr-process for mass cuts that occur between shells producing significantly different amounts of Ba.
In the simple turbulent ejection assumption here, the temporal characteristics of the ejection are computationally outside of the scope of this work. However, two possibilities can be examined. One is that the mass shells emphasized in Equation 5 are ejected at times corresponding to their ejection times in Figure 3 maintaining the order in which material is ejected, but emphasizing ejection of particular shells over another. In another case, a turbulent ejection mechanism can be assumed in which a single shell is promptly ejected independent of any subsequent collapse. The latter case represents an extreme in the ejection model and is useful for studying the scatter in Sr and Ba in single-site r-process considerations.
For the case of turbulent ejection, preferential emission of individual shells is assumed to occur for stars with mass greater than 20 . By asuming a single shell emission, the yield values for a tr-process GCE calculation are then scaled to the values of the Sr and Ba yield fractions for a particular shell. The results of the GCE calculation assuming a model in which only single shells are emitted via a turbulent mechanism are shown in Figure 11. This calculation assumes that production in an r-proces site is due to the ejection of only a single indicated shell in the figure. The weighting factor , which corresponds to mixing between two shells, but not necessarily adjacent shells. This ejection proceeds independently of the subsequent collapse. Note that while the trend favors Sr production near the surface and Ba production near the core, the trend is not necessarily monotonic with shell number for closely-packed shells near the core. This seems consistent with non-monotonic environmental parameters (e.g., entropy) in the original model (Woosley et al., 1994). This effect may also be responsible for the non-monotonic nature of the [Sr/Ba] values with EOS and [Fe/H] in Figure 7.
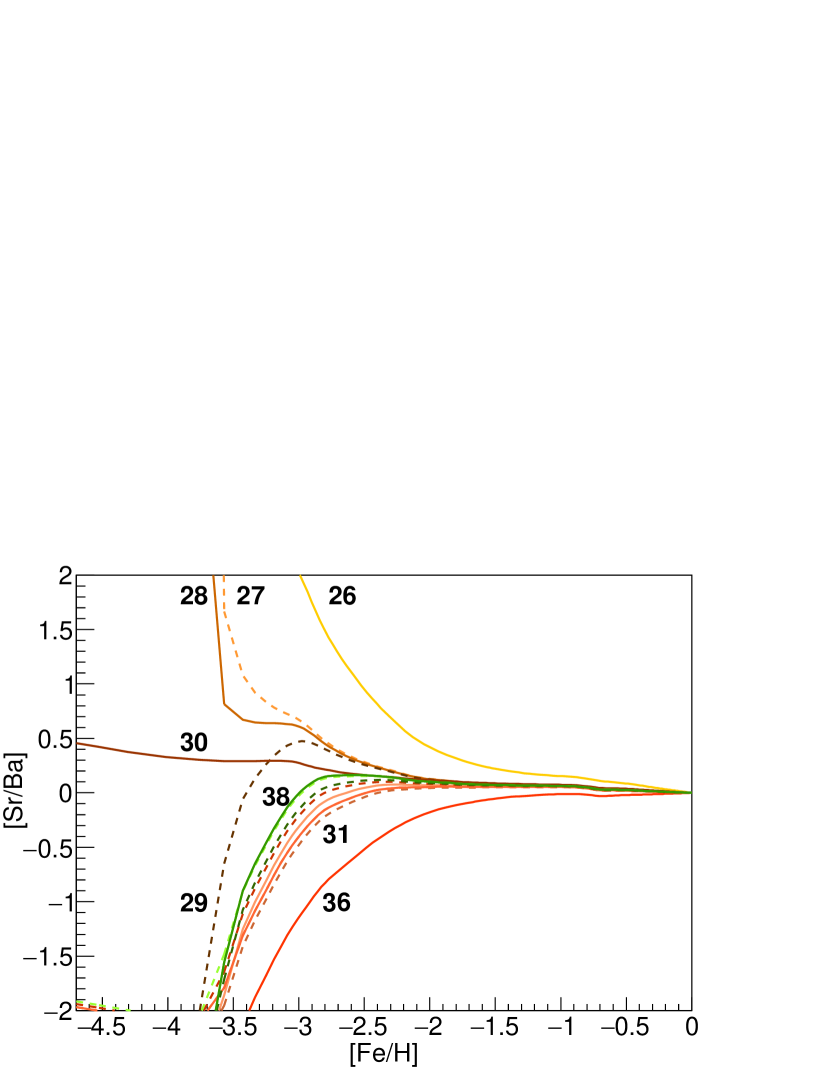
One notes the extremes in [Sr/Ba] in Figure 11. For shells ejected near the surface, the final composition is nearly all Sr, while shells ejected deeper in the star produce nearly all Ba. The resultant range (or scatter) in [Sr/Ba] from this calcualtion covers almost exactly the entire range of observed [Sr/Ba] as a function of [Fe/H] in Figure 1, indicating that a turbulent ejection mechanism in a collapse scenario may be responsible for the large variation in yields in a core collapse scenario.
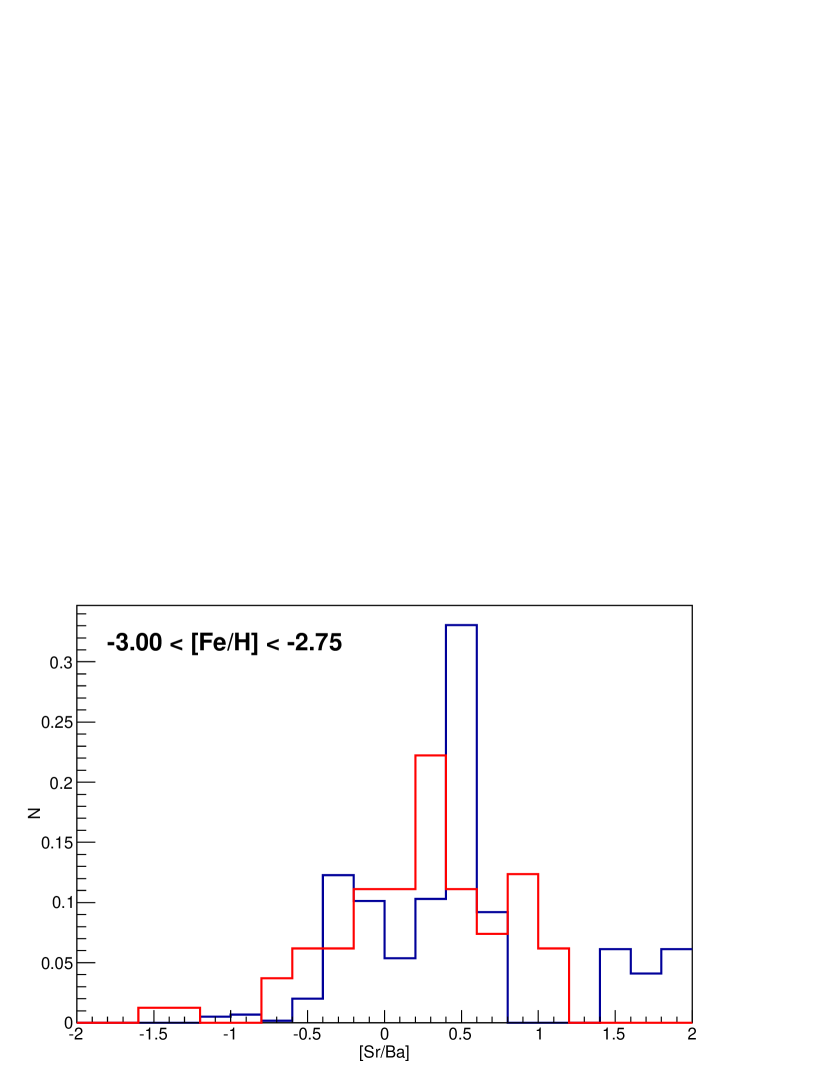
If one makes the assumption that turbulent ejections can occur with equal probability for any of the r-processing shells, we plot the mass-weighted distribution of [Sr/Ba] for single-site r-process enriched stars in our model by projecting the plot in Figure 11 for a specific range of [Fe/H]. An example of this is shown in Figure 12 for -3.00 [Fe/H] -2.75 compared to the same projection from the observations shown in Figure 1 at the same range in metallicity. Each [Sr/Ba] bin from the GCE results shown in the projection is weighted by the mass of the shell producing that value of [Sr/Ba]. We see that, though the distributions are similar (e.g., most of the stars at this metallicity have [Sr/Ba] 0.5, there are some variations in the comparison. These variations are not surprising as the turbulent ejection is not expected to be equally weighted for all mass shells. That is, turbulence may favor deeper or more shallow mass shells in a true core collapse explosion event. For more elaborate models like those of numerical hydrodynamic calculations perhaps this comparison can be used to constrain the amount of turbulence and weighting of turbulence in an event.
5 Conclusions
A model was presented in which the [Sr/Ba] values in EMPs are assumed to result from enrichment from partial explosions of r-process progenitor events in the early galaxy. A large scatter in [Sr/Ba] can result as BH collapse in SNII will cause a truncation in the ejecta and the r-process yields which depends heavily on the progenitor mass. In this model, a maximum in the [Sr/Ba] values as a function of metallicity is due to a minimum collapse time in BH collapse.
The results presented here are compared to observations of EMPs. A fascinating result is that, despite the large scatter in [Sr/Ba], no observations exist above a sharp line corresponding to a maximum in the values of [Sr/Ba] at specific metallicities. It has been shown that in the tr-process model, this value is related to the stiffness of the nuclear EOS.
We stress that this model is used to explain the light-element r-process enrichment in metal-poor stars. However, this does not exclude production of heavy r-process element enrichment in metal-poor stars. This enrichment may be due to asymmetric explosion mechanisms, high angular momentum explosions, or other r-process sites such as neutron star mergers.
We note that the developed model may not be sophisticated enough to determine the nuclear EOS, but it does provide a qualitative suggestion towards a softer EOS. This is consistent with results from prior experimental work (Famiano et al., 2006). Observations of neutron star masses (Lattimer, 2012; Steiner, Lattimer, & Brown, 2004) then provide complementary constraints. However, most fascinating is the prospect that while neutron star masses may determine a minimum in the stiffness of the nuclear EOS, observations of [Sr/Ba] as a function of metallicity may provide a measure of a maximum in the stiffness of the nuclear EOS. That is, a maximum in the [Sr/Ba] as function of metallicty is an indicator that the nuclear EOS must be soft enough to produce such an observation.
It is shown that the apparent scatter in [Sr/Ba] at fixed metallicity may result from an inversion of individual elements during the collapse and subsequent ejection of material from the surface of the proto-neutron star. We have studied the extreme cases in which only a single mass element is ejected prior to a possible collapse in massive stars (Aoki et al., 2014). For mass shells which produce significant amounts of Sr, very little Ba is produced and vice-versa. This can result in a relative enhancement of a particular element possibly explaining the scatter in [Sr/Fe], [Ba/Fe], and [Sr/Ba]. It is interesting that the scatter in our calculations closely matches that of the observational data.
It’s also interesting to note that [Sr/Ba][Sr/Eu] consistent with observations, indicating that the tr-process preserves relative abundances in GCE observations. Further study and observation to compare tr-process results and observations is desired.
The resulting [Sr/Ba] evolution was found to depend strongly on the EOS. Future work will seek to improve the uncertainty in these results. These uncertainties include the assumption of a universal Sr and Ba yield as a function of collapse time independent of the progenitor mass and metallicity as well as the effects from neutrino luminosity profile changes in the collapse.
The proposed model may be useful in future studies in which r-process enrichment in metal-poor stars can be explained with various mechanisms. It is certainly worth expanding the current study to improve on some of the approximations and assumptions in this model. This would include a more accurate treatment of time relationship of r-process ejecta as a function of progenitor mass, an exploration of turbulent ejection in core collapse scenarios, a study of the uncertainties in stellar collapse time as it relates to the dynamics of the collapse, and more complex multi-dimensional collapse calculations. Also, the mechanism of ejection should be carefully examined. The model assumes a core-collapse scenario, though it is applicable to an r-process in a neutrino-driven wind or in a magnetohydrodynamic jet as both can experience a collapse to a BH. In addition, while this proposed model assumes a dynamic effect of material accretion, the effects of neutrino luminosity changes in a collapse may also be a significant cause of the tr-process.
References
- Aoki et al. (2007a) Aoki, W. et al. 2005, ApJ, 632, 611
- Aoki et al. (2007b) Aoki W., Beers T.C., Christlieb N., Norris J.E., Ryan S.G., & Tsangarides S. 2007, ApJ, 655, 492
- Aoki et al. (2013) Aoki, W., Boyd, R.N., Kajino, T., & Famiano, M.A. 2013 ApJ, 766, L13
- Aoki et al. (2014) Aoki, W. at al. 2014, Science, 345, 912
- Arcones & Montes (2011) Arcones, A. & Montes, F. 2011, ApJ, 731, 5
- Asplund et al. (2009) Asplund, M., Grevesse, N., Sauval, A.J., & Scott, P. 2009, ARAA, 47, 481
- Boyd et al. (2012) Boyd, R.N., Famiano, M.A., Meyer, B.S., Motizuki, Y., Kajino, T., & Roederer, I.U. 2012, ApJ, 744, L14
- Burbidge et al. (1957) Burbidge, E.M., Burbidge, G.R., Fowler, W.A. & Hoyle, R. 1957, Rev. Mod. Phys. 29, 547
- Caballero, McLaughlin, & Surman (2012) Caballero, O.L., McLaughlin, G.C., & Surman, R. 2012, ApJ, 745, 170
- Cescutti et al. (2006) Cescutti, G., Francois, P., Matteucci, F., Cayrel., R., & Spite, M. 2006, A&A, 448, 557
- Cristallo et al. (2015) Cristallo, S., Abia, C., Straniero, O., & Piersanti 2015, ApJ, 801, 53
- Cyburt et al. (2010) Cyburt, R.H., Amthor, A.M., Ferguson, R., Meisel, Z., Smith, K., Warren, S., Heger, A., Hoffman, R.D., Rauscher, T., Sakharuk, A., Schatz, H., Thielemann, F.K., & Wiesher, M. 2010, ApJS, 189, 240
- Famiano et al. (2006) Famiano, M. A., Liu, T., Lynch, W. G., Mocko, M., Rogers, A. M., Tsang, M. B., Wallace, M. S., Charity, R. J., Komarov, S., Sarantites, D. G., Sobotka, L. G., & Verde, G. 2006, Phys. Rev. Lett., 97, 052701
- Famiano et al. (2013) Famiano, M.A., Boyd, R.N., Kajino, T., Meyer, B., Motizuki, Y., & Roederer, I. 2013, J. Phys: Conf. Ser., 445, 012025
- Farouqi et al. (2009) Farouqi, K., Kratz, K.-L., Mshonkina, L.I., Pfeiffer, B., Cowan, J.J., Thielemann, F.-K., & Truran, J.W. 2009, ApJ, 694, L49
- Freiburghaus, Rosswog, & Thielemann (1999) Freiburghaus, C., Rosswog, S., & Thielemann, F.-K. 1999 ApJ, 525, L121
- Goreily, Bauswein, & Janka (2011) Goriely, S., Bauswein, A., & Janka, H.-T. 2011, ApJ, 738, L32
- Hidaka, Kajino, and Mathews (2015) Hidaka, J., Kajino, T., & Mathews, G.J. 2015, ApJ(submitted)
- Horiuchi et al. (2014) Horiuchi, S., Nakamura, K., Takiwaki, T., Kotake, K., & Tanaka, M. 2014, MNRAS, 445, L99
- Ishimaru et al. (2004) Ishimaru, Y., Wanajo, S., Aoki, W., & Ryan, S.G. 2004 ApJ, 600, L47
- Ishimaru, Wanajo, & Prantzos (2015) Ishimaru, Y., Wanajo, W., & Prantzos, N. 2015, ApJ, 804, L35
- Izutani, Umeda, & Tominaga (2009) Izutani, N., Umeda, H., & Tominaga, N. 2009, ApJ, 692, 1517
- Jacobson et al. (2015) Jacobson, H.R., Keller, S., Frebel, A., Casey, A.R., Asplund, M., Bessell, M.S., Da Costa, G.S., Lind, K., Marino, A.F., Norris, J.E., Pena, J.M., Schmidt, B.P., Tisserand, P., Walsh, J.M., Yong, D., & Yu, Q. 2015, ApJ, 807, 171
- Lattimer (2012) Lattimer, J.M. 2012, Ann. Rev. Nucl. Part. Sci., 62, 485
- Lattimer & Swesty (1991) Lattimer, J.M. & Swesty, F.D. 1991, Nuc. Phys. A, 535, 331
- Meyer & Adams (2007) Meyer, B.S. & Adams, D.C. 2007, Meteor. and Plan. Sci. Suppl., 2007, 5215
- Nakamura et al. (2015) Nakamura, K., et al. 2015, A&A, 582, A34
- O’Connor & Ott (2010a) O’Connor, E. & Ott, C.D. 2010, Class. Quant. Grav. 27, 114103
- O’Connor & Ott (2011) O’Connor, E. & Ott, C.D. 2011, ApJ, 730, 70
- Qian (2000) Qian, Y.-Z., 2000 ApJ, 534, L67
- Preston & Sneden (2000) Preston, G.W. & Sneden, C. 2000, AJ, 120, 1014
- Qian & Wasserburg (2008) Qian, Y.-Z. & Wasserburg, G.J. 2008 ApJ, 687, 272
- Shen et al. (2011) Shen, H., Toki, H, Oyamatsu, K., & Sumiyoshi, K. 1998, Prog. Thoer. Phys., 100, 1013
- Shibagaki et al. (2016) Shibagaki, S., Kajino, T., Mathews, G.J., Chiba, S., Nishimura, S., & Lorusso, G. 2016, ApJ, 816, 79
- Spite et al. (2014) Spite, M., Spite, F., Bonifacio, P., Caffau, E., Francois, P., & Sbordone, L. 2014, A&A, 571, A40
- Steiner, Lattimer, & Brown (2004) Steiner, A.W., Lattimer, J.M., & Brown, E.F. 2010, ApJ, 722, 33
- Suda et al. (2016) Suda, T., et al. 2016 PASJ (submitted)
- Suda et al. (2011) Suda T., Yamada S., Katsuta Y., Komiya Y., Ishizuka C., Aoki W., & Fujimoto M.Y. 2011, Mon. Not. R. Astron. Soc., 412, 843
- Suda et al. (2008) Suda, T., Katsuta, Y., Yamada, S, Suwa, T., Ishizuka, C., Komiya, Y., Sorai, K., Aikawa, M., & Fujimoto, M.Y. 2008, PASJ, 60, 1159
- Sumiyoshi, Yamada, & Suzuki (2008) Sumiyoshi, K., Yamada, S., & Suzuki, H. 2008, ApJ688, 1176
- Takahashi et al. (1994) Takahashi, K., Witti, J., & Janka, H.-T. 1994, A&A, 286, 857
- Timmes, Woosley, & Weaver (1995) Timmes, F.X., Woosley, S.E., & Weaver, T.A. 1995, ApJ, 98, 617
- Travaglio et al. (2004) Travaglio, C., Gallino, R., Arnone, E., Cowan, J., Jordan, F., & Sneden, C. 2004, ApJ, 601 864
- Wallerstein et al. (1997) Wallerstein, G. et al. 1997, Rev. Mod. Phys., 69, 995
- Wanajo et al. (2014) Wanajo, S., Sekiguchi, Y., Nishimura, N., Kiuchi, K., Kyutoko, K., & Shibata, M. 2014, ApJ, 789, L39
- Woosley et al. (1994) Woosley, S.E., Wilson, J.R., Mathews, G.J., Hoffman, R.D., & Meyer, B.S. 1994, ApJ, 433, 229
- Warren et al. (2014) Warren, M.L., et al. 2014, Phys. Rev. D, 90, 103007
- Woosley, Heger & Weaver (2002) Woosley, S.E., Heger, A., & Weaver, T.A. 2002, Rev. Mod. Phys., 74, 1015
- Woosley & Weaver (1995) Woosley, S. E., & Weaver, T. A. 1995, ApJS, 101, 181
- Wu te al. (2014) Wu, M.-R., Fischer, T., Huther, L., et al. 2014, Phys. Rev. D, 89, 061303
- Yamada et al. (2013) Yamada, S., Suda, T., Komiya, Y., Aoki, W., & Fujimoto, M.Y. 2013, MNRAS, 436, 1362