Do circumnuclear dense gas disks drive
mass accretion onto supermassive black holes?
Abstract
We present a positive correlation between the mass of dense molecular gas () of 100 pc scale circumnuclear disks (CNDs) and the black hole mass accretion rate () in total 10 Seyfert galaxies, based on data compiled from the literature and an archive (median aperture = 220 pc). A typical of CNDs is 107-8 , estimated from the luminosity of the dense gas tracer, the HCN() emission line. Because dense molecular gas is the site of star formation, this correlation is virtually equivalent to the one between nuclear star formation rate and revealed previously. Moreover, the correlation was tighter for CND-scale gas than for the gas on kpc or larger scales. This indicates that CNDs likely play an important role in fueling black holes, whereas kpc scale gas does not. To demonstrate a possible approach for studying the CND-scale accretion process with the Atacama Large Millimeter/submillimeter Array (ALMA), we used a mass accretion model where angular momentum loss due to supernova explosions is vital. Based on the model prediction, we suggest that only the partial fraction of the mass accreted from the CND () is consumed as . However, agrees well with the total nuclear mass flow rate (i.e., + outflow rate). Although these results are still tentative with large uncertainties, they support the view that star formation in CNDs can drive mass accretion onto supermassive black holes in Seyfert galaxies.
Subject headings:
galaxies: active — galaxies: ISM — ISM: molecules1. Introduction
The mass accretion onto a supermassive black hole (SMBH, with a mass of ) is commonly believed to produce the enormous amount of energy observed as an active galactic nucleus (AGN; Antonucci 1993; Urry & Padovani 1995). However, the physics of the angular momentum transfer of the accreting gas remain unclear (Alexander & Hickox 2012 for a review). SMBHs have been claimed to reside at the centers of galaxies with spheroidal components, and there is a correlation between and the properties of the host galaxies, such as bulge mass () and stellar velocity dispersion (). This, a so called co-evolutionary relationship (Magorrian et al. 1998; Ferrarese & Merritt 2000; Tremaine et al. 2002; Marconi & Hunt 2003; Gültekin et al. 2009; Kormendy & Ho 2013 and references therein), indicates that bulges and SMBHs evolved together, by regulating each other. Thus, to understand the mechanism of the angular momentum transfer of the accreting gas at various spatial scales (from a host galaxy to an accretion disk), which is directly connected to the mass accumulation of an SMBH, is of great importance to unveil the currently unknown co-evolutionary mechanism.
Recent numerical simulations have shown that the radial streaming of gas caused by major mergers can efficiently feed the central SMBH, which triggers a powerful AGN as well as starbursts (e.g., Hopkins et al. 2008; Hopkins & Quataert 2010). While such a violent mechanism would be vital for fueling luminous quasars, rather secular processes induced by, for example, barred gravitational potential, galaxygalaxy interactions, or even joint effects of star formation and large-scale dynamics (e.g., Shlosman et al. 1990; Barnes & Hernquist 1992; Kormendy & Kennicutt 2004; Hopkins & Hernquist 2006; Jogee 2006; Rocca-Volmerange et al. 2015), or minor mergers (e.g., Mihos & Hernquist 1994; Taniguchi 1999; Kaviraj 2014), would be sufficient to explain lower-luminosity activity, such as that observed in Seyfert galaxies (e.g., Hopkins & Hernquist 2009; Treister et al. 2012). The lack of enhanced signatures of major mergers or strong interactions in local Seyfert galaxies supports this view (Gabor et al. 2009; Cisternas et al. 2011).
Although large-scale structures, like a bar, would efficiently transport gases towards the central region (e.g., Sakamoto et al. 1999; Sheth et al. 2005), there is little or no clear difference in that scale morphologies between AGN hosts and inactive galaxies (e.g., Mulchaey & Regan 1997; Martini et al. 2003; Simões Lopes et al. 2007; Cheung et al. 2015; Cisternas et al. 2015). Even for smaller-scale morphologies, such as nuclear bars and nuclear spirals (e.g., Shlosman et al. 1990; Hopkins & Quataert 2010), this trend holds, at least in late-type galaxies (typical hosts of Seyfert nuclei, e.g., Martini et al. 2003; Hunt & Malkan 2004). Regarding early type galaxies, on the other hand, Simões Lopes et al. (2007) found that Seyfert nuclei preferentially accompany dusty structures. Thus, the presence of a nuclear dusty (equivalently gaseous) structure is necessary but not sufficient to trigger AGNs. To summarize, there is apparently no unique mechanism in Seyfert galaxies at pc from the center, and direct triggers of AGN activity should exist at the innermost 100 pc region.
At that spatial scale, many studies have proposed that the inflowing gas would form a circumnuclear disk (CND) 111A CND refers to a massive gaseous disk with sizes of parsec [pc] in this work. due to the remaining angular momentum (e.g., Thompson et al. 2005; Vollmer et al. 2008; Ballantyne 2008; Kawakatu & Wada 2008). Indeed, such dense molecular gas disks have been found observationally around Seyfert nuclei (e.g., Krips et al. 2007; Hicks et al. 2009, 2013; Davies et al. 2012; Sani et al. 2012; Izumi et al. 2013, 2015; García-Burillo et al. 2014), although few of them have been resolved spatially. Recently, Hicks et al. (2013) reported on systematic differences at the CND-scale between active and inactive galaxies: Seyfert galaxies showed more centrally concentrated profiles of both the stellar continuum and H2 S(1) line emission with enhanced H2 luminosity. Therefore, molecular surface brightness is clearly elevated in CNDs of Seyfert galaxies.
Because a CND would be a massive reservoir of molecular gas, we can reasonably expect active star formation there. Observationally, prominent star formation has been found as a (circum-)nuclear starburst (e.g., Heckman et al. 1995; Cid Fernandes et al. 2004; Imanishi & Wada 2004; Davies et al. 2007; Diamond-Stanic & Rieke 2012; Alonso-Herrero et al. 2013; Esquej et al. 2014). Interestingly, there are correlations between the star formation rate (SFR) and the black hole accretion rate () in Seyfert galaxies, which are tighter when the SFR is measured in closer vicinity to the AGN, whereas it is weaker for larger-scale () SFR (Diamond-Stanic & Rieke 2012; Esquej et al. 2014). From a theoretical viewpoint, such a correlation would indeed be predicted to exist due to various mechanisms (e.g., Kawakatu & Wada 2008; Hopkins & Quataert 2010).
On the origin of the correlation, we should consider the results of Davies et al. (2007), who showed a time delay of Myr between the onset of star formation and the peak epoch of AGN activity (see also Schawinski et al. 2009; Wild et al. 2010). That delay might be compelling evidence of a causal connection between these activities: that star formation provides the fuel for the SMBH (Section 5). As a candidate mechanism to make such a link, Hopkins & Quataert (2010) suggested, for example, the importance of a series of gravitational instability and the resulting stellar gravitational torque based on hydro-dynamic simulations (see also Hopkins 2012). Inside the central pc, they predicted that a mode (single-armed spiral) develops, which efficiently removes the angular momentum of the gas. Indeed, a nuclear trailing spiral (but ) has been observed in the central 50 pc of the type 1 Seyfert galaxy NGC 1566 (Combes et al. 2014). However, the prevalence in other Seyfert galaxies is unclear, considering that there is no morphological difference between active and inactive galaxies at pc. More directly connected to star formation, mass loss from evolved stars (Norman & Scoville 1988; Ciotti et al. 1991; Padovani & Matteucci 1993; Davies et al. 2007) or angular momentum loss due to supernova (SN)-driven turbulence (Wada & Norman 2002; Kawakatu & Wada 2008; Wada et al. 2009; Hobbs et al. 2011) can also enhance mass accretion.
To determine the properties of cold molecular gas (e.g., mass, distribution, kinematics) is essential for further progress because it takes the bulk of the gas mass in the nuclear region of galaxies (e.g., Honma et al. 1995). Such dense gas could be a source of fuel to an SMBH as well as a stellar nursery. Thus, it should contain information on the origin of the AGNstarburst connection. From this perspective, the pioneering work of Yamada (1994) showed a linear correlation between X-ray luminosity and CO() luminosity in some AGNs, where CO() emission lines were measured with single-dish telescopes (i.e., spatial resolution kpc). Monje et al. (2011) updated that result with improved statistics, again based on single-dish measurements. However, the origin of these correlations is still unclear as is the case for the correlations. Whether there is any dependence of the correlation strength on the probed spatial scale has not yet been investigated. Here, we note that, if we use dense gas tracers for our investigation rather than the conventional CO() line that traces total molecular gas, including diffuse and/or foreground ones, we can expect less contamination, at least from the foreground component (e.g., galactic disks). Moreover, dense gas is indeed the source of massive star formation. Thus, to provide further insights on the AGNstarburst connection more directly and to understand the underlying mass accretion processes at the CND scale, it would be desirable to establish a correlation between AGN activity and some molecular properties based on emission lines that faithfully trace star forming regions, to check the variation in the spatial scale probed, and to explore the origin of the correlations.
1.1. This work
In this work, motivated by the idea above, we explored the possible correlation between and the mass of the CND-scale molecular gas as a natural extension of the previous galactic scale measurements (Yamada 1994; Monje et al. 2011). The mass of dense molecular gas () was investigated preferentially for the reasons above. Thus, we compiled currently available data for a typical dense gas tracer at the millimeter band, specifically, the HCN() emission line (Section 2.1). This allows us to straightforwardly compare results with the correlations, because is directly convertible to SFR (e.g., Gao & Solomon 2004b). The detailed spatial distribution (or gas surface density) and kinematics of dense molecular gas, however, cannot be discussed in this paper as most CNDs have not been resolved spatially at this point. Such a study will be possible with future high-resolution observations provided by, e.g., the Atacama Large Millimeter/submillimeter Array (ALMA).
The rest of this paper is organized as follows. In Section 2, we describe the details of the data and derivation of each physical parameter used. Section 3 describes our regression analysis. The resulting correlation plots between HCN() luminosity and keV X-ray luminosity, or, almost equivalently, between and , are presented in Section 4. Section 5 is dedicated to a discussion of a SN-driven turbulence model (Kawakatu & Wada 2008) for demonstrative purposes, although this is not definitive currently. Our conclusions are summarized in Section 6.
2. Data description
Here, we describe the details of the emission line, sample galaxies, and the procedure to estimate the physical quantities used. The results are listed in Tables 1 and 2. Cosmology with = 70 km s-1 Mpc-1, = 0.3, = 0.7 was adopted throughout this work. We included galaxies classified as Seyfert 1.5, 1.8, and 1.9 into the Seyfert 1 category to maintain consistency with Esquej et al. (2014).
2.1. Line selection
We used the HCN() emission line (rest frame frequency, = 88.631 GHz) as a proxy for . The critical density for collisional excitation with H2 () is cm-3 in the optically thin limit. This line is one of the brightest ones in the 3 mm wavelength band in nearby galaxies after CO(). Unlike CO() which traces total molecular gas (i.e., both dense and diffuse/foreground gas; cm-3), the HCN() emission emanates selectively from dense molecular gas where stars are born (Gao & Solomon 2004a, b; Wu et al. 2005). Thus, using HCN() may be more suitable physically to investigate any possible link between circumnuclear star formation and AGN activity.
Indeed, molecular gas at a CND is typically so dense and warm ( cm-3, kinetic temperature K; e.g., Davies et al. 2012; Izumi et al. 2013; Viti et al. 2014) that CO molecules are readily excited to higher rotational states (e.g., Kamenetzky et al. 2014). However, converting the line flux of high- CO into that of CO() would cause large uncertainty, unless spatially resolved information is available. Thus, it was better to continue to use the transition line that can selectively trace dense gas, such as HCN(), to estimate .
The HCN() line becomes more intense in AGNs with respect to the CO, HCO+, and CS emission lines, compared to starburst galaxies (e.g., Kohno 2005; Krips et al. 2008; Davies et al. 2012; Izumi et al. 2016). This may be a consequence of either an abnormal chemical composition due to AGN feedback, excitation (gas density, temperature), optical depth, infrared-pumping, or even a combination of them. However, the line optical depth of HCN() is almost always beyond unity in most objects (i.e., the intensity gets more or less saturated even if HCN abundance is enhanced in AGNs). Thus, the potential variation in abundance will not severely affect our conclusions as long as we estimate from HCN() line luminosity via the virial theorem. Using a mass conversion factor specifically estimated for AGNs (Krips et al. 2008) will also help to reduce this uncertainty.
2.2. Interferometric data
We compiled high-resolution (aperture pc) interferometric data for the HCN() emission line from the literature and the ALMA archive to estimate of CNDs of nearby Seyfert galaxies. There is currently very little information on such high-resolution HCN() data, which ultimately limits the number of our sample galaxies (called the interferometric sample IT sample). The data were obtained with the Plateau de Bure Interferometer = PdBI (NGC 2273, NGC 3227, NGC 4051, and NGC 6951: Sani et al. 2012 and references therein, NGC 3079 and NGC 5033: Lin et al. 2016), the Nobeyama Millimeter Array = NMA (NGC 1068: Kohno et al. 2008), and ALMA (NGC 1097222ID = 2011.0.00108.S: Martín et al. 2015, NGC 4579333ID = 2012.1.00456.S: ALMA archive, and NGC 7469444ID = 2012.1.00165.S: T. Izumi et al. in preparation). We guide a reader for the detailed data analysis to those references. Regarding each of the PdBI sources, the line flux/luminosity in the literature was measured with an aperture (), rather than a single synthesized beam. This enabled us to cover the entire area of each CND in all cases. In NGC 1097, NGC 4579, and NGC 7469, although the line flux/luminosity measured with single synthesized beams placed at the AGN positions were used, their CNDs were not resolved with the adopted beams. Thus, we covered almost the entire area of each CND in these samples as well. For NGC 1068, there are higher resolution (100 pc) data with PdBI (García-Burillo et al. 2008; Viti et al. 2014). Nevertheless, we used the NMA data mentioned above (380 pc resolution), considering the relatively large CND of this galaxy (300 pc in diameter; García-Burillo et al. 2014). This enabled us to make a fair comparison among the targets because we could compile the line fluxes/luminosities from the entire area of each CND. Note that the ALMA archival data (NGC 4579) were analyzed further with the Common Astronomy Software Applications (CASA ver. 4.2.2; McMullin et al. 2007; Petry & CASA Development Team 2012). The details of this can be found in the Appendix-A. We excluded galaxies showing an absorption feature in the HCN() line from the IT sample. Indeed, NGC 4945 and Centaurus A (both in the ALMA archive) showed prominent absorption features at their nuclei. We also excluded NGC 5194 (M51) from the IT sample because it exhibited a possible feature of maser amplification in the HCN() emission (Matsushita et al. 2015).
Thus, we assessed the HCN() line flux/luminosities for a total of 10 Seyfert galaxies (six type 1 and four type 2). The median distance of the samples was 17.4 Mpc. For each AGN from the literature, we used the line flux/luminosity listed in the reference, measured with an aperture sufficient to encompass the whole CND, as noted above. Thus, the sampled spatial scale differed among galaxies (median value = 220 pc). Note that the angular sizes of the target CNDs were at most a few arcseconds (e.g., Izumi et al. 2013, 2015), which is well below the maximum recoverable angular scale of the interferometers mentioned above. Consequently, the missing flux is not a major problem.
2.2.1 Line luminosity of HCN()
HCN() line luminosity was calculated as
| (1) |
where , , and indicate the velocity-integrated line flux of HCN(),
the luminosity distance to the object, and the redshift of the object, respectively (Solomon et al. 1992b; Solomon & Vanden Bout 2005).
For the data taken from the literature, we simply used the listed after correcting .
For NGC 4579 and NGC 7469, we measured in a zeroth moment map,
which was computed with the CASA task immoments without any clipping
after subtracting the underlying continuum emission.
The velocity ranges for the integration were chosen carefully
to fully cover the full width at zero intensity of the HCN() lines,
but not to be so large as to introduce unnecessary noise.
The RMS noises for these maps were measured in areas free of HCN() emissions.
2.2.2 Mass of dense molecular gas
Assuming that the HCN() emission is emanating from an ensemble of virialized, non-shadowing (in space and velocity) clouds, we can estimate of the CND as (e.g., Solomon et al. 1990),
| (2) |
where is the brightness temperature of the emission line. We direct readers to Papadopoulos et al. (2012) for a more sophisticated formalism that accounts for the departure from the assumptions above. Although the conversion factor () would span a wide range, we adopt = 10 (K km s-1 pc2)-1 throughout this work. This factor was specifically estimated for nearby AGNs through a multi-transitional non-local thermodynamic equilibrium analysis of the single dish-based data (IRAM 30m; Krips et al. 2008). We adopted 0.30 dex uncertainty for this factor, as estimated by the authors above, which dominates the total uncertainty of .
2.2.3 Black hole mass
is used to discuss AGN properties (Section 2.4) and mass accretion mechanisms (Section 5). We favored values derived from stellar or gas kinematics (NGC 1097 and NGC 3227), Very Long Baseline Interferometry (VLBI) maser observations (NGC 1068 and NGC 2273), and reverberation mapping (NGC 4051 and NGC 7469). We fixed a virial factor of for the reverberation method (Grier et al. 2013; Bentz & Katz 2015555http://www.astro.gsu.edu/AGNmass/). For the other galaxies, the compiled in HyperLeda666http://leda.univ-lyon1.fr (Makarov et al. 2014) were applied to the relationship constructed by Gültekin et al. (2009). An intrinsic scatter (0.44 dex) accompanying the relation was also taken into account when estimating the total uncertainty in .
2.2.4 Bolometric luminosity and mass accretion rate
An absorption-corrected keV hard X-ray luminosity () catalogued in published papers was considered a proxy for the bolometric luminosity of the AGN (; e.g., Ho 2008). The bolometric correction of Marconi et al. (2004) was applied to the . The uncertainties in the would be mainly driven by the scatter on the correction and the time variability of the , which, generally, are significantly larger than the statistical error in the . We adopted 0.30 dex uncertainty for each, which is likely to be sufficient. Adding these in quadrature, 0.42 dex uncertainty was set for .
The mass accretion rate onto an SMBH was subsequently estimated using the following relationship (Alexander & Hickox 2012),
| (3) |
where is a typical value for mass-to-energy conversion efficiency in the local universe (Marconi et al. 2004). Any uncertainty accompanying this relationship was not taken into account. Thus, the total uncertainty of is the same as that of , i.e., 0.42 dex. Note that models predict a drop of the in a low accretion phase (Narayan & Yi 1995) due to advection of matter in an accretion disk. In that case, the estimated value above would be the lower limit of . We ignore this potential influence here, but that may be a subject of future studies.
Regarding NGC 6951, we could not find an absorption-corrected in the literature. However, rather than discarding this valuable sample with high-resolution HCN() measurements, we used another proxy for , specifically an [O IV] line luminosity (). The line flux collected by Diamond-Stanic et al. (2009) and the bolometric correction of = 810 (for type 2 Seyfert galaxies; Rigby et al. 2009) were applied. The uncertainty in this was assumed to be at the same level as that derived from for simplicity: i.e., 0.42 dex.
2.3. Single-dish data
To investigate the impact of an aperture for sampling in this study (Section 3), we compiled HCN() flux data for nearby Seyfert galaxies obtained with single-dish telescopes from the literature. Again, the number of HCN() detections limited the total number of our sample (the single-dish sample SD sample). We excluded merging galaxies from our sample, because we could not judge from which galaxy (or both) the line emission came, considering the coarse spatial resolution. The angular resolutions of the telescopes were, 29 (IRAM 30 m), 57 (SEST), 44 (OSO), 72 (NRAO 12 m), 62 (FCRAO 14 m), and 19 (NRO 45 m), respectively, at the of HCN(). These resolutions typically correspond to more than a few kpc and sometimes even reach kpc at the distance of the sample galaxies. This indicates that these observations traced dense molecular gas existing over a bulge-scale (typically a few kpc) or larger (i.e., an entire galaxy). We should also emphasize that the spatial resolution of a few kpc would be insufficient to separate a CND (100 pc scale) from other components in that central region, such as a kpc-scale circumnuclear starburst ring (e.g., Izumi et al. 2013, 2015).
We adopted the same procedure described in Section 2.2 to achieve , , , and . In most cases, we had no choice but to use the relationship (Gültekin et al. 2009) to estimate . This was collected mainly from HyperLeda, and otherwise from the literature. A total of 32 samples (12 type 1 and 20 type 2) were assessed. Their median distances and spatial resolutions were 26.5 Mpc and 5.5 kpc, respectively.
2.4. Comments on the AGN sample
We first note that neither the IT nor SD sample is homogeneous, because they were simply complied from the literature or the archive. Around 75% and 60% of our IT and SD samples, respectively, belong to the revised Shapley-Ames (RSA) catalog (Sandage & Tammann 1987; Maiolino & Rieke 1995), which includes Seyfert galaxies brighter than mag. The RSA sample is a magnitude-limited one, sensitive to low-luminosity AGNs. However, as shown in Table 1, the morphology of our sample was mostly the barred spiral (SAB or SB type), which clearly contrast against the broader distribution of the whole RSA Seyfert sample.
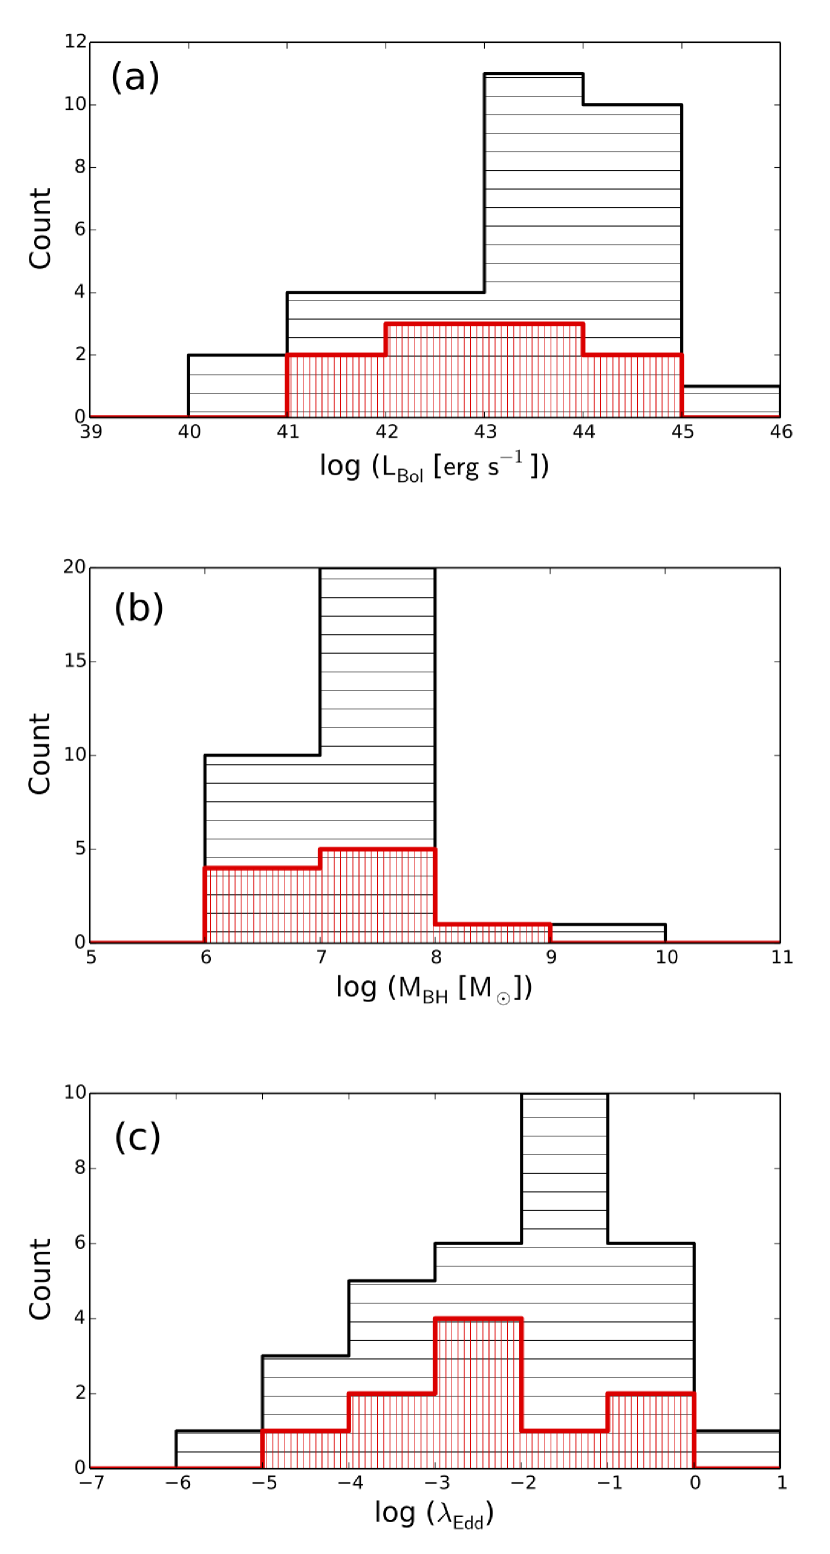
Figure 1 shows the distribution of the , , and of our sample AGNs. Here, denotes the Eddington ratio in the luminosity regime 777 = /, where [erg s-1] = 1.26 1038 [].. The logarithmic median values of (, , ) are (42.80, 7.14, -2.43) and (43.41, 7.42, -2.08) for the IT and SD samples, respectively. The resulting is distributed over a wide range: i.e., 5 orders of magnitude. This might suggest the limited applicability of Equation (3) for all of our samples under the fixed value of = 0.1, because it has been predicted that the accretion disk will change its state at (e.g., Abramowicz & Fragile 2013). We nevertheless stick to the current estimation of because the actual is not observationally constrained for low- objects.
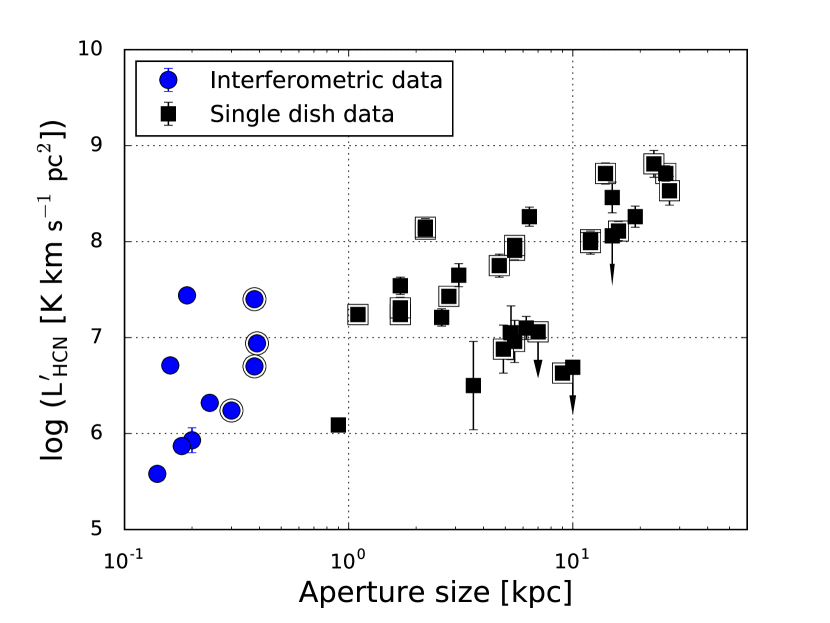
Based on these data, the SD sample seems to be slightly biased towards higher-luminosity objects than the IT sample, likely because there are few high-luminosity (or high ) AGNs in the very nearby universe (e.g., Mpc), where the CND could be spatially well separated from, for example, the surrounding starburst ring, at the HCN() emission line in past interferometric observations. However, we could not clearly reject the null hypothesis that both the IT and the SD samples are drawn from the same distribution. Indeed, the KolmogorovSmirnov (KS) test of the IT and SD distributions shown in Figure 1 returned marginal (or even high) -values, which were (0.33, 0.75, 0.75) for (, , ), respectively. Thus, admitting the poor statistics of the sample and taking the relatively large uncertainty for each parameter into account, we ignored any (possible) systematic difference in the intrinsic AGN properties between the two sample groups. In this way, the only difference between the two sample groups that influences our study is , which directly reflects the orders-of-magnitude different spatial scales for HCN() measurements (Figure 2): our whole sample exhibits a positive correlation between the spatial resolution and the HCN() line luminosity with a correlation coefficient of 0.71 (excluding the upper limits on ; see Section 3 for details of the correlation analysis).
| Target | Morphology | AGN type | log () | Ref. 1 | log () | Ref. 2 | log () | Ref. 3 | ||
| (1) | (2) | (3) | (4) | (5) | (6) | (7) | (8) | (9) | (10) | (11) |
| Interferometric data (IT-sample) | ||||||||||
| NGC 1068 | 16.3 | (R)SA(rs)b | 2 | 43.020.30 | (1) | 7.400.07 | 0.38 | (7) | 6.960.02 | (24), maser |
| NGC 1097 | 18.2 | SB(s)b | 1 | 40.840.30 | (2) | 6.710.06 | 0.16 | (8) | 8.150.10 | (25), gas |
| NGC 2273 | 26.4 | SB(r)a | 2 | 42.730.30 | (1) | 6.700.05 | 0.38♯ | (9) | 6.890.02 | (26), maser |
| NGC 3079 | 16.0 | SB(s)c edge-on | 2 | 42.020.30 | (1) | 6.940.04 | 0.39♯ | (10) | 7.900.63 | (27,28), |
| NGC 3227 | 16.6 | SAB(s)a pec | 1.5 | 42.070.30 | (2) | 6.320.08 | 0.24♯ | (9) | 7.180.30 | (29), stellar |
| NGC 4051 | 10.0 | SAB(rs)bc | 1.5 | 41.130.30 | (2) | 5.580.05 | 0.14♯ | (9) | 6.130.14 | (30), reverberation |
| NGC 4579 | 21.8 | SAB(rs)b | 1.5 | 41.330.30 | (2) | 5.930.13 | 0.20 | (11) | 7.760.45 | (27,28), |
| NGC 5033 | 12.5 | SA(s)c | 1.9 | 40.910.30 | (2) | 5.870.05 | 0.18♯ | (10) | 7.380.46 | (27,28), |
| NGC 6951 | 20.4 | SAB(rs)bc | 2 | -† | -† | 6.240.04 | 0.30♯ | (9) | 7.100.50 | (27,28), |
| NGC 7469 | 70.8 | (R’)SAB(rs)a | 1.2 | 43.170.30 | (2) | 7.440.04 | 0.19 | (12) | 6.970.05 | (30), reverberation |
| Single dish data (SD-sample) | ||||||||||
| Cen A | 7.8 | S0 pec | 2 | 41.900.30 | (3) | 7.240.07 | 1.1 | (13) | 7.650.04 | (31), gas |
| Circinus | 6.2 | SA(s)b | 2 | 42.620.30 | (1) | 7.240.07 | 1.7 | (14) | 6.230.08 | (32), maser |
| IRAS 05189-2524 | 188.2 | - | 2 | 44.200.30 | (4) | 8.710.08 | 26 | (15) | 7.420.40 | (27,28), |
| Mrk 273 | 166.5 | pec | 2 | 42.870.30 | (2) | 8.810.14 | 23 | (16) | 9.170.05 | (33), maser |
| Mrk 331 | 80.3 | Sa | 2? | 40.700.30 | (4) | 8.530.15 | 27 | (17) | 6.810.47 | (27,28), |
| NGC 34 | 85.3 | pec | 2 | 42.000.30 | (4) | 8.020.07 | 12 | (15) | 7.710.52 | (27,28), |
| NGC 660 | 12.2 | SB(s)a pec | 2 | 39.400.30 | (4) | 7.310.11 | 1.7 | (18) | 7.120.47 | (27,28), |
| NGC 931 | 72.2 | SAbc | 1 | 43.290.30 | (2) | 8.06 | 15 | (19) | 7.540.60 | (27,28), |
| NGC 1068 | 16.3 | (R)SA(rs)b | 2 | 43.020.30 | (1) | 8.130.02 | 2.2 | (20) | 6.960.02 | (24), maser |
| NGC 1097 | 18.2 | SB(s)b | 1 | 40.840.30 | (2) | 7.540.09 | 1.7 | (21) | 8.150.10 | (25), gas |
| NGC 1365 | 23.5 | SB(s)b | 1.8 | 42.250.30 | (2) | 8.260.10 | 6.4 | (19) | 7.500.51 | (27,28), |
| NGC 1667 | 65.7 | SAB(r)c | 2 | 42.370.30 | (5) | 8.710.11 | 14 | (19) | 7.820.45 | (27,28), |
| NGC 2273 | 26.4 | SB(r)a | 2 | 42.730.30 | (1) | 6.960.22 | 5.5 | (19) | 6.890.02 | (26), maser |
| NGC 3079 | 16.0 | SB(s)c edge-on | 2 | 42.020.30 | (1) | 7.910.10 | 5.5 | (17) | 7.900.63 | (27,28), |
| NGC 3147 | 40.3 | SA(rs)bc | 2 | 41.400.30 | (4) | 7.960.07 | 5.5 | (22) | 7.420.50 | (27,28), |
| NGC 4258 | 6.4 | SAB(s)bc | 1.9 | 40.570.30 | (2) | 6.090.04 | 0.9 | (16) | 7.560.03 | (34), maser |
| NGC 4388 | 36.3 | SA(s)b edge-on | 2 | 43.200.30 | (2) | 6.880.25 | 4.9 | (16) | 6.920.01 | (26), maser |
| NGC 4593 | 38.8 | (R)SB(rs)b | 1 | 42.800.30 | (2) | 7.050.28 | 5.3 | (16) | 6.890.09 | (30), reverberation |
| NGC 4945 | 8.6 | SB(s)cd edge-on | 2 | 42.220.30 | (6) | 8.150.09 | 2.2 | (23) | 6.460.03 | (35), maser |
| NGC 5005 | 13.5 | SAB(rs)bc | 2 | 40.020.30 | (2) | 7.750.12 | 4.7 | (17) | 7.840.45 | (27,28), |
| NGC 5033 | 12.5 | SA(s)c | 1.9 | 40.910.30 | (2) | 7.210.09 | 2.6 | (19) | 7.380.46 | (27,28), |
| NGC 5135 | 59.3 | SB(s)ab | 2 | 43.100.30 | (1) | 8.110.10 | 16 | (19) | 7.240.46 | (27,36), |
| NGC 5194 | 6.6 | SA(s)bc pec | 2 | 41.540.30 | (1) | 6.630.02 | 9.0 | (20) | 6.600.49 | (27,28), |
| NGC 5347 | 33.6 | (R’)SB(rs)ab | 2 | 42.390.30 | (1) | 7.06 | 7.0 | (19) | 6.730.55 | (27,28), |
| NGC 5506 | 26.6 | Sa pec edge-on | 1.9 | 43.010.30 | (2) | 6.500.46 | 3.6 | (16) | 7.870.49 | (27,28), |
| NGC 5548 | 74.5 | (R’)SA(s)0/a | 1.2 | 43.420.30 | (2) | 6.69 | 10 | (16) | 7.730.12 | (30), reverberation |
| NGC 6814 | 22.4 | SAB(rs)bc | 1.5 | 42.180.30 | (2) | 7.100.12 | 6.2 | (19) | 7.050.06 | (30), reverberation |
| NGC 6951 | 20.4 | SAB(rs)bc | 2 | -† | -† | 7.430.01 | 2.8 | (20) | 7.100.50 | (27,28), |
| NGC 7130 | 70.0 | Sa pec | 1.9 | 43.100.30 | (1) | 8.260.11 | 19 | (19) | 7.480.46 | (27,36), |
| NGC 7469 | 70.8 | (R’)SAB(rs)a | 1.2 | 43.170.30 | (2) | 8.460.16 | 15 | (19) | 6.970.05 | (30), reverberation |
| NGC 7479 | 34.2 | SB(s)c | 2 | 41.170.30 | (5) | 7.990.12 | 12 | (17) | 7.610.46 | (27,28), |
| NGC 7582 | 22.6 | (R’)SB(s)ab | 1 | 42.600.30 | (4) | 7.650.12 | 3.1 | (18) | 7.560.51 | (27,28), |
| Target | log () | log () |
|---|---|---|
| (1) | (2) | (3) |
| Interferometric data (IT-sample) | ||
| NGC 1068 | 8.400.31 | -1.550.42 |
| NGC 1097 | 7.710.30 | -4.100.42 |
| NGC 2273 | 7.700.30 | -1.910.42 |
| NGC 3079 | 7.940.30 | -2.760.42 |
| NGC 3227 | 7.320.31 | -2.700.42 |
| NGC 4051 | 6.580.30 | -3.780.42 |
| NGC 4579 | 6.930.33 | -3.560.42 |
| NGC 5033 | 6.870.30 | -4.020.42 |
| NGC 6951 | 7.240.30 | -3.290.42 |
| NGC 7469 | 8.440.30 | -1.360.42 |
| Single Dish data (SD-sample) | ||
| Cen A | 8.240.31 | -2.910.42 |
| Circinus | 8.240.31 | -2.050.42 |
| IRAS 05189-2524 | 9.710.31 | -0.030.42 |
| Mrk 273 | 10.270.32 | -1.740.42 |
| Mrk 331 | 9.530.34 | -4.250.42 |
| NGC 34 | 9.020.31 | -2.790.42 |
| NGC 660 | 8.310.32 | -5.590.42 |
| NGC 931 | 9.06 | -1.210.42 |
| NGC 1068 | 9.130.30 | -1.550.42 |
| NGC 1097 | 8.540.31 | -4.100.42 |
| NGC 1365 | 9.260.32 | -2.480.42 |
| NGC 1667 | 9.710.32 | -2.340.42 |
| NGC 2273 | 7.960.37 | -1.910.42 |
| NGC 3079 | 8.910.32 | -2.760.42 |
| NGC 3147 | 8.960.31 | -3.480.42 |
| NGC 4258 | 7.090.30 | -4.390.42 |
| NGC 4388 | 7.880.39 | -1.320.42 |
| NGC 4593 | 8.050.41 | -1.820.42 |
| NGC 4945 | 9.150.31 | -2.520.42 |
| NGC 5005 | 8.750.32 | -4.960.42 |
| NGC 5033 | 8.210.31 | -4.020.42 |
| NGC 5135 | 9.110.32 | -1.450.42 |
| NGC 5194 | 7.630.30 | -2.500.42 |
| NGC 5347 | 8.06 | -2.320.42 |
| NGC 5506 | 7.500.55 | -1.560.42 |
| NGC 5548 | 7.69 | -1.040.42 |
| NGC 6814 | 8.100.32 | -2.580.42 |
| NGC 6951 | 8.430.30 | -3.290.42 |
| NGC 7130 | 9.260.32 | -1.450.42 |
| NGC 7469 | 9.460.34 | -1.360.42 |
| NGC 7479 | 8.990.32 | -3.730.42 |
| NGC 7582 | 8.650.32 | -2.070.42 |
3. Regression analysis
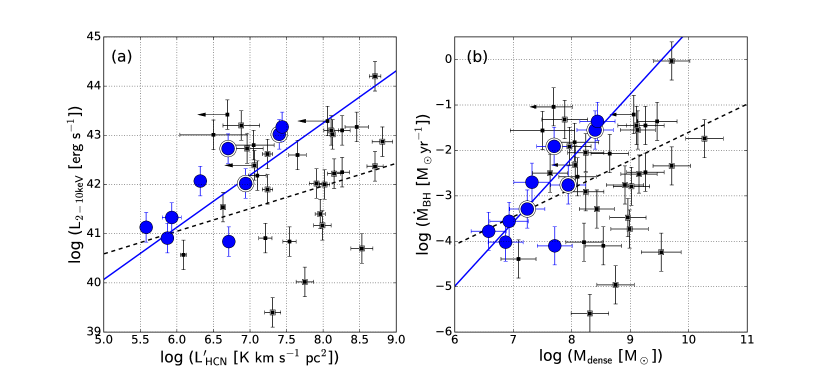
Figure 3 shows the observed scatter plots of the quantities in Tables 1 and 2, indicating the maximum number of data points currently available. Excluding those with upper limits, the median values of (, , , ) were (6.51, 42.02, 7.51, -3.03) and (7.75, 42.37, 8.75, -2.41) for the IT and SD samples, respectively, on a logarithmic scale. Regarding the IT sample, one might see a trend of positive correlations in both plots, indicating the importance of CNDs as an external driver of AGN activity. To study such a view quantitatively in more detail, we applied the linear regression method developed by Kelly (2007) for the two sets of variables: (, ) and (, ). Because we used the same and the fixed in Equation (3) for all sample galaxies, and the conversion factors from to (Marconi et al. 2004) are comparable in the luminosity range of our sample, these two sets produce virtually equivalent correlations. However, we should also note that any uncertainty in and the conversion from to were not taken into account, which could have influenced our results. Nevertheless, we argue that our work is an important step to better understand the physical link between the content of circumnuclear molecular gas and the AGN event. Further progress from the theoretical and the observational sides is required to refine these data.
The procedure for the analysis is available
from the IDL Astronomy User’s Library
888http://idlastro.gsfc.nasa.gov as linmix_err.
This is a Bayesian-based algorithm that can handle errors on both axes,
upper limits on the dependent variable, and the intrinsic scatter.
It also returns a linear correlation strength.
The assumed formula for the regression is
| (4) |
where , , and are the intercept, slope, and intrinsic scatter of a two-dimensional regression line for variables (, ), and labels each object. Here, is assumed to follow a Gaussian distribution with a mean zero and a constant variance of (we show values of as the intrinsic scatter). However, each measurement for the variable (, ) can be expressed as (, ), which have random measurement errors (, ). Thus, and .
The linmix_err procedure uses a Markov-chain Monte Carlo (MCMC) technique
to draw random parameter sets from the probability distributions constructed from the measured data:
i.e., it returns posterior parameter distributions.
In this work, we regard the posterior mode and the range
around it that encompasses the 68% fraction of the distribution
as our best-fit value and uncertainty for each regression parameter.
We used random draws returned by the MCMC sampler
with the Metropolis-Hastings algorithm.
Note that the linmix_err models the prior distribution of
the independent variable using a weighted mixture of -Gaussians.
Although Kelly (2007) recommended using
to be flexible enough for a wide variety of distributions,
we instead used , considering the small numbers of samples.
The canonical Spearman rank correlation coefficient and the corresponding
null-hypothesis probability were also derived with r_correlate in IDL
to simplify the results.
4. Results from regression analysis
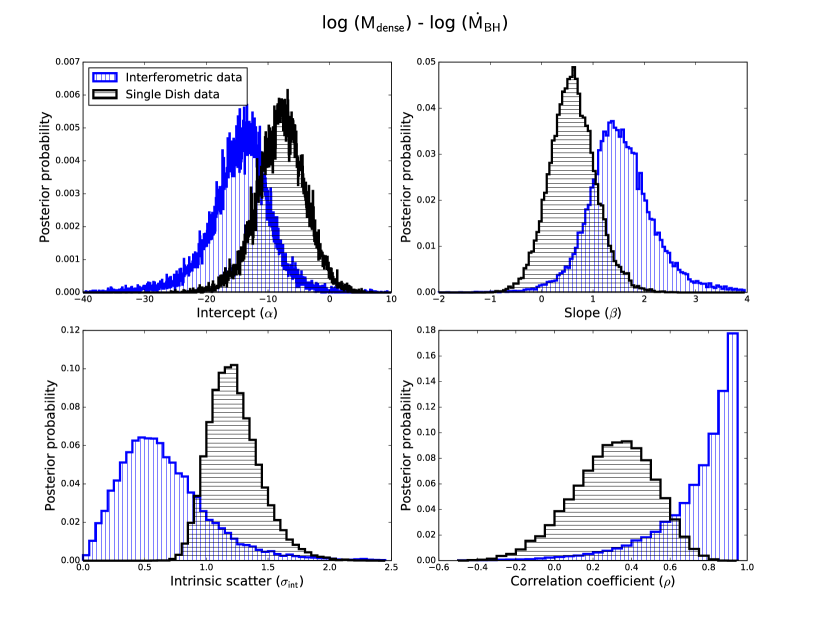
4.1. Positive correlation
Based on the method described in Section 3, we achieved the posterior distribution of each regression parameter defined in Equation (4). For example, Figure 4 shows the distributions for the correlation. The resulting best-fit parameters are summarized in Table 3 and the regression lines constructed with these values are overlaid on Figure 3 as the best-fit lines. We now focus on the correlation because it gives more physically meaningful information than the correlation, although both will yield the same conclusions. We confirmed a similar correlation in the flux-flux plane as well.
The estimated parameters for both the IT and SD samples have relatively
wide ranges, reflecting their limited statistics.
Nevertheless, there was a positive correlation between these two quantities,
particularly for the IT sample, as supported by the positive slope and the high correlation coefficient (0.77);
that is, the more gas, the more active the AGN.
Here, the canonical null-hypothesis probability returned by r_correlate (0.033)
also showed statistical significance at the 5% level.
Because is seemingly independent of (Collin & Kawaguchi 2004),
our results suggest the importance of CNDs as the external drivers of AGN activity.
4.2. Virtual equivalence to the correlations
To ignite and maintain AGN activity, a sufficient amount of molecular gas (= fuel) and the presence of physical mechanisms to cause mass accretion are required. The former condition is surely satisfied for our sample because the measured of the CND is enough to keep the current well beyond 100 Myr. Given the low ( yr-1) and the likely prevalence of dusty, compact structures in the central regions of Seyfert galaxies (Martini et al. 2003; Simões Lopes et al. 2007), indicating the coexistence of gaseous CNDs, as observed in our sample galaxies, then the first condition could be satisfied in most Seyfert galaxies as well.
However, measured circumnuclear (i.e., pc scale) SFRs tend to far exceed , by more than times, in Seyfert galaxies (e.g., Diamond-Stanic & Rieke 2012). This indicates that most of the dense gas in the CNDs would be consumed by such star formation. Even so, is massive enough to keep the current nuclear activity (i.e., ) over Myr so long as there is no massive outflow. From this perspective, we can state that the correlation in Figure 3 is virtually equivalent to the correlations (Diamond-Stanic & Rieke 2012; Esquej et al. 2014). Thus, our results support the existence of the correlation in an individual way. One advantage of using cold molecular measurements is that, today, we can achieve quite high resolutions with ALMA. This is essential in probing the CND scale of relatively distant galaxies. Moreover, less spectral contamination from an AGN itself is expected at millimeter/submillimeter bands than at optical/IR ones. Note that we can reproduce the slope of the correlations at the CND scale using that of the correlation and the linear conversion from to SFR (Gao & Solomon 2004b). We confirmed that this was not the case for the CO-derived molecular gas mass, which is also convertible to SFR (Kennicutt & Evans 2012). This supports the more appropriate use of the HCN() emission line to rebuild the correlation, as described in Section 1.1.
Our regression analysis also revealed that the correlation was tighter for the IT sample than the SD sample in a statistical sense (Figure 3, Table 3). That is, the IT sample showed a smaller scatter ( dex) and a higher correlation coefficient () than the SD sample ( and ), in the plane. This dependence again traces that of the correlations and indicates that CND-scale gas can be an external regulator of mass accretion further inward, whereas an entire galactic-scale does not.
| Data | Median aperture | ||||||
| (1) | (2) | (3) | (4) | (5) | (6) | (7) | (8) |
| correlation | |||||||
| IT-sample | 220 pc | 9 | 0.058 | ||||
| SD-sample | 5.5 kpc | 28 | 0.210 | ||||
| correlation | |||||||
| IT-sample | 220 pc | 10 | 0.77 | 0.033 | |||
| SD-sample | 5.5 kpc | 29 | 0.270 | ||||
5. Discussion
In the previous section, we showed that there is a positive and fairy strong correlation between and at CNDs, indicating that a more active AGN resides in a more gas-rich CND. However, as is also the case for the correlation, this result does not indicate the physical mechanism(s) of mass accretion at this spatial scale. Thus, here we try to speculate on accretion mechanisms (or the triggers of AGN activity) particularly from the perspective of the AGNstarburst connection. This could lead to important progress in the study of AGN fueling because accretion processes (even the dominant one) at pc scale remain unknown. Note that simple Eddington-limited accretion does not explain these Seyfert galaxies because the observed are well below unity (Figure 1).
To date, one of the most compelling pieces of evidence for a causal connection between AGN and (circumnuclear) starburst activities would be the observed Myr time delay between the onset of each activity (Davies et al. 2007; Schawinski et al. 2009; Wild et al. 2010). This supports the view that the preceding star formation event subsequently provides fuel for the AGN. With this in mind, we focused on the following scenario showing a direct connection between AGN and starburst: angular momentum loss due to SN-driven turbulence (Wada & Norman 2002; Kawakatu & Wada 2008; Wada et al. 2009). Note that there are other scenarios that also support a direct AGNstarburst connection, such as mass loss from evolved stars (Norman & Scoville 1988; Ciotti et al. 1991; Padovani & Matteucci 1993; Davies et al. 2007). Consequently, our discussion does not provide a comprehensive, complete view of CND-scale accretion. Rather, we seek to demonstrate one possible approach to tackle the fueling problem, which may be expanded much greater detail with future high-resolution, high-sensitivity observations provided by ALMA.
5.1. Angular momentum loss due to SN-driven turbulence
Type II SNe occur after a certain time delay from the onset of the starburst episode. That delay is Myr for a starburst event with a -folding time scale () of 10 Myr (Davies et al. 2007). The delay naturally becomes longer as increases. Indeed, along with large uncertainty, can be as long as Myr (e.g., Schawinski et al. 2009; Wild et al. 2010; Alonso-Herrero et al. 2013). Thus, SN-driven accretion may explain the observed Myr delay between the onsets of starbursts and AGNs.
According to the numerical simulations of Wada & Norman (2002) and Wada et al. (2009), SNe inject strong turbulence into a CND, which effectively removes the angular momentum of the gas and increases . From the observational side, a circumnuclear SFR is typically yr-1 (Diamond-Stanic & Rieke 2012) for the IT sample. Integrating the Salpeter initial mass function over a stellar mass range of yields a type II SN rate of SFR (Wada et al. 2009). Then, the current SN rate of the IT sample is yr-1. Because even a CND with a low SN rate ( yr-1) shows a highly turbulent motion in the numerical simulation (Wada et al. 2009), it would seem reasonable to expect turbulence-driven accretion to occur in the sample CNDs. Moreover, kinematic analysis of the H2 S(1) emission line clearly revealed that CNDs are highly turbulent, with a velocity dispersion of km s-1 (Hicks et al. 2009).
Then we applied an analytical form of the SN-driven accretion model developed by Kawakatu & Wada (2008) to our observations. A typical is a few in this model (see also Kawakatu & Wada 2009), which is consistent with the observations. Based on the viscous accretion model (Pringle 1981), they derived a mass accretion rate expected at the innermost radius () of a CND as
| (5) |
In this model, the turbulent pressure is assumed to be in hydrodynamical equilibrium with gravity in the vertical direction. The so-called viscous-alpha parameter was invoked to express the viscous coefficient as , where and are the turbulent velocity and the scale height of the disk at radius from the center. is the total energy injected by a single SN (i.e., 1051 erg), and is the heating efficiency per unit mass that bridges and the kinetic energy of the matter. This energy input from SNe is balanced with dissipation due to the turbulence. , , and are the star-formation efficiency (), the gas surface-density of the disk999We use the subscript dense considering the high densities of the CNDs., and the gravitational constant, respectively.
Regarding the dependence of Equation (5) on each parameter, we emphasize the following two points that match observations well.
-
•
H2 surface brightness: Recent VLT integral field unit observations of the 2.12 m H2 S(1) emission line revealed that CNDs of active galaxies show systematically higher H2 surface brightness than those of inactive galaxies (Hicks et al. 2013). If we assume enhanced H2 is a reflection of gas mass, this is consistent with the form of .
-
•
Black hole mass: From Tables 1 and 2, we found NGC 1097 and NGC 2273 have comparable , whereas their are totally different, i.e., NGC 1097 shows a times smaller value. However, NGC 1097 has a times larger than NGC 2273. Thus, we expect that including in a negative form into like would better reproduce the trend in . This is indeed the proposed formulation of .
These points provided our motivation to apply Equation (5) to the actual observations. The negative dependence on indicates that a suppressed scale height of the disk, due to strong gravity from the SMBH itself, reduced the turbulent viscosity inside the disk, and accordingly. We also note that Equation (5) does not necessarily disagree with the results of Collin & Kawaguchi (2004), who claimed that black hole mass accretion seemed to be independent of , because we now include not only but also as controlling parameters of mass accretion.
One might question whether ongoing star formation can have a direct link with the ongoing AGN activity in terms of the time scale. According to Kawakatu & Wada (2008), the viscous time scale from the radius of the CND () can be determined by the viscous coefficient as
| (6) |
Putting pc, ( pc) = 50 km s-1, ( pc) = 30 pc (these are typically observed values in H2 S(1) disks; Hicks et al. 2009) and , we obtain Myr, which is comparable to the dynamical time. However, using the free-fall time from the radius to the center (), the viscous time scale inside the accretion disk is
| (7) |
where denotes the viscous alpha-parameter in the accretion disk (Shakura & Sunyaev 1973; Pringle 1981). We consider the accretion disk with pc (typical size of water maser disks; Kuo et al. 2011) around the SMBH with . Recent numerical simulations reported due to magneto-rotational instability in the disk (e.g., Machida & Matsumoto 2003). Thus, putting and (typical value assumed in standard disk models) in Equation (7), we obtain Myr. Consequently, we suggest that the total accretion time scale from the CND to the center is at most a few Myr. This is smaller than the typical ( Myr, Schawinski et al. 2009; Wild et al. 2010; Alonso-Herrero et al. 2013). Therefore, it does seem to be plausible for CNDs and the star formation that occurs inside them to have a causal link with on-going AGN activities.
5.1.1 Comparison with observations
Next we compared the model-predicted accretion rates with the observed values. We restricted the analysis to the IT sample only, because galactic-scale molecular gas would have no relevance to current AGN activity, as we saw in Section 4. Again, we note that this discussion is rather speculative with large uncertainties, and should be tested with larger samples based on future observations. One important issue is that most of the CNDs are not resolved spatially at the HCN() emission line, so we cannot measure directly. Thus, we simply assume that the dense gas is uniformly distributed within a CND and then reduce Equation (5) to
| (8) |
Here, the model-simulated fiducial values of and are used (Wada & Norman 2002).
Regarding the outer radii () of disks, we assume that they are identical to the HWHM of the H2 S(1) emission disks (Hicks et al. 2009). The values are listed in Table 4 after correcting the distance to each object. A basis of this assumption is the fact that a 100 pc scale spatial distributions of the H2 S(1) emission line and those of the CO and HCN emission lines are almost identical in NGC 1068 (Müller Sánchez et al. 2009; García-Burillo et al. 2014) and in NGC 1097 (Hicks et al. 2009; Kohno et al. in prep.). With this constraint, we will focus on the IT sample with the high-resolution H2 S(1) kinematic information in Hicks et al. (2009), specifically, NGC 1097, NGC 3227, NGC 4051, and NGC 7469, in the following analysis. Note that we excluded NGC 1068 from this specific investigation because the innermost regions of its CND show considerably complex substructures that are likely reflecting strong AGN feedback events (Hicks et al. 2009), which violates our assumption of the uniform gas distribution inside a CND.
For the disk inner radius (), Kawakatu & Wada (2008) simply defined it as the dust sublimation radius, which we believe has limited meaning. Because we are now trying to apply the SN-driven turbulence model, star formation must occur prior to SN explosions. However, we would not expect star formation in the gas disk with a temperature as high as, for example, K. Alternatively, we consider two other radii. The first is the radius at which the fractional abundance () of H2 becomes equivalent to that of HI, i.e., (H2) = (HI). We argue this because stars are born from molecular gas. In close vicinity to AGNs, strong X-ray irradiation can substantially alter gas physics and chemistry (the X-ray dominated region = XDR; Lepp & Dalgarno 1996; Maloney et al. 1996). Thus, we calculate this radius (denoted as ) following Equation (2) of Maloney et al. (1996). According to their calculation, we can estimate as the radius at which the ratio of X-ray energy deposition rate per particle takes . Note that in the region with , the gas temperature is K. A gas volume density of cm-3 (here, we regard ) is adopted based on a recent high-resolution multi-transitional study towards the center of NGC 1068 (Viti et al. 2014), although another value in the range of cm-3 would not change our argument. The X-ray luminosity in Table 1 was used here to derive , listed in Table 4. However, even if molecular hydrogen exists, stars cannot be formed unless the gas becomes gravitationally unstable. Thus, we estimated the radius at which the Toomre-Q parameter (e.g., Toomre 1964) became unity, i.e.,
| (9) |
where is the epicyclic frequency, ( km s-1) is the sound speed, and is the gravitational constant. The spatially averaged gas surface density was used. The radius in Table 4 was derived in this way. Using these two radii, we regard the effective innermost radius as .
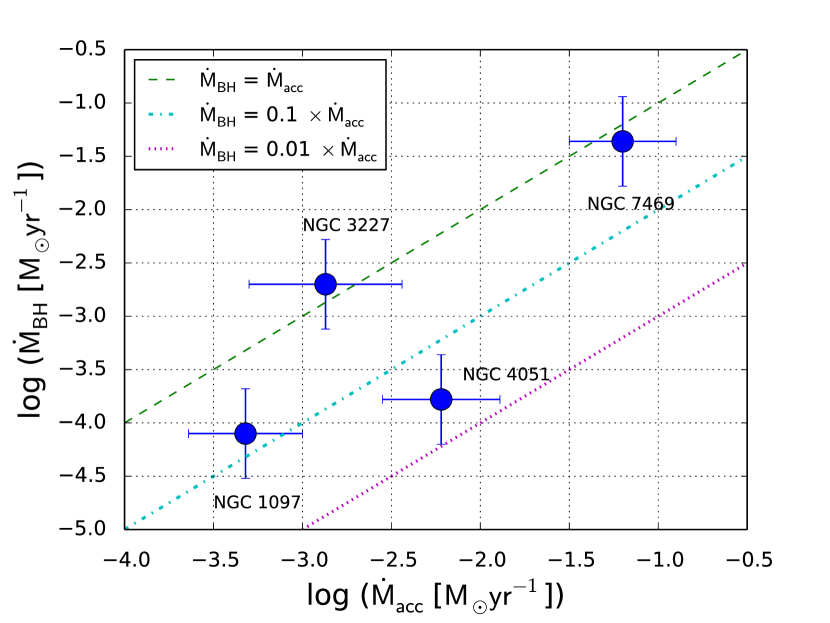
To obtain , we used SFR measured with a comparable aperture to that of the HCN() measurements, as . This SFR was estimated with the 11.3 m PAH emission (Diamond-Stanic & Rieke 2012; Esquej et al. 2014). Because of the mechanism invoked by the model, we consider that there is no star formation inside .
Following the above, we estimated with Equation (8), as tabulated in Table 4. The uncertainty was assumed to be primarily driven by that of for simplicity, because that of the other parameters is not well constrained. Note that this is now an accretion rate at . Figure 5 compares the resulting with the observed . According to this SN-driven accretion model, one can find in NGC 7469 and NGC 3227, indicating that most of the mass accreted from their goes to black hole accretion. In contrast to these objects, was only or less of in NGC 1097 and NGC 4051, respectively. Thus, only a small fraction of the accreting gas from the CND contributed to growing the SMBH in these galaxies. In the latter case, we need some other process(es) to account for the missing mass flows.
| Target | SFR/aperture | Ref. | Ref. | ||||||
|---|---|---|---|---|---|---|---|---|---|
| (1) | (2) | (3) | (4) | (5) | (6) | (7) | (8) | (9) | (10) |
| NGC 1097 | 28.8 | 0.38 | 2.1 | 0.14/250 | 1 | 2.710-9 | -3.320.32 | - | - |
| NGC 3227 | 34.9 | 0.95 | 2.0 | 0.07/60 | 2 | 3.410-9 | -2.870.43 | - | - |
| NGC 4051 | 7.6 | 0.46 | 0.43 | 0.11/140 | 1 | 2.910-8 | -2.220.33 | -2.39 | 3,4 |
| NGC 7469 | 30.8 | 2.2 | 0.84 | 1.19/260 | 2 | 6.010-9 | -1.200.30 | -1.22 | 5 |
5.1.2 Other components of the mass budgetgaseous outflow
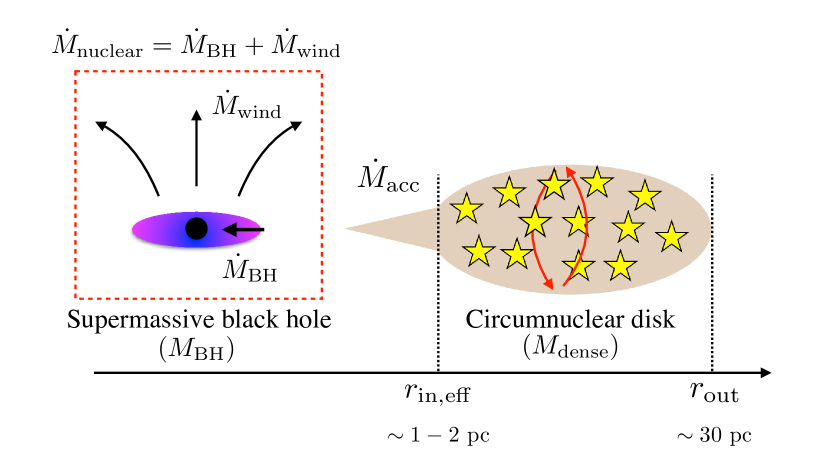
In a more realistic situation, we suggest in general. Indeed, this view is true because the accreted mass from the CND can be expelled in other ways, such as nuclear winds (e.g., Genzel et al. 2010). Such winds may compensate for the discrepancy between and in NGC 1097 and NGC 4051. In this scenario, if the mass flow at the accretion disk scale can be solely ascribed to either black hole accretion () or the winds (), the following relation should hold:
| (10) |
This situation is described schematically in Figure 6.
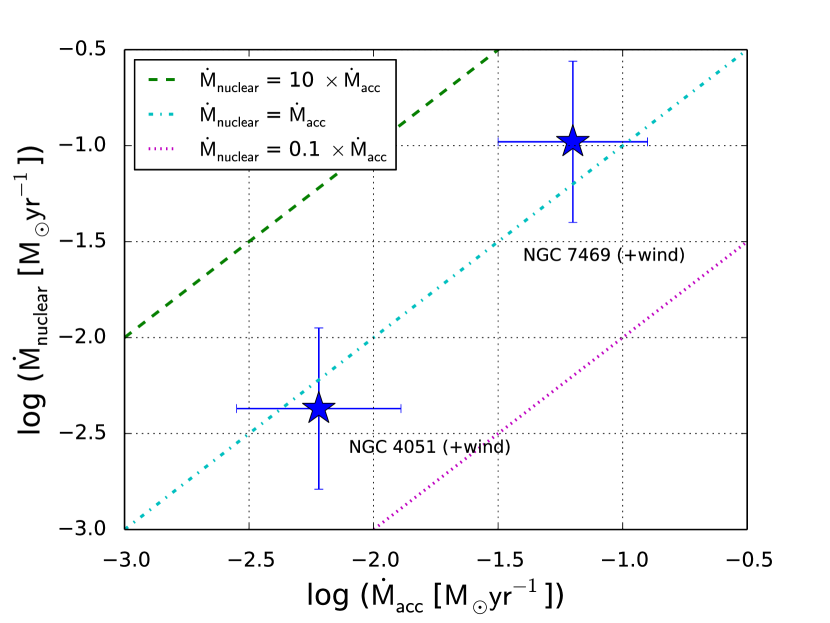
Unfortunately, is available only for NGC 7469 and NGC 4051 (Table 4) in the literature. Here, we considered the winds observed as X-ray/UV warm absorbers because these components are highly likely to be located in close vicinity to the accretion disks. However, AGN winds observed in atomic or molecular lines would be emanating from regions far outside the broad-line region (i.e., the narrow-line region), of which are substantially mass-loaded by the surrounding ISM. Finally, we compare with in Figure 7. Only the uncertainty of is shown here because that of is not clearly stated in the references. However, we note that the uncertainty of may be substantially large because it critically depends on the currently unconstrained nuclear geometry and volume filling factor of the outflowing gas. That aside, it is remarkable that both NGC 7469 and NGC 4051 show good agreement of (Figure 7). Note that NGC 7469 already showed , i.e., is not so prominent compared to for this object.
Based on these results, it seems that we are likely describing the balance of mass flows at the nuclear regions of Seyfert galaxies (Equation (10)). However, our results are tentative due to the small sample size, and are based on simplified assumptions. Moreover, not all of the expected uncertainties are included in Figures 5 and 7. Thus, high-resolution observations of dense molecular gas with ALMA to measure directly, and for example, high-sensitivity UV/X-ray spectroscopy to measure , are needed to further improve our understanding of circumnuclear mass accretion processes, including other mechanisms beyond this SN-driven accretion model.
5.2. Implications for the evolution of AGNs
As shown in Equations (5) and (8), in the SN-driven accretion model depends negatively on , i.e., . This is a totally different dependence from those assumed in Eddington-limited accretion ( ) and Bondi accretion (). Because of this dependence, for a given (or ), it becomes more difficult for an SMBH to grow as its becomes larger. Observationally, the growth factor of in the coming Myr is at most , considering the low currently observed, unless massive inflows occur from the host galaxies into the CNDs to forcibly enhance . Because the total lifetime of AGNs would be yr (e.g., Marconi et al. 2004), most of the SMBH accretion would have occurred in the distant past, at the early epoch of their evolution, when was surely satisfied. Kawaguchi et al. (2004) claimed that most growth of SMBHs occurred in the super-Eddington phase when they were young, whereas the growth rate in the sub-Eddington phase is modest. Such super-Eddington accretion can be allowed in this SN-driven model, for example, for an SMBH with embedded in a CND of , judging from Equation (8).
However, it is highly challenging to form SMBHs with typically found in local elliptical galaxies (e.g., Kormendy & Ho 2013) and high redshift quasars even at (e.g., Mortlock et al. 2011) with this SN-driven accretion. If such black holes accumulated their mass within yr (Marconi et al. 2004), the average mass accretion rate would be yr-1. Even if we assume a quite high , such as yr-1, which is an upper value observed in submillimeter galaxies (Solomon & Vanden Bout 2005), molecular gas should be accumulated in the CND within 109 yr and should remain there for almost over the entire period of SMBH growth. This mass is comparable to the total (i.e., galactic scale) amount of dense molecular gas observed in high redshift quasars (e.g., Wang et al. 2011) as well as nearby galaxies (see the case of the SD sample in Figure 3b). This, in turn, indicates the difficulty forming high mass-end SMBHs because it is highly unlikely for a galaxy to confine all of its molecular gas inside the CND (central 100 pc).
Regarding lower-mass SMBHs, by assuming of the total dense molecular gas of the galaxy is in the CND, it would be possible to form an SMBH with , based on the same speculation described above. Black holes in this mass range ( ) could have been formed following a downsizing trend (Ueda et al. 2003, 2014) because high-redshift galaxies tend to show higher (Solomon & Vanden Bout 2005), which controls . To make high mass-end SMBHs ( ), we need some other mechanism(s), such as mergers of black holes or long-lasting mass inflows from intragalactic space.
6. Conclusions
Motivated by the correlation, (e.g., Diamond-Stanic & Rieke 2012; Esquej et al. 2014), we investigated the correlation between the mass of dense molecular gas () traced by the HCN() emission line and the black hole mass accretion rate () in nearby Seyfert galaxies, with a Bayesian-based regression analysis. Most of the data were compiled from the literature and/or the ALMA archive. Because of the high spatial resolution provided by the interferometers (PdBI, NMA, and ALMA), we could probe molecular gas at the CND-scale. Our main conclusions are summarized as follows.
-
•
There is a positive correlation between and at the CND-scale. Because dense molecular gas is the site of star formation, this correlation is virtually equivalent to the (nuclear) correlations found so far. Thus, it seems that we succeeded in rebuilding the correlations individually from the perspective of cold molecular gas observations.
-
•
The correlation is significantly tighter for the sample where the HCN() emission line was measured at the CND scale (IT sample; median aperture = 220 pc) than for the sample measured at the galactic scale (SD sample; median aperture = 5.5 kpc). This is again consistent with the trend found in the correlations, suggesting that CND-scale molecular gas plays an important role in fueling AGNs, whereas the galactic-scale molecular gas does not.
-
•
Assuming that star formation in CNDs directly provides fuel for AGNs, we adopted an SN-driven turbulent accretion scenario (Kawakatu & Wada 2008). Although there are still large observational uncertainties in the parameters needed for the model (and not all of the uncertainties are explicitly addressed in this study), direct comparisons of the model-predicted (= mass accretion rate at the innermost radius of the CND to further inwards) with were conducted. We found that only a partial fraction (from to ) of was converted into in general.
-
•
On the other hand, we also found good agreement between = (mass outflow rate as nuclear winds) and model-predicted in NGC 4051 and NGC 7469. This result would suggest that we now might be describing the balance of mass flow in the nuclear regions of these Seyfert galaxies, although this view is based on the tentative and simplified assumptions in this work. We suggest that high-resolution observations of dense molecular gas with ALMA to accurately measure , as well as, for example, high-sensitivity spectroscopic observations of nuclear winds in the UV/X-ray bands are needed to better understand the validity of this SN-driven accretion model.
Because we used the SN-driven accretion model as a demonstration of one possible approach for studying CND-scale accretion processes in the ALMA era, we should, of course, test other models (e.g., mass-loss from evolved stars) quantitatively by increasing the number of high-resolution measurements of CND-scale dense gas.
References
- Abramowicz & Fragile (2013) Abramowicz, M. A., & Fragile, P. C. 2013, Living Reviews in Relativity, 16, 1
- Alexander & Hickox (2012) Alexander, D. M., & Hickox, R. C. 2012, New A Rev., 56, 93
- Alonso-Herrero et al. (2013) Alonso-Herrero, A., Pereira-Santaella, M., Rieke, G. H., et al. 2013, ApJ, 765, 78
- Antonucci (1993) Antonucci, R. 1993, ARA&A, 31, 473
- Baan et al. (2008) Baan, W. A., Henkel, C., Loenen, A. F., Baudry, A., & Wiklind, T. 2008, A&A, 477, 747
- Ballantyne (2008) Ballantyne, D. R. 2008, ApJ, 685, 787
- Barnes & Hernquist (1992) Barnes, J. E., & Hernquist, L. 1992, ARA&A, 30, 705
- Bentz & Katz (2015) Bentz, M. C., & Katz, S. 2015, PASP, 127, 67
- Blustin et al. (2007) Blustin, A. J., Kriss, G. A., Holczer, T., et al. 2007, A&A, 466, 107
- Brightman & Nandra (2011) Brightman, M., & Nandra, K. 2011, MNRAS, 413, 1206
- Cheung et al. (2015) Cheung, E., Trump, J. R., Athanassoula, E., et al. 2015, MNRAS, 447, 506
- Cid Fernandes et al. (2004) Cid Fernandes, R., Gu, Q., Melnick, J., et al. 2004, MNRAS, 355, 273
- Ciotti et al. (1991) Ciotti, L., D’Ercole, A., Pellegrini, S., & Renzini, A. 1991, ApJ, 376, 380
- Cisternas et al. (2015) Cisternas, M., Sheth, K., Salvato, M., et al. 2015, ApJ, 802, 137
- Cisternas et al. (2011) Cisternas, M., Jahnke, K., Inskip, K. J., et al. 2011, ApJ, 726, 57
- Collin & Kawaguchi (2004) Collin, S., & Kawaguchi, T. 2004, A&A, 426, 797
- Combes et al. (2014) Combes, F., García-Burillo, S., Casasola, V., et al. 2014, A&A, 565, A97
- Curran et al. (2000) Curran, S. J., Aalto, S., & Booth, R. S. 2000, A&AS, 141, 193
- Curran et al. (2001) Curran, S. J., Johansson, L. E. B., Bergman, P., Heikkilä, A., & Aalto, S. 2001, A&A, 367, 457
- Davies et al. (2012) Davies, R., Mark, D., & Sternberg, A. 2012, A&A, 537, A133
- Davies et al. (2007) Davies, R. I., Müller Sánchez, F., Genzel, R., et al. 2007, ApJ, 671, 1388
- Davies et al. (2006) Davies, R. I., Thomas, J., Genzel, R., et al. 2006, ApJ, 646, 754
- de Rosa et al. (2012) de Rosa, A., Panessa, F., Bassani, L., et al. 2012, MNRAS, 420, 2087
- Diamond-Stanic & Rieke (2012) Diamond-Stanic, A. M., & Rieke, G. H. 2012, ApJ, 746, 168
- Diamond-Stanic et al. (2009) Diamond-Stanic, A. M., Rieke, G. H., & Rigby, J. R. 2009, ApJ, 698, 623
- Esquej et al. (2014) Esquej, P., Alonso-Herrero, A., González-Martín, O., et al. 2014, ApJ, 780, 86
- Ferrarese & Merritt (2000) Ferrarese, L., & Merritt, D. 2000, ApJ, 539, L9
- Gabor et al. (2009) Gabor, J. M., Impey, C. D., Jahnke, K., et al. 2009, ApJ, 691, 705
- Gao & Solomon (2004a) Gao, Y., & Solomon, P. M. 2004a, ApJS, 152, 63
- Gao & Solomon (2004b) —. 2004b, ApJ, 606, 271
- García-Burillo et al. (2008) García-Burillo, S., Combes, F., Usero, A., & Graciá-Carpio, J. 2008, Journal of Physics Conference Series, 131, 012031
- García-Burillo et al. (2014) García-Burillo, S., Combes, F., Usero, A., et al. 2014, A&A, 567, A125
- Garcia-Rissmann et al. (2005) Garcia-Rissmann, A., Vega, L. R., Asari, N. V., et al. 2005, MNRAS, 359, 765
- Genzel et al. (2010) Genzel, R., Eisenhauer, F., & Gillessen, S. 2010, Reviews of Modern Physics, 82, 3121
- Greenhill et al. (1997) Greenhill, L. J., Moran, J. M., & Herrnstein, J. R. 1997, ApJ, 481, L23
- Greenhill et al. (2003) Greenhill, L. J., Booth, R. S., Ellingsen, S. P., et al. 2003, ApJ, 590, 162
- Grier et al. (2013) Grier, C. J., Martini, P., Watson, L. C., et al. 2013, ApJ, 773, 90
- Gültekin et al. (2009) Gültekin, K., Richstone, D. O., Gebhardt, K., et al. 2009, ApJ, 698, 198
- Heckman et al. (1995) Heckman, T., Krolik, J., Meurer, G., et al. 1995, ApJ, 452, 549
- Hicks et al. (2013) Hicks, E. K. S., Davies, R. I., Maciejewski, W., et al. 2013, ApJ, 768, 107
- Hicks et al. (2009) Hicks, E. K. S., Davies, R. I., Malkan, M. A., et al. 2009, ApJ, 696, 448
- Ho (2008) Ho, L. C. 2008, ARA&A, 46, 475
- Hobbs et al. (2011) Hobbs, A., Nayakshin, S., Power, C., & King, A. 2011, MNRAS, 413, 2633
- Honma et al. (1995) Honma, M., Sofue, Y., & Arimoto, N. 1995, A&A, 304, 1
- Hopkins (2012) Hopkins, P. F. 2012, MNRAS, 420, L8
- Hopkins & Hernquist (2006) Hopkins, P. F., & Hernquist, L. 2006, ApJS, 166, 1
- Hopkins & Hernquist (2009) —. 2009, ApJ, 694, 599
- Hopkins et al. (2008) Hopkins, P. F., Hernquist, L., Cox, T. J., & Kereš, D. 2008, ApJS, 175, 356
- Hopkins & Quataert (2010) Hopkins, P. F., & Quataert, E. 2010, MNRAS, 407, 1529
- Hunt & Malkan (2004) Hunt, L. K., & Malkan, M. A. 2004, ApJ, 616, 707
- Imanishi & Wada (2004) Imanishi, M., & Wada, K. 2004, ApJ, 617, 214
- Izumi et al. (2013) Izumi, T., Kohno, K., Martín, S., et al. 2013, PASJ, 65, 100
- Izumi et al. (2015) Izumi, T., Kohno, K., Aalto, S., et al. 2015, ApJ, 811, 39
- Izumi et al. (2016) —. 2016, ApJ, 818, 42
- Jiang et al. (2011) Jiang, X., Wang, J., & Gu, Q. 2011, MNRAS, 418, 1753
- Jogee (2006) Jogee, S. 2006, in Lecture Notes in Physics, Berlin Springer Verlag, Vol. 693, Physics of Active Galactic Nuclei at all Scales, ed. D. Alloin, 143
- Kamenetzky et al. (2014) Kamenetzky, J., Rangwala, N., Glenn, J., Maloney, P. R., & Conley, A. 2014, ApJ, 795, 174
- Kaviraj (2014) Kaviraj, S. 2014, MNRAS, 440, 2944
- Kawaguchi et al. (2004) Kawaguchi, T., Aoki, K., Ohta, K., & Collin, S. 2004, A&A, 420, L23
- Kawakatu & Wada (2008) Kawakatu, N., & Wada, K. 2008, ApJ, 681, 73
- Kawakatu & Wada (2009) —. 2009, ApJ, 706, 676
- Kelly (2007) Kelly, B. C. 2007, ApJ, 665, 1489
- Kennicutt & Evans (2012) Kennicutt, R. C., & Evans, N. J. 2012, ARA&A, 50, 531
- Klöckner & Baan (2004) Klöckner, H.-R., & Baan, W. A. 2004, A&A, 419, 887
- Kohno (2005) Kohno, K. 2005, in American Institute of Physics Conference Series, Vol. 783, The Evolution of Starbursts, ed. S. Hüttmeister, E. Manthey, D. Bomans, & K. Weis, 203–208
- Kohno et al. (2003) Kohno, K., Ishizuki, S., Matsushita, S., Vila-Vilaró, B., & Kawabe, R. 2003, PASJ, 55, L1
- Kohno et al. (2008) Kohno, K., Nakanishi, K., Tosaki, T., et al. 2008, Ap&SS, 313, 279
- Kormendy & Ho (2013) Kormendy, J., & Ho, L. C. 2013, ARA&A, 51, 511
- Kormendy & Kennicutt (2004) Kormendy, J., & Kennicutt, Jr., R. C. 2004, ARA&A, 42, 603
- Kraemer et al. (2012) Kraemer, S. B., Crenshaw, D. M., Dunn, J. P., et al. 2012, ApJ, 751, 84
- Krips et al. (2008) Krips, M., Neri, R., García-Burillo, S., et al. 2008, ApJ, 677, 262
- Krips et al. (2007) —. 2007, A&A, 468, L63
- Krongold et al. (2007) Krongold, Y., Nicastro, F., Elvis, M., et al. 2007, ApJ, 659, 1022
- Kuo et al. (2011) Kuo, C. Y., Braatz, J. A., Condon, J. J., et al. 2011, ApJ, 727, 20
- Lepp & Dalgarno (1996) Lepp, S., & Dalgarno, A. 1996, A&A, 306, L21
- Lin et al. (2016) Lin, M.-Y., Davies, R. I., Burtscher, L., et al. 2016, MNRAS, 458, 1375
- Liu et al. (2014) Liu, T., Wang, J.-X., Yang, H., Zhu, F.-F., & Zhou, Y.-Y. 2014, ApJ, 783, 106
- Lodato & Bertin (2003) Lodato, G., & Bertin, G. 2003, A&A, 398, 517
- Lutz et al. (2004) Lutz, D., Maiolino, R., Spoon, H. W. W., & Moorwood, A. F. M. 2004, A&A, 418, 465
- Machida & Matsumoto (2003) Machida, M., & Matsumoto, R. 2003, ApJ, 585, 429
- Magorrian et al. (1998) Magorrian, J., Tremaine, S., Richstone, D., et al. 1998, AJ, 115, 2285
- Maiolino & Rieke (1995) Maiolino, R., & Rieke, G. H. 1995, ApJ, 454, 95
- Makarov et al. (2014) Makarov, D., Prugniel, P., Terekhova, N., Courtois, H., & Vauglin, I. 2014, A&A, 570, A13
- Maloney et al. (1996) Maloney, P. R., Hollenbach, D. J., & Tielens, A. G. G. M. 1996, ApJ, 466, 561
- Marconi & Hunt (2003) Marconi, A., & Hunt, L. K. 2003, ApJ, 589, L21
- Marconi et al. (2004) Marconi, A., Risaliti, G., Gilli, R., et al. 2004, MNRAS, 351, 169
- Marinucci et al. (2012) Marinucci, A., Bianchi, S., Nicastro, F., Matt, G., & Goulding, A. D. 2012, ApJ, 748, 130
- Martín et al. (2015) Martín, S., Kohno, K., Izumi, T., et al. 2015, A&A, 573, A116
- Martini et al. (2003) Martini, P., Regan, M. W., Mulchaey, J. S., & Pogge, R. W. 2003, ApJ, 589, 774
- Matsushita et al. (2015) Matsushita, S., Trung, D.-V., Boone, F., et al. 2015, ApJ, 799, 26
- McMullin et al. (2007) McMullin, J. P., Waters, B., Schiebel, D., Young, W., & Golap, K. 2007, in Astronomical Society of the Pacific Conference Series, Vol. 376, Astronomical Data Analysis Software and Systems XVI, ed. R. A. Shaw, F. Hill, & D. J. Bell, 127
- Mihos & Hernquist (1994) Mihos, J. C., & Hernquist, L. 1994, ApJ, 425, L13
- Miyoshi et al. (1995) Miyoshi, M., Moran, J., Herrnstein, J., et al. 1995, Nature, 373, 127
- Monje et al. (2011) Monje, R. R., Blain, A. W., & Phillips, T. G. 2011, ApJS, 195, 23
- Mortlock et al. (2011) Mortlock, D. J., Warren, S. J., Venemans, B. P., et al. 2011, Nature, 474, 616
- Mulchaey & Regan (1997) Mulchaey, J. S., & Regan, M. W. 1997, ApJ, 482, L135
- Müller Sánchez et al. (2009) Müller Sánchez, F., Davies, R. I., Genzel, R., et al. 2009, ApJ, 691, 749
- Narayan & Yi (1995) Narayan, R., & Yi, I. 1995, ApJ, 452, 710
- Neumayer (2010) Neumayer, N. 2010, PASA, 27, 449
- Norman & Scoville (1988) Norman, C., & Scoville, N. 1988, ApJ, 332, 124
- Onishi et al. (2015) Onishi, K., Iguchi, S., Sheth, K., & Kohno, K. 2015, ApJ, 806, 39
- Padovani & Matteucci (1993) Padovani, P., & Matteucci, F. 1993, ApJ, 416, 26
- Panessa et al. (2006) Panessa, F., Bassani, L., Cappi, M., et al. 2006, A&A, 455, 173
- Papadopoulos et al. (2012) Papadopoulos, P. P., van der Werf, P., Xilouris, E., Isaak, K. G., & Gao, Y. 2012, ApJ, 751, 10
- Petry & CASA Development Team (2012) Petry, D., & CASA Development Team. 2012, in Astronomical Society of the Pacific Conference Series, Vol. 461, Astronomical Data Analysis Software and Systems XXI, ed. P. Ballester, D. Egret, & N. P. F. Lorente, 849
- Pringle (1981) Pringle, J. E. 1981, ARA&A, 19, 137
- Privon et al. (2015) Privon, G. C., Herrero-Illana, R., Evans, A. S., et al. 2015, ApJ, 814, 39
- Rigby et al. (2009) Rigby, J. R., Diamond-Stanic, A. M., & Aniano, G. 2009, ApJ, 700, 1878
- Rocca-Volmerange et al. (2015) Rocca-Volmerange, B., Drouart, G., & De Breuck, C. 2015, ApJ, 803, L8
- Sakamoto et al. (1999) Sakamoto, K., Okumura, S. K., Ishizuki, S., & Scoville, N. Z. 1999, ApJ, 525, 691
- Sandage & Tammann (1987) Sandage, A., & Tammann, G. A. 1987, A revised Shapley-Ames Catalog of Bright Galaxies (2nd ed.; Washington, DC: Carnegie Institution of Washington Publication)
- Sani et al. (2012) Sani, E., Davies, R. I., Sternberg, A., et al. 2012, MNRAS, 424, 1963
- Sault et al. (1995) Sault, R. J., Teuben, P. J., & Wright, M. C. H. 1995, in Astronomical Society of the Pacific Conference Series, Vol. 77, Astronomical Data Analysis Software and Systems IV, ed. R. A. Shaw, H. E. Payne, & J. J. E. Hayes, 433
- Schawinski et al. (2009) Schawinski, K., Virani, S., Simmons, B., et al. 2009, ApJ, 692, L19
- Shakura & Sunyaev (1973) Shakura, N. I., & Sunyaev, R. A. 1973, A&A, 24, 337
- Sheth et al. (2005) Sheth, K., Vogel, S. N., Regan, M. W., Thornley, M. D., & Teuben, P. J. 2005, ApJ, 632, 217
- Shlosman et al. (1990) Shlosman, I., Begelman, M. C., & Frank, J. 1990, Nature, 345, 679
- Simões Lopes et al. (2007) Simões Lopes, R. D., Storchi-Bergmann, T., de Fátima Saraiva, M., & Martini, P. 2007, ApJ, 655, 718
- Solomon et al. (1992a) Solomon, P. M., Downes, D., & Radford, S. J. E. 1992a, ApJ, 387, L55
- Solomon et al. (1992b) —. 1992b, ApJ, 398, L29
- Solomon et al. (1990) Solomon, P. M., Radford, S. J. E., & Downes, D. 1990, ApJ, 348, L53
- Solomon & Vanden Bout (2005) Solomon, P. M., & Vanden Bout, P. A. 2005, ARA&A, 43, 677
- Taniguchi (1999) Taniguchi, Y. 1999, ApJ, 524, 65
- Thompson et al. (2005) Thompson, T. A., Quataert, E., & Murray, N. 2005, ApJ, 630, 167
- Toomre (1964) Toomre, A. 1964, ApJ, 139, 1217
- Treister et al. (2012) Treister, E., Schawinski, K., Urry, C. M., & Simmons, B. D. 2012, ApJ, 758, L39
- Tremaine et al. (2002) Tremaine, S., Gebhardt, K., Bender, R., et al. 2002, ApJ, 574, 740
- Ueda et al. (2014) Ueda, Y., Akiyama, M., Hasinger, G., Miyaji, T., & Watson, M. G. 2014, ApJ, 786, 104
- Ueda et al. (2003) Ueda, Y., Akiyama, M., Ohta, K., & Miyaji, T. 2003, ApJ, 598, 886
- Urry & Padovani (1995) Urry, C. M., & Padovani, P. 1995, PASP, 107, 803
- Viti et al. (2014) Viti, S., García-Burillo, S., Fuente, A., et al. 2014, A&A, 570, A28
- Vollmer et al. (2008) Vollmer, B., Beckert, T., & Davies, R. I. 2008, A&A, 491, 441
- Wada & Norman (2002) Wada, K., & Norman, C. A. 2002, ApJ, 566, L21
- Wada et al. (2009) Wada, K., Papadopoulos, P. P., & Spaans, M. 2009, ApJ, 702, 63
- Wang et al. (2004) Wang, M., Henkel, C., Chin, Y.-N., et al. 2004, A&A, 422, 883
- Wang et al. (2011) Wang, R., Wagg, J., Carilli, C. L., et al. 2011, ApJ, 739, L34
- Wild et al. (2010) Wild, V., Heckman, T., & Charlot, S. 2010, MNRAS, 405, 933
- Wild & Eckart (2000) Wild, W., & Eckart, A. 2000, A&A, 359, 483
- Wu et al. (2005) Wu, J., Evans, II, N. J., Gao, Y., et al. 2005, ApJ, 635, L173
- Yamada (1994) Yamada, T. 1994, ApJ, 423, L27
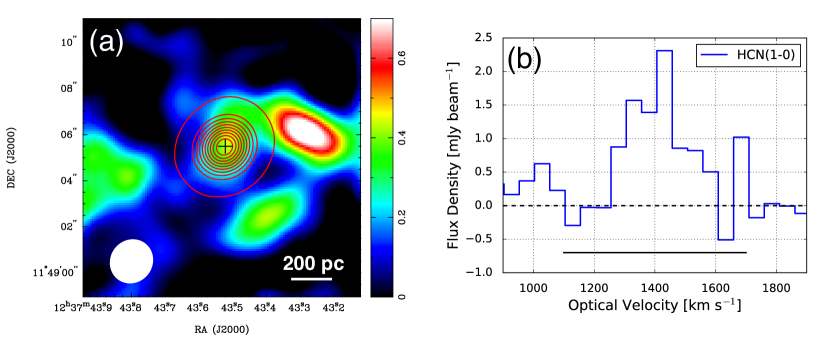
Appendix A A. Archival data of NGC 4579
NGC 4579 (luminosity distance = 21.7 Mpc) was observed with ALMA on 2014 April 25 with 37 antennas as a Cycle 1 early science program (ID = 2012.1.00456.S, PI = E. Murphy). Baseline lengths range from 16.4 m to 558.2 m. The observations were conducted in a single pointing with a 60′′ field of view, which fully covered the nuclear region of this galaxy. The phase tracking center was set to (, ) = (12h37m43.6s, +11∘49′02.0′′). The HCN( emission line was covered in the lower side band (LSB), whereas the upper side band (USB) was used to improve the sensitivity to the underlying continuum emission. Both side bands in total covered 7.5 GHz width. The velocity spacing was originally 1.65 km s-1 (488.281 kHz), but we binned 30 channels to achieve 50 km s-1 resolution to improve the signal to noise ratio. The bandpass, phase, and absolute flux were calibrated with J1229+0203, J1239+0730, and Ceres, respectively. The total on-source time was 0.2 hr and the typical system temperature was 50 K.
The reduction and calibration of the data were conducted with CASA version 4.2 (McMullin et al. 2007; Petry & CASA Development Team 2012) in standard manners.
The raw visibility data was extracted from the ALMA archive101010https://almascience.nao.ac.jp/alma-data/archive.
The HCN() data cube was reconstructed with the CASA task CLEAN
(gain = 0.1, threshold = 0.5 mJy, weighting = natural).
The achieved synthesized beam was 1′′.96 1′′.83 (207 pc 193 pc) with P.A. = 37.75∘.
The rms noise in the channel map was 0.70 mJy beam-1 after the primary beam correction,
which was measured at the areas free of line emission but close to the line emitting regions.
The underlying continuum emission ( GHz; synthesized beam was 1′′.89 1′′.68, P.A. = 43.39∘)
was subtracted in the plane before making the line map.
The rms noise in this continuum map was 0.20 mJy beam-1.
We further analyzed this line cube with MIRIAD (Sault et al. 1995).
Figure 8 shows the integrated intensity map of HCN()
(we used the MIRIAD task MOMENT to make this map without any clipping) and its spectrum extracted at the nucleus.
The moment-0 value at the nucleus (0.4370.126 Jy beam-1 km s-1) was used to derive and in this work.