The MOSDEF Survey: Detection of [O iii]4363 and the direct-method oxygen abundance of a star-forming galaxy at **affiliation: Based on data obtained at the W.M. Keck Observatory, which is operated as a scientific partnership among the California Institute of Technology, the University of California, and NASA, and was made possible by the generous financial support of the W.M. Keck Foundation.
Abstract
We present measurements of the electron-temperature based oxygen abundance for a highly star-forming galaxy at , COSMOS-1908. This is the highest redshift at which [O iii]4363 has been detected, and the first time that this line has been measured at . We estimate an oxygen abundance of 12+log(O/H). This galaxy is a low-mass ( ), highly star-forming ( yr-1) system that hosts a young stellar population ( Myr). We investigate the physical conditions of the ionized gas in COSMOS-1908 and find that this galaxy has a high ionization parameter, little nebular reddening (), and a high electron density ( cm-3). We compare the ratios of strong oxygen, neon, and hydrogen lines to the direct-method oxygen abundance for COSMOS-1908 and additional star-forming galaxies at with [O iii]4363 measurements, and show that galaxies at follow the same strong-line correlations as galaxies in the local universe. This agreement suggests that the relationship between ionization parameter and O/H is similar for and high-redshift galaxies. These results imply that metallicity calibrations based on lines of oxygen, neon, and hydrogen do not strongly evolve with redshift and can reliably estimate abundances out to , paving the way for robust measurements of the evolution of the mass-metallicity relation to high redshift.
Subject headings:
galaxies: evolution — galaxies: ISM — galaxies: high-redshift1. Introduction
The gas-phase metallicity of a galaxy is intimately connected to the processes governing galaxy formation and growth, namely the fueling and regulation of star formation. This connection is observed as the mass-metallicity relation (MZR), a correlation between stellar mass () and gas-phase oxygen abundance for local star-forming galaxies (e.g., Tremonti et al., 2004; Andrews & Martini, 2013). The MZR exists for high-redshift galaxies as well, and is observed to shift toward lower metallicity at fixed out to (e.g., Erb et al., 2006; Troncoso et al., 2014; Sanders et al., 2015; Onodera et al., 2016). Constraining the evolution of the shape and normalization of the MZR with redshift provides insight into how the interplay among star formation, gas accretion, and feedback changes over cosmic history. This approach requires robust estimates of the gas-phase metallicity at all epochs.
The ratio of the flux of the auroral [O iii]4363 line to that of [O iii]4959,5007 is sensitive to the electron temperature of the ionized gas. Based on estimates of the electron temperature and density, the oxygen abundance can be inferred from ratios of strong oxygen lines (e.g., [O iii]4959,5007 and [O ii]3727) to Balmer lines. Measurements of [O iii]4363 have now been obtained for several hundred local H ii regions and galaxies (e.g., Izotov et al., 2006; Marino et al., 2013). However, the direct electron-temperature based method cannot be applied to the majority of local galaxies with spectroscopic observations because [O iii]4363 is typically times weaker than [O iii]5007 at low metallicity, and much weaker still at solar and higher abundances. For this reason, calibrations to determine metallicity from strong optical emission-line ratios have been constructed based on observations of H ii regions and galaxies with direct metallicity measurements (e.g., Pettini & Pagel, 2004; Pilyugin & Thuan, 2005).
Strong-line calibrations have been widely applied at both low and high redshifts, but it is uncertain whether these local calibrations can accurately predict the metallicities of high-redshift galaxies. There is evidence that the physical conditions of the interstellar medium (ISM) in high-redshift galaxies differ from those observed locally. In order to explain offsets between and high-redshift galaxies in diagnostic plots such as the [O iii]/H vs. [N ii]/H diagram, it has been proposed that high-redshift galaxies may have higher ionization parameters (Kewley et al., 2015; Cullen et al., 2016), harder ionizing stellar spectra (Steidel et al., 2014), higher density/ISM pressure (Kewley et al., 2013; Sanders et al., 2016), and/or anomalous nitrogen abundance at fixed O/H (Masters et al., 2014; Shapley et al., 2015; Sanders et al., 2016) compared to galaxies. Depending on which conditions evolve and the magnitude of that evolution, the relation between emission-line ratios and metallicity may change with redshift, potentially rendering current strong-line calibrations significantly biased at high redshifts.
Unbiased metallicity estimates for high-redshift galaxies based on the direct method are needed to evaluate the applicability of local metallicity calibrations at high redshift. However, due to the weakness of [O iii]4363 and the difficulties of observing in the near-infrared, this line has only been detected in 7 galaxies at (Yuan & Kewley, 2009; Brammer et al., 2012; Christensen et al., 2012; Stark et al., 2013; James et al., 2014; Maseda et al., 2014), most of which are gravitationally lensed, and has not been detected at . The small, inhomogeneous sample of direct-method metallicities at has made it difficult to assess the state of metallicity calibrations at high redshifts.
In this letter, we present observations of COSMOS-1908, an unlensed star-forming galaxy at with a detection of [O iii]4363, observed as part of the MOSFIRE Deep Evolution Field (MOSDEF) survey (Kriek et al., 2015). We investigate the physical conditions of nebular gas in COSMOS-1908, considering multiple emission lines to evaluate the utility of locally-calibrated strong-line metallicity relations at . In Section 2, we present details about the observations and data reduction. We describe measurements of the spectral features in Section 3. In Section 4, we derive galaxy and ionized gas properies of COSMOS-1908. Finally, we discuss the implications of our results in Section 5. Throughout this paper, the term “metallicity” refers to the gas-phase oxygen abundance (12+log(O/H)). We adopt a -CDM cosmology with km s-1 Mpc-1, , and .
2. Observations and Reduction
We utilized data from the MOSDEF survey, described in detail in Kriek et al. (2015). The data were obtained on 23 December 2012 and 1 April 2013 using the MOSFIRE spectrograph (McLean et al., 2012) on the 10 m Keck I telescope. COSMOS-1908 was observed in H and K bands on a MOSFIRE mask with 07 wide slits, resulting in spectral resolutions of and in H and K, respectively. Individual exposures were 120 seconds in H and 180 seconds in K. The mask was observed for 72 minutes in H and 144 minutes in K using an ABBA dither pattern with a 12 nod in December, and 64 minutes in H using an ABA’B’ dither pattern with 15 and 12 outer and inner nods in April. The total integration time was 136 minutes in H and 144 minutes in K.
The data were reduced using a custom IDL pipeline that produces a two-dimensional science and error spectrum for each slit on the mask that has been flatfielded, sky-subtracted, cleaned of cosmic rays, wavelength-calibrated, and flux-calibrated (Kriek et al., 2015). One-dimensional science and error spectra were optimally extracted from the two-dimensional spectra. Science spectra were corrected for slit losses on an individual basis using Hubble Space Telescope F160W images and the average seeing for each filter. Emission-line fluxes were measured by fitting Gaussian profiles to the one-dimensional science spectrum. Uncertainties on line fluxes and all derived and measured quantities were estimated using a Monte Carlo technique, where the uncertainty bounds were taken to be the 16th and 84th percentile of the cumulative distribution function for each value.
In addition to our MOSFIRE observations, we utilized extensive multiwavelength photometric data that are available in the COSMOS field. COSMOS-1908 has coverage in 44 broad-, medium-, and intermediate-band filters from optical to infrared (rest-UV to rest-NIR), assembled by the 3D-HST team (Skelton et al., 2014; Momcheva et al., 2015).
3. The detection of auroral [O iii]4363
Deep observations with MOSFIRE allow us to identify several emission lines in the H- and K-band spectra of COSMOS-1908, presented in Figure 1. We measure a nebular redshift of using the best-fit centroid of [O iii]5007, the line with the highest signal-to-noise ratio (S/N). In addition to the strong rest-optical lines [O iii], H, and [O ii]3726,3729, there are many weak emission lines detected in the H band. These include [Ne iii]3869, [Ne iii]3968 blended with H, H, H, and [O iii]4363. The observed emission-line fluxes and uncertainties are presented in Table 1. COSMOS-1908 displays a high level of excitation and ionization based on the strength of [Ne iii] and the large [O iii]5007 flux compared to that of H and [O ii].
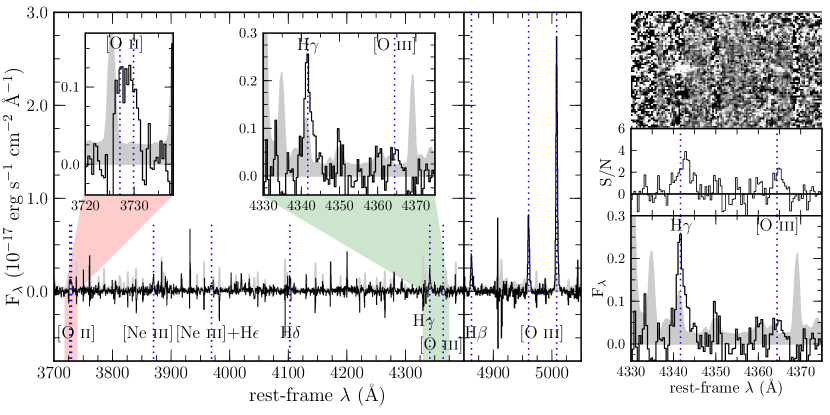
The auroral [O iii]4363 line is detected with a formal signifiance of 4.0. The redshift of COSMOS-1908 fortuitously places [O iii]4363 in a wavelength region that is free of skylines. The centroid of [O iii]4363 implies a redshift () that closely matches the one measured from stronger lines. Additionally, emission can be seen at the expected location of [O iii]4363 in the two-dimensional spectrum (Fig. 1, right), and the S/N spectrum shows a coherent peak centered at the expected location of the line, where 7 consecutive pixels have S/N. We conclude that [O iii]4363 is real and significantly detected, making COSMOS-1908 the highest-redshift galaxy for which [O iii]4363 has been detected.
| Observed emission-line fluxes | ||
|---|---|---|
| Line | Flux | Uncertainty |
| ( ) | ( ) | |
| [O ii]3726 | 1.09 | 0.19 |
| [O ii]3729 | 1.09 | 0.18 |
| [Ne iii]3869 | 1.84 | 0.21 |
| H | 1.49 | 0.32 |
| H | 2.21 | 0.34 |
| [O iii]4363 | 0.56 | 0.14 |
| H | 4.72 | 0.25 |
| [O iii]4959 | 10.8 | 0.28 |
| [O iii]5007 | 33.3 | 0.70 |
| Galaxy properties | ||
| Property | Value | |
| Right Ascension (J2000) | 10h 00m 23.36s | |
| Declination (J2000) | ||
| 3.0768 | ||
| log(/M⊙) | ||
| SFR (M⊙ yr-1) | ||
| sSFR (Gyr-1) | ||
| Area (kpc2) | ||
| (M⊙ yr-1 kpc) | ||
| (cm-3) | ||
| ([O iii]) (K) | ||
| ([O ii]) (K) | ||
| 12+log(O+/H+) | ||
| 12+log(O++/H+) | ||
| 12+log(O/H) | ||
4. Properties of COSMOS-1908
4.1. The stellar content of COSMOS-1908
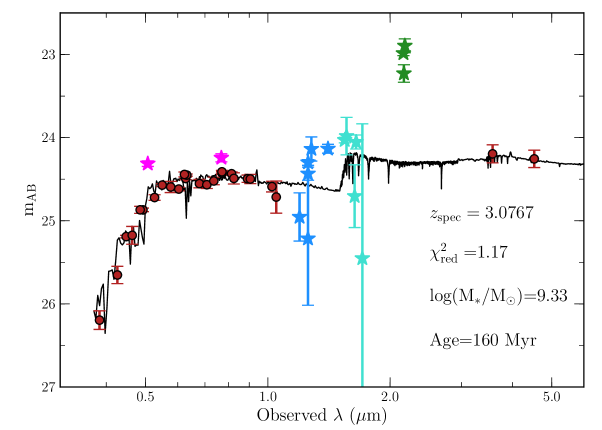
We estimate the stellar mass of COSMOS-1908 via spectral energy distribution (SED) fitting. The photometry is shown in Figure 2. There is a clear excess in the K-band photometry due to emission-line flux from [O iii]+H on top of the stellar continuum, as well as a probable excess in the H-band from weaker lines. For this reason, we exclude the H- and K-band photometric points when fitting the SED. The intermediate-band photometry at 5050 Å and 7670 Å were also excluded from the fit because of contributions from strong Ly and C iii]1909 emission, respectively. COSMOS-1908 additionally displays excess flux bluewards of the Balmer break in the J-band, which may be due to nebular continuum emission indicatave of a young stellar population (Reines et al., 2010). Since our models are not tuned to fit nebular continuum emission, we exclude the J-band photometry as well. The remaining photometry was fit using the SED-fitting code FAST (Kriek et al., 2009), with the Conroy et al. (2009) stellar population synthesis models, assuming a Chabrier (2003) initial mass function, a delayed- star-formation history (), and the Calzetti et al. (2000) attenuation curve. We assume a stellar metallicity of 0.16 Z⊙, the closest metallicity in the library of models to the measured gas-phase metallicity for COSMOS-1908 (see Section 4.5). The photometry and best-fit SED model are shown in the left panel of Figure 2. The best-fit age of the stellar population is Myr with an e-folding time of Gyr, indicating a rising star-formation history. The extinction of the stellar continuum in the best-fit model is . The stellar mass is found to be log(/). Fitting including H- and K-band photometry that have been corrected for emission-line contamination using measured line fluxes changes by , age by Myr, and stellar mass by dex.
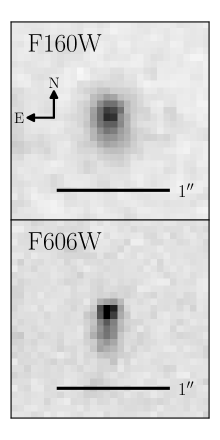
The right panel of Figure 2 shows HST postage stamp images of COSMOS-1908 in the F160W (rest-optical) and F606W (rest-UV) filters. The galaxy displays a compact morphology that is slightly elongated towards the south. Using the F606W image, we measure a rest-UV area of 4.4 kpc2 from the number of pixels that are 2 or more above the background noise. It is unlikely that COSMOS-1908 is dominated by ionization from an active galactic nucleus (AGN) due to its low stellar mass and the lack of a strong brightness peak in the central region.
4.2. Nebular extinction and star-formation rate
The reddening of nebular emission lines can significantly affect the inferred star-formation rate (SFR), line ratios, and derived metallicities. The amount of nebular extinction can be estimated using ratios of hydrogen Balmer-series lines. Balmer-series line fluxes are first corrected for stellar absorption using the best-fit SED model. Due to the strength of the emission lines, this correction is small, only 0.7%, 2%, and 3.5% for H, H, and H, respectively. Nebular reddening is estimated using Balmer-series line ratios, assuming intrinsic ratios of H/H and H/H (Osterbrock & Ferland, 2006) and the extinction curve of Cardelli et al. (1989). The observed Balmer ratios of COSMOS-1908 are consistent with no reddening; , an upper limit that is consistent within the uncertainties with the stellar reddening. The SFR is estimated from H using the relation of Kennicutt (1998) converted to a Chabrier (2003) IMF, assuming an intrinsic ratio of H/H=2.847 (Osterbrock & Ferland, 2006). COSMOS-1908 is vigorously forming stars, with SFR yr-1, specific SFR (sSFR; SFR/) of Gyr-1, and SFR surface density (; SFR/Area) of yr-1 kpc. The galaxy properties of COSMOS-1908 are presented in Table 1.
4.3. [O iii]5007 equivalent width
We measure a large [O iii]5007 rest-frame equivalent width of EW([O iii])=1600 Å using the continuum level from the best-fit SED model. Objects with EW([O iii] Å are extremely rare at (Atek et al., 2011), but appear to be common at (Smit et al., 2014). Observing an object with such a high EW in the small survey volume of the MOSDEF observations suggests a significant increase in the occurrence rate of high-EW galaxies from to . Analysis of objects like COSMOS-1908 can provide insight into the nature of star-forming galaxies with similar nebular EWs. COSMOS-1908 displays similar properties to the Lyman-continuum leaking galaxy Ion2 at (de Barros et al., 2016), including EW([O iii] Å and [O iii]5007/[O ii], and may be a good candidate for Lyman-continuum detection.
4.4. Electron density
The electron density serves as a robust proxy for the hydrogen gas density in H ii regions and can affect the strength of collisionally-excited lines. We calculate the electron density using the [O ii]3729/3726 ratio (roughly unity) and the IRAF routine nebular.temden (Shaw & Dufour, 1994) with updated O ii atomic data following Sanders et al. (2016). We assume an electron temperature of 12,800 K, the estimated ([O ii]) for COSMOS-1908 (see Section 4.5). We find the electron density to be cm-3. This high electron density compared to those of local star-forming galaxies and H ii regions is in agreement with the order-of-magnitude increase in electron density from to observed in Sanders et al. (2016).
4.5. Electron temperature and oxygen abundance
We estimate the oxygen abundance following the prescription of Izotov et al. (2006). The relative population of oxygen in ionization states higher than O++ is assumed to be negligible, such that the total oxygen abundance is
| (1) |
The analytic equations of Izotov et al. (2006) for and require knowledge of the electron density, electron temperatures in the O+ and O++ zones, and dust-corrected emission-line fluxes for [O ii], H, and [O iii].
We calculate ([O iii]) using nebular.temden with updated O iii collision strengths from Storey et al. (2014) and transition probabilities from the NIST MCHF database (Fischer & Tachiev, 2014). In the density regime cm-3, is insensitive to changes in density, so we do not iteratively solve for and simultaneously. For COSMOS-1908, we find [O iii]4959,5007/, which corresponds to an electron temperature in the O++ zone of ([O iii])=14,000 K. We do not have wavelength coverage of the auroral [O ii] lines to determine ([O ii]) directly. Instead, we assume the linear ([O iii])([O ii]) relation of Campbell et al. (1986). We find an electron temperature in the O+ zone of ([O ii])=12,800 K. The total oxygen abundance of COSMOS-1908 is found to be 12+log(O/H) (0.2 Z⊙; Asplund et al., 2009). The oxygen abundance, ionic abundances, electron temperatures, and density are listed in Table 1.
5. Discussion
We investigate the evolution in the relationship between emission-line ratios and metallicity by comparing COSMOS-1908 to galaxies at lower redshifts with abundance determinations based on [O iii]4363. Recently, Jones et al. (2015) found that relations between direct-method oxygen abundance and ratios of neon, oxygen, and hydrogen emission lines do not evolve from , using a sample of 32 star-forming galaxies at from the DEEP2 Galaxy Redshift Survey (Newman et al., 2013). We perform a similar comparison using galaxies at higher redshifts. The low-redshift comparison sample includes the galaxies from Jones et al. (2015) and 126 star-forming galaxies at from Izotov et al. (2006) that have spectral coverage of [O ii]. We additionally compare to three galaxies at (Christensen et al., 2012; James et al., 2014; Stark et al., 2013, Mainali et al., in prep.). All galaxies in the comparison samples have detections of [O iii]4363, and reddening corrections and oxygen abundances recalculated with the methods described in Section 4. Uncertainties on emission-line ratios are calculated using a Monte Carlo technique, and include uncertainties in measurement and reddening correction.
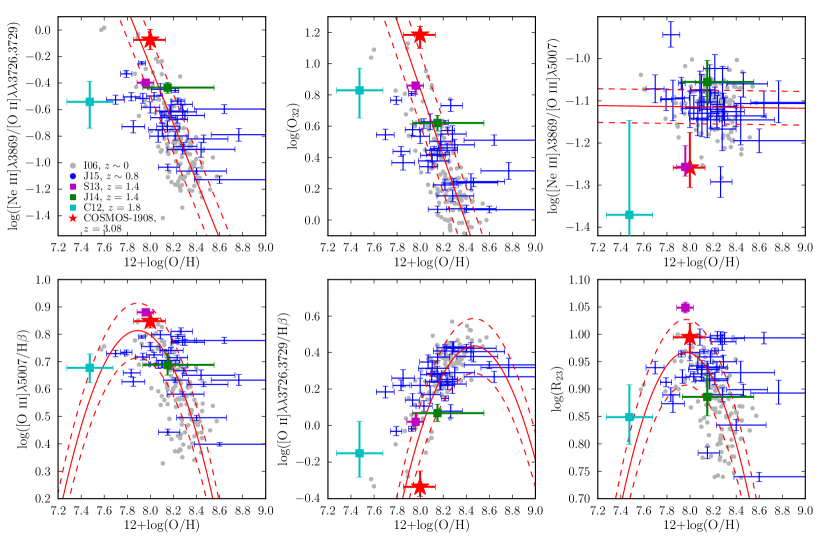
The emission-line ratios and oxygen abundances are shown in Figure 3. The line ratios displayed in each panel are sensitive to O/H, with the exception of [Ne iii]/[O iii], which should remain approximately constant with metallicity because it is a ratio of similar ionization states of -capture elements. In all 5 panels with metallicity-sensitive line ratios, COSMOS-1908 is consistent with the local best-fit relations within the uncertainties and instrinsic scatter. There are few galaxies in the low-redshift comparison samples that have the levels of low-metallicity and high-excitation that COSMOS-1908 displays, so this result relies on a small level of extrapolation of the relations. Of the four galaxies at , COSMOS-1908 lies slightly towards the high-excitation side of the local relations, the Stark et al. (2013) and James et al. (2014) galaxies fall very nearly on each local relation, and the Christensen et al. (2012) galaxy lies towards the low-excitation side. Collectively, galaxies at do not show a systematic offset towards higher excitation at fixed metallicity, and the relation between these line ratios and O/H does not strongly evolve.
The close proximity of COSMOS-1908 to the local relations implies that evolution of the ionization parameter or ionizing spectrum at fixed O/H is small, if present. It has been suggested that high-redshift galaxies may have higher ionization parameters than local galaxies because of a scaling up of the radiation field due to more concentrated star formation (Kewley et al., 2015; Cullen et al., 2016; Kashino et al., 2016). This scenario predicts that COSMOS-1908 should have a much higher ionization parameter than local galaxies at similar O/H due to its extreme sSFR and , which would be observed as large offsets in [O iii]/[O ii], [O iii]/H, and [Ne iii]/[O ii] at fixed O/H. The models presented in Cullen et al. (2016) predict that [O iii]/H at fixed metallicity will be dex larger at due to an increase in ionization parameter at fixed O/H. Such offsets are not observed in Figure 3.
Our results instead suggest a scenario in which high-redshift and galaxies have similar ionization parameters at fixed metallicity, while high-redshift galaxies have higher ionization parameters than local galaxies at fixed due to the evolution of the MZR. This scenario is consistent with our earlier findings in Sanders et al. (2016) using a sample of star-forming galaxies at from the MOSDEF survey. The properties of COSMOS-1908 and the and comparison samples suggest that the same relationship between metallicity and ionization parameter holds out to . Since changes in electron density minimally affect line ratios at subsolar metallicities (Sanders et al., 2016), the agreement of the high- and low-redshift samples in Figure 3 implies that strong-line metallicity calibrations using only lines of oxygen, neon, and hydrogen can reliably predict abundances from to .
Currently, these results are based upon a handful of galaxies at , which is not sufficient to statistically constrain the behavior of the entire galaxy population at high redshifts. More detections of [O iii]4363 for high-redshift galaxies are required to gain a complete understanding of the behavior of metallicity indicators at . One way forward is selecting objects similar to COSMOS-1908 from photometric surveys by identifying objects with large excess flux in the photometric band covering [O iii]4959,5007, suggestive of a large [O iii] equivalent width and low metallicity. Such objects are good candidates for [O iii]4363 detection in deep spectroscopic observations. Detections of weak features such as [O iii]4363 for large samples at high redshift will be enabled by the next-generation near-infrared facilities such as the James Webb Space Telescope and Thirty Meter Telescope.
References
- Andrews & Martini (2013) Andrews, B. H., & Martini, P. 2013, ApJ, 765, 140
- Asplund et al. (2009) Asplund, M., Grevesse, N., Sauval, A. J., & Scott, P. 2009, ARA&A, 47, 481
- Atek et al. (2011) Atek, H., Siana, B., Scarlata, C., et al. 2011, ApJ, 743, 121
- Brammer et al. (2012) Brammer, G. B., Sánchez-Janssen, R., Labbé, I., et al. 2012, ApJ, 758, L17
- Calzetti et al. (2000) Calzetti, D., Armus, L., Bohlin, R. C., et al. 2000, ApJ, 533, 682
- Campbell et al. (1986) Campbell, A., Terlevich, R., & Melnick, J. 1986, MNRAS, 223, 811
- Cardelli et al. (1989) Cardelli, J. A., Clayton, G. C., & Mathis, J. S. 1989, ApJ, 345, 245
- Chabrier (2003) Chabrier, G. 2003, PASP, 115, 763
- Christensen et al. (2012) Christensen, L., Laursen, P., Richard, J., et al. 2012, MNRAS, 427, 1973
- Conroy et al. (2009) Conroy, C., Gunn, J. E., & White, M. 2009, ApJ, 699, 486
- Cullen et al. (2016) Cullen, F., Cirasuolo, M., Kewley, L. J., et al. 2016, ArXiv e-prints, arXiv:1605.04228
- de Barros et al. (2016) de Barros, S., Vanzella, E., Amorín, R., et al. 2016, A&A, 585, A51
- Erb et al. (2006) Erb, D. K., Shapley, A. E., Pettini, M., et al. 2006, ApJ, 644, 813
- Fischer & Tachiev (2014) Fischer, C. F., & Tachiev, G. 2014, MCHF/MCDHF Collection, Version 2, Ref No. 10 & 20, Available online at http://physics.nist.gov/mchf, National Institude of Standards and Technology
- Izotov et al. (2006) Izotov, Y. I., Stasińska, G., Meynet, G., Guseva, N. G., & Thuan, T. X. 2006, A&A, 448, 955
- James et al. (2014) James, B. L., Pettini, M., Christensen, L., et al. 2014, MNRAS, 440, 1794
- Jones et al. (2015) Jones, T., Martin, C., & Cooper, M. C. 2015, ApJ, 813, 126
- Kashino et al. (2016) Kashino, D., Silverman, J. D., Sanders, D., et al. 2016, ArXiv e-prints, arXiv:1604.06802
- Kennicutt (1998) Kennicutt, Jr., R. C. 1998, ARA&A, 36, 189
- Kewley et al. (2013) Kewley, L. J., Dopita, M. A., Leitherer, C., et al. 2013, ApJ, 774, 100
- Kewley et al. (2015) Kewley, L. J., Zahid, H. J., Geller, M. J., et al. 2015, ApJ, 812, L20
- Kriek et al. (2009) Kriek, M., van Dokkum, P. G., Labbé, I., et al. 2009, ApJ, 700, 221
- Kriek et al. (2015) Kriek, M., Shapley, A. E., Reddy, N. A., et al. 2015, ApJS, 218, 15
- Marino et al. (2013) Marino, R. A., Rosales-Ortega, F. F., Sánchez, S. F., et al. 2013, A&A, 559, A114
- Maseda et al. (2014) Maseda, M. V., van der Wel, A., Rix, H.-W., et al. 2014, ApJ, 791, 17
- Masters et al. (2014) Masters, D., McCarthy, P., Siana, B., et al. 2014, ApJ, 785, 153
- McLean et al. (2012) McLean, I. S., Steidel, C. C., Epps, H. W., et al. 2012, in Society of Photo-Optical Instrumentation Engineers (SPIE) Conference Series, Vol. 8446, Society of Photo-Optical Instrumentation Engineers (SPIE) Conference Series
- Momcheva et al. (2015) Momcheva, I. G., Brammer, G. B., van Dokkum, P. G., et al. 2015, ArXiv e-prints, arXiv:1510.02106
- Newman et al. (2013) Newman, J. A., Cooper, M. C., Davis, M., et al. 2013, ApJS, 208, 5
- Onodera et al. (2016) Onodera, M., Carollo, C. M., Lilly, S., et al. 2016, ApJ, 822, 42
- Osterbrock & Ferland (2006) Osterbrock, D. E., & Ferland, G. J. 2006, Astrophysics of gaseous nebulae and active galactic nuclei
- Pettini & Pagel (2004) Pettini, M., & Pagel, B. E. J. 2004, MNRAS, 348, L59
- Pilyugin & Thuan (2005) Pilyugin, L. S., & Thuan, T. X. 2005, ApJ, 631, 231
- Reines et al. (2010) Reines, A. E., Nidever, D. L., Whelan, D. G., & Johnson, K. E. 2010, ApJ, 708, 26
- Sanders et al. (2015) Sanders, R. L., Shapley, A. E., Kriek, M., et al. 2015, ApJ, 799, 138
- Sanders et al. (2016) —. 2016, ApJ, 816, 23
- Shapley et al. (2015) Shapley, A. E., Reddy, N. A., Kriek, M., et al. 2015, ApJ, 801, 88
- Shaw & Dufour (1994) Shaw, R. A., & Dufour, R. J. 1994, in Astronomical Society of the Pacific Conference Series, Vol. 61, Astronomical Data Analysis Software and Systems III, ed. D. R. Crabtree, R. J. Hanisch, & J. Barnes, 327
- Skelton et al. (2014) Skelton, R. E., Whitaker, K. E., Momcheva, I. G., et al. 2014, ApJS, 214, 24
- Smit et al. (2014) Smit, R., Bouwens, R. J., Labbé, I., et al. 2014, ApJ, 784, 58
- Stark et al. (2013) Stark, D. P., Auger, M., Belokurov, V., et al. 2013, MNRAS, 436, 1040
- Steidel et al. (2014) Steidel, C. C., Rudie, G. C., Strom, A. L., et al. 2014, ApJ, 795, 165
- Storey et al. (2014) Storey, P. J., Sochi, T., & Badnell, N. R. 2014, MNRAS, 441, 3028
- Tremonti et al. (2004) Tremonti, C. A., Heckman, T. M., Kauffmann, G., et al. 2004, ApJ, 613, 898
- Troncoso et al. (2014) Troncoso, P., Maiolino, R., Sommariva, V., et al. 2014, A&A, 563, A58
- Yuan & Kewley (2009) Yuan, T.-T., & Kewley, L. J. 2009, ApJ, 699, L161