Minority-carrier dynamics in semiconductors probed by two-photon microscopy
Abstract
Two-photon time-resolved photoluminescence has been recently applied to various semiconductor devices to determine carrier lifetime and surface recombination velocities. So far the theoretical modeling activity has been mainly limited to the commonly used one-photon counterpart of the technique. Here we provide the analytical solution to a 3D diffusion equation that describes two-photon microscopy in the low-injection regime. We focus on a system with a single buried interface with enhanced recombination, and analyze how transport, bulk and surface recombinations influence photoluminescence decays. We find that bulk measurements are dominated by diffusion at short times and by bulk recombination at long times. Surface recombination modifies bulk signals when the optical spot is less than a diffusion length away from the probed interface. In addition, the resolution is increased as the spot size is reduced, which however makes the signal more sensitive to diffusion.
Two-photon microscopy, carrier lifetime, surface recombination velocity.
1 Introduction
The development of semiconductor devices such as photovoltaic solar cells requires quantitative characterization of materials parameters to improve their overall performances. While the minority-carrier lifetime may be the most influential parameter for photovoltaic devices, polycrystalline materials such as CdTe have many grains and grain boundaries whose contributions to recombination remains unclear. Time-resolved photoluminescence (TRPL) is a long-standing optical technique capable of probing bulk lifetime and surface recombination velocities of direct bandgap materials. A TRPL experiment consists of generating electron-hole pairs via a laser pulse, and collecting the radiatively emitted photons over time. The non-radiative recombination occurring in the bulk and at various interfaces influences the resulting photoluminescence (PL) intensity decay, so that adequate modeling of this decay can lead to values of bulk lifetime, diffusion constant and surface recombination velocities.
Two different setups have been used to realize TRPL experiments. The first, most common one, uses incident photons with energy larger than the semiconductor bandgap. The absorption of a single photon is sufficient to generate an electron-hole pair which leads to carrier generation that decays exponentially away from the sample surface. A second route taken in [1]-[2] uses photons with energy smaller than the semiconductor bandgap, that is in a spectral range where the material is normally transparent. The generation of an electron-hole pair now requires the absorption of two photons. Because this non-linear process is proportional to the square of the incoming photon flux, the generation of carriers occurs preferably at the focal volume of the optical setup. By changing the position of the sample with respect to this focal volume, electron-hole pairs can be generated far below the sample surface. Details on the operating principle can be found in the literature [3]-[4]. There exists an extensive literature on the modeling of one-photon TRPL [5, 6, 7], which assumes a carrier generation that decays exponentially away from the sample surface. The direct carrier generation below the surface taking place in a two-photon TRPL experiment requires new investigations.

In this manuscript we review our 3D model for two-photon TRPL (section 2), and we apply it to optical spots in the bulk and at the buried bulk/substrate interface of our model system described in Fig. 1. In section 3 we focus on the impact of carrier diffusion and recombination on PL decays for a bulk measurement. We show how surface recombination changes PL intensities and discuss the resolution of the optical technique in section 4. Throughout this paper, unless explicitly stated otherwise, we consider an optical spot shaped as a rectangular prism with lateral dimensions of and axial size . We assume a uniform excitation of carriers and identical generation and collection regions. While these two regions may be in general different, this case can be obtained in an experimental setup using a confocal microscope.
2 Optically induced minority-carrier transport
We start with our model for the transport of optically induced carriers in a p-type material, and introduce the general solution of the problem for the case of a single surface with enhanced recombination. This surface can describe a sample surface or a buried interface as described by our model system in Fig. 1. We refer to [8] and references therein for more details on the derivations.
The minority-carrier transport is described by the 3D time-dependent diffusion equation
| (1) |
and the boundary conditions determined by the surface recombination velocity
| (2) | ||||
| (3) |
where is the electron density, is the electron diffusion constant, the bulk lifetime and is the carrier generation, taken to be instantaneous. Because we linearized the recombination rate [third term in Eq. (1)], Eq. (1) is valid only for small excited carrier densities (low-injection regime). We introduce the Green’s function of the problem that satisfies
| (4) |
Upon solving Eq. (4) with the boundary conditions Eqs. (2) and (3), one finds [8]
| (5) |
where is the complementary error function. The electron density follows by computing the convolution of the Green’s function above with the carrier generation profile. Because the optical generation is assumed uniform, the electron density is obtained by simply integrating the previous Green’s function over the volume of the spot
| (6) |
and similarly integrating the above density over the collection volume yields the PL intensity
| (7) |
The calculation of PL decays hence requires the integration of the Green’s function Eq. (5) over all spatial arguments over the generation/collection volumes. We performed these integrations numerically for all the results presented in this paper.
3 Transport and lifetime effects in bulk measurements
We first consider the case of a bulk measurement, i.e. the generation/collection volumes are far from both the sample surface and the bulk/substrate interface. We analyze how the carrier recombination and diffusion away from the generation/collection region affect the PL intensity.
Fig. 2 shows the PL intensities obtained for (a) several values of the diffusion constant, keeping , and (b) several values of the bulk lifetime, keeping . We compare these results to the limiting case of a point source whose PL decay reads [8]
| (8) |
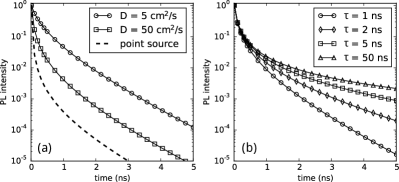
While the PL intensities at short times () are all identical in Fig. 2(b), sharp drops occur as the diffusion constant, hence the diffusion velocity, is increased in Fig. 2(a). These drops reveal that charge carriers diffuse away from the generation spot and recombine outside of the collection volume, so that emitted photons are not collected. Note that the fast decay is not exponential but algebraic, as shown by Eq. (8) (). One can recover purely exponential decays at short times when collecting all emitted photons, which implies a collection region much larger than the diffusion length. Differences in generation and collection volumes can therefore be used as a knob to characterize carrier diffusion properties.
At long times (), Fig. 2(a) shows identical exponential decays, while the slopes of the decays decrease as the bulk lifetime is increased in Fig. 2(b). Eq. (8) shows that recombination exponentially reduces the PL intensity. At long times, this exponential decay (recombination) dominates the previously discussed algebraic decay (diffusion). This is seen in Fig. 2(b) for and , while the traces for and are still in the diffusion dominated regime. As a result, experimentally, in the long time limit a mono-exponential fit should suffice to determine the bulk lifetime . Comparisons with experimental data can be found in [8].
4 Surface recombination effects and resolution of 2-photon TRPL
We turn to calculations done for a generation/collection region at or close to the bulk/substrate interface. We analyze how the enhanced recombination at the interface changes the previous bulk PL decays, and discuss the resolution of the two-photon TRPL technique. Plots presented in this section were obtained with and . We denote as the distance of the bottom of the optical spot from the bulk/substrate interface.

Fig. 3(a) shows PL intensities for various surface recombination velocities when the generation/collection spot is at the bulk/substrate interface (). As expected the PL signal decreases more rapidly for greater values of , as the recombination current is increased at the interface. PL decays at short times are still dominated by diffusion, as the fast decays for are independent of the value of the recombination velocity. However, contrary to the previous bulk calculations, PL decays are not purely exponential for times as is increased. Consequently, a numerical fitting procedure relying on Eq. (5) together with known generation profile and collection volume is necessary to determine materials parameters.
We increased the distance of the generation/collection region from the bulk/substrate interface in Fig. 3(b). Calculations were done with (bottom of the spot at the interface), (: diffusion length) and . The latter can be considered in the bulk of the system (i.e. no surface effects). We find that a displacement of the optical spot away from the interface by a diffusion length () is enough to make the PL intensity insensitive to the probed interface.
In Fig. 4, we examine the variation in the PL decays as a function of the axial size of the generation/collection region. is varied from to , and we compare the PL decays to the case (lines without symbols). The spot is at the bulk/substrate interface ().
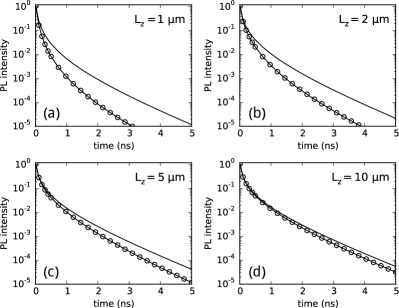
Increasing the spot size should reduce the effect of diffusion. However, because we only increase the axial dimension while keeping the lateral size () smaller than the diffusion length (), there is still a rapid drop of the PL decay for . The drop is stronger for , and the PL intensity is extremely reduced when the surface effects become visible, which may pose a challenge for experimental detection of photons. At times comparisons to the case show that the PL signals converge towards a single exponential decay as is increased. As expected the contribution of the bulk to recombination becomes dominant as the surface to volume ratio of the spot decreases.
5 Conclusion
Two-photon microscopy is a non-invasive and non-destructive optical technique that can probe subsurface materials parameters. Our 3D modeling allowed us to separate lifetime (recombination) from transport (diffusion) effects in PL intensities. In particular we found that the former influences decays at long times while the latter dominates short times. We have shown that the resolution of the technique for interfacial features is improved as the optical spot is confined at the bulk/substrate interface. However this comes with an increase of the diffusion effects causing a sharp drop in the PL decay at short times.
Acknowledgment
B. Gaury acknowledges support under the Cooperative Research Agreement between the University of Maryland and the National Institute of Standards and Technology Center for Nanoscale Science and Technology, Award 70NANB10H193, through the University of Maryland.
References
- [1] H. Wang, K. S. Wong, B. A. Foreman, Z. Y. Yang, and G. K. L. Wong, “One- and two-photon-excited time-resolved photoluminescence investigations of bulk and surface recombination dynamics in ZnSe,” J. Appl. Phys., vol. 83, no. 9, pp. 4773–4776, 1998.
- [2] J. Ma, D. Kuciauskas, D. Albin, R. Bhattacharya, M. Reese, T. Barnes, J. V. Li, T. Gessert, and S.-H. Wei, “Dependence of the minority-carrier lifetime on the stoichiometry of CdTe using time-resolved photoluminescence and first-principles calculations,” Phys. Rev. Lett., vol. 111, p. 067402, 2013.
- [3] E. S. Barnard, E. T. Hoke, S. T. Connor, J. R. Groves, T. Kuykendall, Z. Yan, E. C. Samulon, E. D. Bourret-Courchesne, S. Aloni, P. J. Schuck, C. H. Peters, and B. E. Hardin, “Probing carrier lifetimes in photovoltaic materials using subsurface two-photon microscopy,” Sci. Rep., vol. 3, pp. 2098–2106, 2013.
- [4] D. Kuciauskas, S. Farrell, P. Dippo, J. Moseley, H. Moutinho, J. V. Li, A. M. A. Motz, A. Kanevce, K. Zaunbrecher, T. A. Gessert, D. H. Levi, W. K. Metzger, E. Colegrove, and S. Sivananthan, “Charge-carrier transport and recombination in heteroepitaxial CdTe,” J. Appl. Phys., vol. 116, pp. 123 108–123 115, 2014.
- [5] M. Boulou and D. Bois, “Cathodoluminescence measurements of the minority–carrier lifetime in semiconductors,” J. Appl. Phys., vol. 48, no. 11, pp. 4713–4721, 1977.
- [6] G. W. ‘t Hooft and C. van Opdorp, “Determination of bulk minority‐carrier lifetime and surface/interface recombination velocity from photoluminescence decay of a semi‐infinite semiconductor slab,” J. Appl. Phys., vol. 60, no. 3, pp. 1065–1070, 1986.
- [7] R. K. Ahrenkiel and D. J. Dunlavy, “Minority-carrier lifetime in As,” J. Vac. Sci. Tech. A, vol. 7, no. 3, pp. 822–826, 1989.
- [8] B. Gaury and P. M. Haney, “Probing surface recombination velocities in semiconductors using two-photon microscopy,” J. Appl. Phys., vol. 119, pp. 125 105–125 113, 2016.
- [9] F. Stern and J. M. Woodall, “Photon recycling in semiconductor lasers,” J. Appl. Phys., vol. 45, no. 9, pp. 3904–3906, 1974.
- [10] A. Kanevce, D. Kuciauskas, D. H. Levi, A. M. Allende Motz, and S. W. Johnston, “Two dimensional numerical simulations of carrier dynamics during time-resolved photoluminescence decays in two-photon microscopy measurements in semiconductors,” J. Appl. Phys., vol. 118, no. 4, pp. 045 709–045 715, 2015.