EPIC201702477b: A long period transiting Brown Dwarf from K2
Abstract
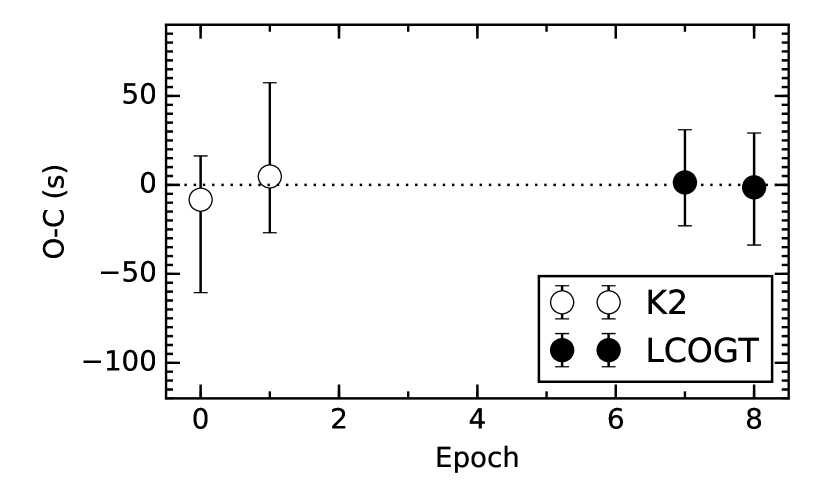
We report the discovery of EPIC201702477b, a transiting brown dwarf in a long period () and eccentric (=) orbit. This system was initially reported as a planetary candidate based on two transit events seen in K2 Campaign 1 photometry and later validated as an exoplanet. We confirm the transit and refine the ephemeris with two subsequent ground-based detections of the transit using the LCOGT 1 m telescope network. We rule out any transit timing variations above the level of 30 s. Using high precision radial velocity measurements from HARPS and SOPHIE we identify the transiting companion as a brown dwarf with a mass, radius, and bulk density of , , and respectively. EPIC201702477b is the smallest radius brown dwarf yet discovered, with a mass just below the H-burning limit. It has the highest density of any planet, substellar mass object or main-sequence star discovered so far. We find evidence in the set of known transiting brown dwarfs for two populations of objects - high mass brown dwarfs and low mass brown dwarfs. The higher-mass population have radii in very close agreement to theoretical models, and show a lower-mass limit around 60 . This may be the signature of mass-dependent ejection of systems during the formation process.
1 Introduction
The scarcity of companions with masses between and around main sequence stars, the “brown dwarf desert”, was first identified from numerous radial velocity planet searches (Marcy & Butler, 2000; Halbwachs et al., 2000). Radial velocity surveys combined with astrometric data also show the brown dwarf desert to be real (Sahlmann et al., 2011; Wilson et al., 2016). Ground-based transit surveys, primarily sensitive to exoplanets with radii similar to or larger than Jupiter, seemed to confirm this desert by finding many Jupiter-mass objects, but very few brown dwarfs - see discoveries of WASP (Pollacco et al., 2006), HATNet (Bakos et al., 2004), HATSouth (Bakos et al., 2013), and KELT (Pepper et al., 2012). In fact, of this 179 transiting planets discovered by these groups, only two, WASP-30b (Anderson et al., 2011) and KELT-1b (Siverd et al., 2012), have masses above 13 . This is despite brown dwarfs having similar radii to hot Jupiters (1 ) and high mass objects being much easier to characterize with the routine radial velocity follow-up used by these projects. The space-based CoRoT mission (Rouan et al., 1999) discovered three transiting brown dwarfs: CoRoT-3b (Deleuil et al., 2008), CoRoT-15b (Bouchy et al., 2011b) and CoRoT-33b (Csizmadia et al., 2015). The Kepler mission uncovered another four transiting brown dwarfs: Kepler-39b (Bouchy et al., 2011a), KOI-205b (Díaz et al., 2013), KOI-415b (Moutou et al., 2013), and KOI-189b (Díaz et al., 2014b). Additionally KOI-554b and KOI-3728b have masses, measured via light curve modulations, just above 80 , putting them very close to the brown dwarf regime (Lillo-Box et al., 2016). However the bulk of planet candidates discovered by the Kepler space mission (Borucki et al., 2010) have measured radii but not masses, so are not able to provide a constraint on the brown dwarf population due to the radius degeneracy between gas giants and brown dwarfs. The recent radial velocity study of Santerne et al. (2016) was able to measure the masses for a sample of large-radius Kepler candidates and found the occurrence rate of brown dwarfs with periods less than 400 days to be .
Brown dwarfs are thought to form via gravitational instability or molecular cloud fragmentation, whereas giant gas planets form via core accretion (Chabrier et al., 2014). However, it is possible that core accretion may produce super-massive planets in the 20-40 range (Mordasini et al., 2009), and gravitational instability may also form gas giant planets (Nayakshin & Fletcher, 2015). Thus the line between gas giants and brown dwarfs is a blurred one. It is argued that the distinction between these objects should be linked with formation mechanisms (Chabrier et al., 2014), and these different formation scenarios are almost certainly responsible for the brown dwarf desert rather than some observational bias (Ma & Ge, 2014).
In this paper we report the discovery of a new transiting brown dwarf, EPIC201702477b (=14.57), for which we can measure a precise mass and radius. In Section 2 we outline the photometric data from the Kepler space telescope and the LCOGT 1 m network. We also describe the spectroscopic observations used to measure the radial velocities of EPIC201702477 and to spectroscopically characterize the host star. We describe the high angular resolution imaging we carried out to further rule out blend scenarios. In Section 3 we carry out a joint analysis of the observational data in order to determine the physical and orbital characteristics of the transiting body. Finally, in Section 4 we look at the implications of this discovery in terms of the known population of well characterized brown dwarfs, the mass-radius-age relationship for brown dwarfs, and the evidence for a lower mass edge to the population of high mass brown dwarfs.
2 Observations
2.1 K2
The NASA Kepler telescope is a 0.95 m space-based Schmidt telescope with a 105 deg2 field-of-view (Borucki et al., 2010). The original mission monitored a single field in the northern hemisphere, and was designed to determine the frequency of Earth-like planets in the galaxy. After four years of operations two of the spacecraft’s reaction wheels failed, ending the original mission. However, the telescope was re-purposed to monitor selected ecliptic fields, which optimizes the pointing stability, in a new mission called K2(Howell et al., 2014).
K2 monitors pre-selected target stars in ecliptic fields for durations of approximately 80 days. While this duration is much shorter than the original Kepler mission, it is still a significant improvement over ground-based monitoring which must contend with interruptions from poor-weather and the Earth’s day-night cycle. The result of this is that K2 is currently the premier facility for finding long period transiting planets, and EPIC201702477b is an example of such a discovery.
EPIC201702477 was monitored by K2 as part of Campaign 1 between 2014 May 30 and 2014 August 21. The star was included as part of program GO1059 (Galactic Archaeology), which aimed to monitor red giant stars and selected targets based purely on a 2MASS magnitude and color cut. The 2MASS color of EPIC201702477 is , right at the edge of the color cut for the program (). Given this and the magnitude of the target (=14.57), it was not likely EPIC201702477 would be a giant star, and indeed our spectroscopy shows the star is a Sun-like dwarf (see Section 2.3).
EPIC201702477b was first identified as a transiting exoplanet candidate in Foreman-Mackey et al. (2015), where a transit signal with a 40.7365 day periodicity was reported. The candidate was studied further by Montet et al. (2015) using existing SDSS imaging, and they noted the presence of a neighbor at 12.11 with a mag. They concluded this neighbor was not sufficiently close to be responsible for the transit signal identified using a photometric aperture with a size of 10. They also calculated the false positive probability (FPP) for EPIC201702477b using the vespa algorithm (Morton, 2012) to be 410-3, and therefore deemed it to be a “validated planet” (defined as FFP).
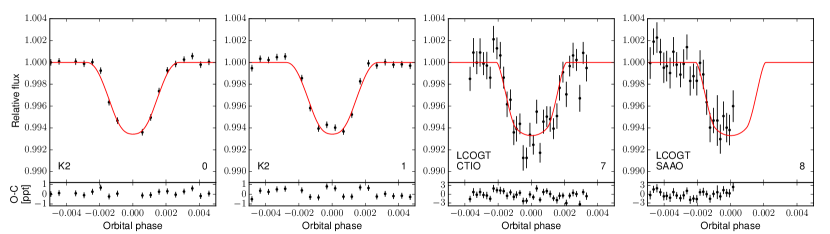
Due to its long orbital period there are only two transit events in the K2 data, and at the K2 30-minute cadence this equated to just sixteen in-transit data points. Such poor sampling of the transit event, even given the exquisite precision of K2, meant that the transit parameters were rather poorly defined. In such circumstances, further ground-based photometry is very important in order to help fully characterize the system.
Of the 37 candidates presented by Foreman-Mackey et al. (2015), EPIC201702477 has the longest orbital period, with the exception of EPIC201257461, which has been shown to be a false candidate (Montet et al., 2015). The reported planet/star radius ratio of EPIC201702477b is , indicating a gas giant exoplanet assuming a solar-type host.
We downloaded the K2 pixel data for EPIC201702477 from the Mikulski Archive for Space Telescopes (MAST)111archive.stsci.edu/k2/ and used a modified version of the CoRoT imagette pipeline (Barros et al., 2015) to extract the light curve. We computed an optimal aperture based on signal-to-noise of each pixel. The background was estimated using the clipped median of all the pixels in the image outside the optimal aperture and removed before aperture photometry was performed. We also calculated the centroid using the Modified Moment Method by Stone (1989). For EPIC201702477 we found that a 14 pixel photometric aperture resulted in the best photometric precision.
The degraded pointing stability of the K2 mission results in flux variations correlated with the star’s position on the CCD. To correct for this we used a self-flat-fielding procedure similar to Vanderburg & Johnson (2014) that assumes the movement of the satellite is mainly in one direction. A full description of the pipeline given in S. Barros et al. (2015, submitted). The final light curve of EPIC201702477 has mean out-of-transit RMS of ppm and the two transit events in the light curve are plotted in Fig. 1.
2.2 LCOGT
The Las Cumbres Observatory Global Telescope (LCOGT) is a network of fully automated telescopes (Brown et al., 2013). Currently there are ten LCOGT 1 m telescopes operating as part of this network, eight of which are in the southern hemisphere: three at the Cerro Tololo Inter-American Observatory (CTIO) in Chile, three at the South African Astronomical Observatory (SAAO) in South Africa, and two at Siding Spring Observatory (SSO) in Australia. Each telescope is equipped with an imaging camera; either a “Sinistro” or an SBIG STX-16803. The Sinistro is LCOGT’s custom built imaging camera that features a back-illuminated 4K4K Fairchild Imaging CCD with m pixels (CCD486 BI). With a plate scale of pixel, the Sinistro cameras deliver a FOV of , which is important for monitoring a sufficient number of reference stars for high-precision differential photometry. The cameras are read out by four amplifiers with binning, with a readout time of s. The SBIG STX-16803 cameras are commercial CCD cameras which feature a frontside-illuminated 4K4K CCD with m pixels - giving a field of view of . These cameras are typically read out in binning mode, which results in a read-out time of 12 s.
The Transiting Exoplanet CHaracterisation (TECH)222lcogt.net/science/exoplanets/tech-project/ project uses the 1 m telescopes in the LCOGT network to photometrically characterize transiting planets and transiting planet candidates. A major focus of the TECH project is to characterize long period ( day) transiting planets or candidates which are difficult to monitor with single site or non-automated telescope systems. As such, EPIC201702477 was selected as a good candidate for photometric monitoring, and was entered to the automated observing schedule in 2015 February.
The first transit event for EPIC201702477b monitored by the TECH project was on 2015 March 15 from CTIO. We observed the target from 01:00 UT to 08:13 UT using a Sinistro in the -band. The exposure times were 240 s, the observing conditions were photometric, and the airmass ranged from 2.3 to 1.2. We detected a full transit of EPIC201702477b— with a depth and duration consistent with that seen in the K2 data. The next transit event occurred 40 days later on 2015 April 28, and was observable from SAAO. EPIC201702477 was monitored between 17:00 UT to 22:50 UT using an SBIG camera, again in the -band. The exposure times were 180 s, the observing conditions were again photometric, and the airmass ranged from 1.8 to 1.2. These data show the first half of a transit event consistent with the previous events. The images for both observations were calibrated via the LCOGT pipeline (Brown et al., 2013) and aperture-photometry extracted in the standard manner as set out in Penev et al. (2013). The photometric data are provided in Table 1, and the phase-folded light curves are presented in Fig 1.
| BJD | Rel. Flux | Rel. Flux | Site/Instrument |
|---|---|---|---|
| (2 400 000) | Error | ||
| 57096.5492063002 | 1.0000 | 0.0018 | CTIO/Sinistro |
| 57096.5525186099 | 1.0047 | 0.0018 | CTIO/Sinistro |
| 57096.5558380098 | 1.0008 | 0.0018 | CTIO/Sinistro |
| 57096.5591604202 | 1.0025 | 0.0018 | CTIO/Sinistro |
| 57096.5624648202 | 1.0038 | 0.0017 | CTIO/Sinistro |
| 57096.5657806299 | 1.0019 | 0.0017 | CTIO/Sinistro |
| 57096.5690742298 | 1.0030 | 0.0017 | CTIO/Sinistro |
| 57096.5723725399 | 1.0023 | 0.0017 | CTIO/Sinistro |
| 57096.5756765502 | 1.0015 | 0.0017 | CTIO/Sinistro |
| … |
Note. — This table is available in a machine-readable form in the online journal. A portion is shown here for guidance regarding the format.
2.3 Spectral Typing
In order to determine the stellar parameters for EPIC201702477, on 2015 March 2 we obtained a low-resolution (R=3000) spectro-photometric observation with the Wide Field Spectrograph (WiFeS) on the Australian National University (ANU) 2.3 m telescope at SSO. The methodology for this spectral typing is fully set out in Bayliss et al. (2013). A spectrum of R==3000 from 3500–6000 Å is flux calibrated according to Bessell (1999) using spectrophotometric standard stars. We determine stellar properties, particularly and , via a grid search using the synthetic templates from the MARCS model atmospheres (Gustafsson et al., 2008). The results showed the star was a Sun-like dwarf star with K and dex. Thus the transit depth was confirmed to be consistent with a planetary-size body.
To better determine the stellar properties we obtained a spectrum of the star with Keck/HiReS (Vogt et al., 1994) on 2015 June 30. The instrument was configured to the standard setup for the California Planet Search (Howard et al., 2010). We collected a single 7 min exposure using the C2 (14x0.861”) decker for a spectral resolution of R45000 and signal-to-noise ratio of per pixel at 5500 Å. We used the software specmatch (Petigura, 2015) to determine the stellar properties. The resulting parameters are listed as initial spectroscopic information in Table 2. Following the methodology described in Sozzetti et al. (2007) we used these initial spectral parameters from Keck as priors for the global fitting (see Section 3), determined a new , and then used this as a prior for a second iteration of specmatch. The global fit was then run again with these updated parameters, and the final solution gave and for EPIC201702477. The final set of stellar parameters is listed in Table 4.
| Parameter | Value | Source |
|---|---|---|
| Identification | ||
| R.A. (deg.) | 175.2407940 | K2 EPIC |
| Dec. (deg.) | +3.6815840 | K2 EPIC |
| 2MASS ID. | 11405777+0340535 | 2MASS PSC |
| Photometric Information | ||
| Kepler (mag) | 14.430 | K2 EPIC |
| u (mag) | 16.312 0.005 | SDSS DR12 |
| g (mag) | 14.871 0.003 | SDSS DR12 |
| r (mag) | 14.354 0.003 | SDSS DR12 |
| i (mag) | 14.189 0.003 | SDSS DR12 |
| z (mag) | 14.137 0.004 | SDSS DR12 |
| J (mag) | 13.268 0.027 | 2MASS PSC |
| H (mag) | 12.881 0.028 | 2MASS PSC |
| K (mag) | 12.766 0.033 | 2MASS PSC |
| Space Motion | ||
| pmR.A. () | -10.0 3.6 | PPMXL |
| pmDec () | -9.8 3.6 | PPMXL |
| mean () | 34.0 | HARPS |
| Initial Spectroscopic Information | ||
| (K) | 5492 60 | Keck |
| 4.12 0.07 | Keck | |
| -0.20 0.04 | Keck | |
| () | 2 | Keck |
2.4 Lucky and AO Imaging
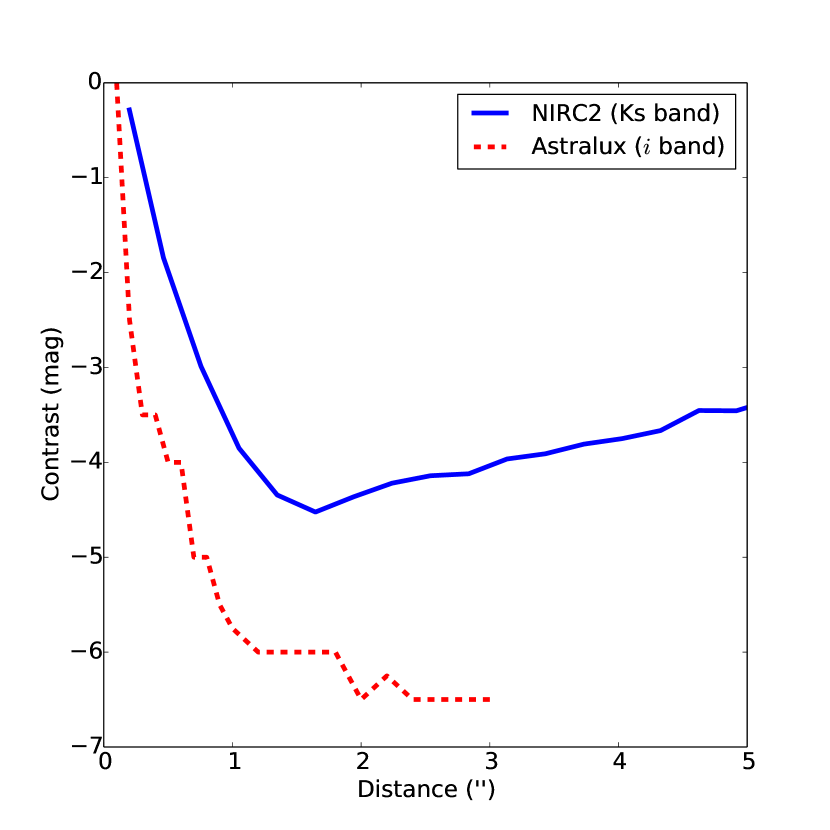
We obtained a high-spatial resolution image with the instrument AstraLux (Hormuth et al., 2008), mounted on the 2.2 m telescope in Calar Alto Observatory (Almería, Spain), using the lucky imaging technique. The target was observed on 2015 November 18 under normal weather conditions. We obtained 60000 frames with individual exposure times of 0.060 s, hence total exposure time of one hour, in the SDSS -band. The images were reduced using the observatory pipeline, which applies bias and flat-field correction to the individual frames and selects the best images in terms of Strehl ratio (Strehl, 1902). The best 10% of the images are then aligned and stacked to compose the final image. The sensitivity limits are calculated following the process explained in Lillo-Box et al. (2014) and are presented in Fig. 2.
We observed EPIC201702477 on 2015 December 27 using NIRC2 NGS-AO (PI: Keith Matthews) on Keck 2. We used the band and the narrow camera setting. We took a total of 4 images, each with 60 seconds of total integration time. We calibrated the images with a flat field, dark frames, and removed image artifacts from dead and hot pixels. We then created a single median-stacked image. We do not see any stellar companions in this image, and compute the contrast curve from the median stacked image. For every point in the image, we compute the total flux from pixels within a box with side length equal to the FWHM of the target star’s PSF. We then divide the image into a series of annuli with width equal to twice the FWHM. For each annulus, we determine the contrast limit to be the standard deviation of the total flux values for boxes inside that annulus. To convert from flux limits to flux ratios and differential magnitudes, we divide the computed standard deviation by the total flux of a similar box centered on the target star. Figure 2 shows the average contrast curve.
The clear conclusion from both the lucky imaging and the AO imaging is that the target appears to be an isolated star to within the limits presented in our contrast curves, and this indicates the transit is occurring on the target star rather than nearby blended neighbor.
2.5 Radial Velocities
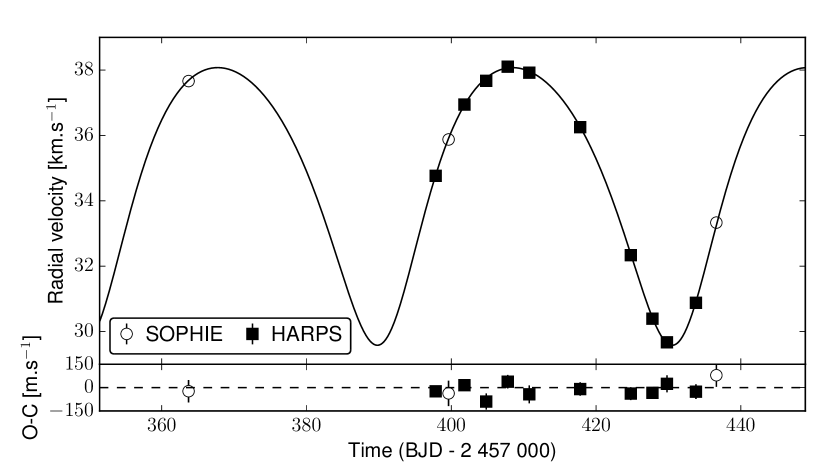
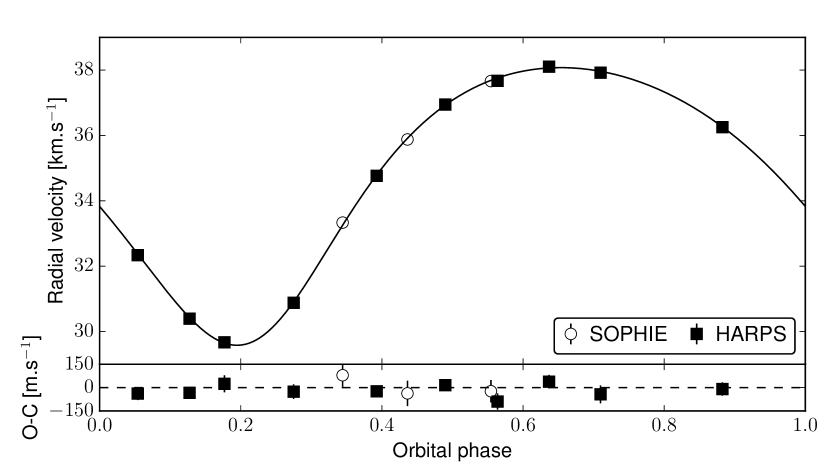
We performed radial velocity follow-up observations of EPIC201702477 with the SOPHIE (Bouchy et al., 2009b) and HARPS (Mayor et al., 2003) spectrographs. Both instruments are high-resolution (R 40,000 and 110,000 for SOPHIE and HARPS, respectively), fiber-fed, and environmentally-controlled echelle spectrographs covering visible wavelengths. We obtained three spectra with SOPHIE (OHP programme ID: 15B.PNP.HEBR) from 2015 June 12 to 2016 February 17 with exposure time of 1800 s and 3600 s, reaching a signal-to-noise ratio between 8 and 22 per pixel at 5500 Å. We obtained ten other spectra with HARPS (ESO programme ID: 096.C-0657) from 2016 January 10 to 2016 February 15 with exposure time between 900 s and 3600 s, corresponding to a signal-to-noise ratio between 3 and 17 per pixel at 5500 Å.
All spectra were reduced with the online pipeline available at the telescopes. The spectra were then cross-correlated with a template mask that corresponds to a G2V star (Baranne et al., 1996). This template was chosen to be close in spectral type to the host star. Radial velocities, bisector span and full-width half maximum (FWHM) were measured on the cross-correlation function and their associated uncertainties were estimated following the methods described in Bouchy et al. (2001), Boisse et al. (2010), and Santerne et al. (2015). SOPHIE radial velocities were corrected for charge-transfer inefficiency (Bouchy et al., 2009a) using the equation provided in Santerne et al. (2012). The derived radial velocities are reported in Table 3 and plotted in Fig. 3.
Our radial velocity measurements show a large amplitude () variation in-phase with the photometric ephemeris and indicative of a brown dwarf mass companion in an elliptical orbit. We use these radial velocity data to determine the planetary parameters in Section 3.
| BJD | RV | Vspan | FWHM | Texp | S/N | Instrument | |||
|---|---|---|---|---|---|---|---|---|---|
| (2 400 000) | s | ||||||||
| 57363.71073 | 37.566 | 0.025 | -0.066 | 0.045 | 9.595 | 0.062 | 3600 | 21.7 | SOPHIE |
| 57399.62998 | 35.780 | 0.046 | 0.103 | 0.082 | 9.614 | 0.114 | 3600 | 13.7 | SOPHIE |
| 57436.62181 | 33.236 | 0.031 | 0.129 | 0.055 | 9.251 | 0.076 | 1800 | 8.2 | SOPHIE |
| 57397.85193 | 34.765 | 0.011 | -0.031 | 0.016 | 6.744 | 0.022 | 3600 | 12.0 | HARPS |
| 57401.81118 | 36.943 | 0.007 | 0.002 | 0.010 | 6.709 | 0.013 | 3600 | 17.5 | HARPS |
| 57404.83131 | 37.670 | 0.050 | 0.033 | 0.075 | 7.004 | 0.100 | 900 | 3.0 | HARPS |
| 57407.80298 | 38.103 | 0.041 | -0.117 | 0.061 | 6.802 | 0.082 | 1500 | 5.5 | HARPS |
| 57410.77375 | 37.918 | 0.056 | -0.091 | 0.084 | 6.311 | 0.111 | 900 | 2.9 | HARPS |
| 57417.80853 | 36.254 | 0.041 | 0.108 | 0.061 | 6.574 | 0.081 | 900 | 3.9 | HARPS |
| 57424.79651 | 32.335 | 0.039 | -0.080 | 0.058 | 6.912 | 0.078 | 900 | 4.2 | HARPS |
| 57427.78748 | 30.393 | 0.033 | 0.000 | 0.050 | 6.827 | 0.067 | 900 | 4.8 | HARPS |
| 57429.80114 | 29.672 | 0.053 | 0.079 | 0.079 | 6.797 | 0.106 | 900 | 3.1 | HARPS |
| 57433.79557 | 30.881 | 0.045 | 0.005 | 0.067 | 6.803 | 0.090 | 900 | 3.8 | HARPS |
Note. — S/N is given per pixel at 550nm.
3 Analysis
3.1 Joint analysis
We analyzed the radial velocity and photometric data of EPIC201702477 with the Markov Chain Monte Carlo (MCMC) algorithm of the pastis software, which is fully described in Díaz et al. (2014a). We modelled the radial velocities with a Keplerian orbit and the photometric data with the JKTEBOP package (Southworth, 2011) and references therein. We chose as a prior for the stellar parameters the values derived from the Keck spectroscopy (Section 2.3). We used the Dartmouth stellar evolution tracks of Dotter et al. (2008) to derive the stellar fundamental parameters (mass, radius, age) in the MCMC, in particular the stellar density which was used to constrain the transit parameters given the eccentricity constrained by the radial velocities, as in Santerne et al. (2014). We ignore pre-main sequence solutions as there is no evidence that this is a young star and the pre-main sequence stage is extremely short in duration. We assumed uninformative priors for the parameters, except for the orbital ephemeris for which we used the ones provided by Montet et al. (2015), the spectroscopic parameters that we took from our spectral analysis, and the orbital eccentricity for which we choose a Beta distribution as recommended by Kipping (2013). For the transit modelling, we used a quadratic law with coefficients taken from the interpolated table of Claret & Bloemen (2011) for both the Kelpler and bandpasses and changed them at each step of the MCMC.
We ran 20 chains of iterations each, with starting points randomly drawn from the joint prior. We rejected non-converged chains based on Kolmogorov-Smirnov test (Díaz et al., 2014a). We then removed the burn-in of each chain before thinning and merging them. We ended with more than 3000 independent samples of the posterior distribution that we used to derive the value and 68.3% uncertainty of each parameters that we report in Table 4.
We also modelled the system independently (but with the same datasets) using the exofast software (Eastman et al., 2013). We find parameters and uncertainties in close agreement with those that were derived using pastis, and therefore we only report the pastis results.
| Parameter | Value |
|---|---|
| Brown Dwarf | |
| (days) | 40.73691 0.00037 |
| (BJD) | 2456811.5462 0.0011 |
| (hours) | 4.04 0.13 |
| 54.0 3.4 | |
| 0.0862 0.0024 | |
| 0.851 0.023 | |
| 0.752 0.023 | |
| (degrees) | 89.105 0.082 |
| 0.2281 0.0026 | |
| (degrees) | 195.9 1.8 |
| () | 34.745 0.020 |
| () | 4.252 0.028 |
| () | 66.9 1.7 |
| () | 0.757 0.065 |
| (AU) | 0.2265 0.0026 |
| () | 191 51 |
| Star | |
| 4.466 0.058 | |
| (K) | 5517 70 |
| -0.164 0.053 | |
| () | 0.901 0.057 |
| () | 0.870 0.031 |
| () | 1.18 0.24 |
| age (Gyr) | 8.8 4.1 |
| RV and Photometry | |
| HARPS jitter () | |
| SOPHIE jitter () | |
| SOPHIE offset relative to HARPS () | 0.078 0.081 |
| K2 contamination | |
| K2 flux out of transit | 1.000022 3.4e-05 |
| K2 jitter | 0.000253 2.8e-05 |
| SAAO contamination | |
| SAAO flux out of transit | 0.99975 2.7e-04 |
| SAAO jitter | 0.00039 3.8e-04 |
| CTIO contamination | |
| CTIO flux out of transit | 0.99966 2.0e-04 |
| CTIO jitter | 0.00089 3.2e-04 |
3.2 TTV analysis
In order to test for transit timing variations (TTVs), we perform an independent fit of the K2 and LCOGT transit light curves. We fit for independent centroids for each transit, while forcing the transits to share the geometric parameters , , and . Since ground-based photometry suffers from instrumental systematics that can bias the centroid measurements, we simultaneously detrend the LCOGT light curves against a linear combination of the terms describing the time, , pixel drift, airmass trend, sky background flux, and target star FWHM variations. No significant TTVs were detected at the 30 s level. The high cadence LCOGT light curves offer similar timing precisions as the long cadence K2 observations, and demonstrate the power of follow-up observations for long period candidates from K2. The variations in the transit centroid times are shown in Figure 4 and listed in Table 5.
| Instrument | Epoch | Transit centroid (BJD-TDB) | Filter |
|---|---|---|---|
| Kepler | 0 | Kep. | |
| Kepler | 1 | Kep. | |
| LCOGT 1 m+Sinistro | 7 | sloan-r | |
| LCOGT 1 m+SBIG | 8 | sloan-r |
3.3 Out-of-transit light curve analysis
We can place an upper limit on the companion’s luminosity based on the secondary eclipse measurements. We checked for the presence of a secondary eclipse in the K2 light curves; the phase of the eclipse is constrained by a Gaussian prior on the and orbital parameters, determined from the RV observations and presented in Table 4. No secondary eclipse is detected at a upper limit of 1.96 mmag, equating to a maximum black-body temperature for the brown dwarf of K.
4 Discussion
With a period just over 40 days, EPIC201702477b is the second longest period transiting brown dwarf discovered to date. The discovery of long-period transiting systems from the K2 data is encouraging, as such systems are extremely difficult to find from ground-based surveys; HATS-17b (Brahm et al., 2016) being the current record at 16.3 days. Long-period systems will remain difficult to discover even when the TESS mission is operating (Ricker et al., 2014) as most fields in this survey will only be monitored for 27 days. EPIC201702477b also demonstrates that like the Kepler mission, some fraction of the K2 validated planets may turn out not to be planets, even at radii down to 0.75 , due to confusion with brown dwarf companions.
4.1 Populating the Brown Dwarf Desert
Including EPIC201702477b, there are just 12 known brown dwarfs () that transit main sequence stars - see Table 6 for a list and Csizmadia et al. (2015) for a detailed list of these systems. These systems are extremely important as they provide an independent check on the radial velocity statistics for brown dwarfs, in addition to giving us true masses and radii. While a full statistical analysis is beyond the scope of this paper, we note that from the K2 survey alone there have been five previously unknown hot Jupiter discoveries (NASA Exoplanet Archive on 2016 April 20), but EPIC201702477b is the first brown dwarf discovery. Although this is in line with the relative statistics for these two populations presented in Santerne et al. (2016), we caution that the target selection process for K2 imprints a strong bias on the sample and makes robust statistics dependent on careful modelling of the selection effects. In addition, the detection of a large radial velocity variation may prompt follow-up efforts to be discontinued for some planet search programs.
4.2 Two Populations of Brown Dwarfs
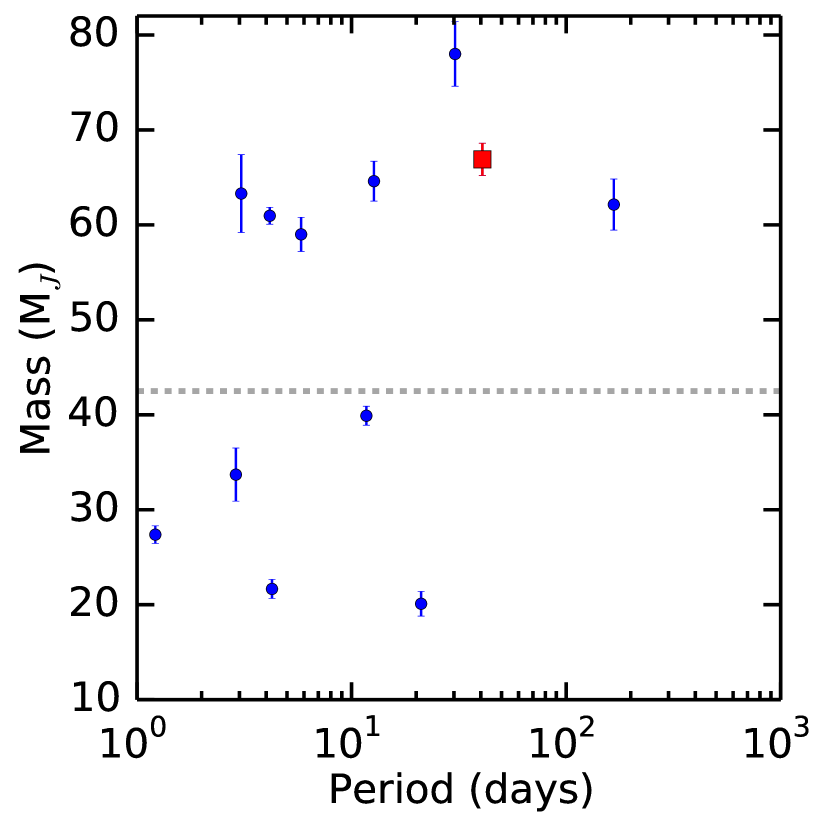
Ma & Ge (2014) have suggested that there exist two populations of brown dwarfs. The first are brown dwarfs below that are formed in the protoplanetary disc via gravitational instability. The second are brown dwarfs above that are formed through molecular cloud fragmentation; essentially the very lowest mass objects of the star-formation process. This division of the brown dwarf population at coincides with the minimum of the companion mass function derived by Grether & Lineweaver (2006) and the void in the mass range as derived from the CORALIE RV survey (Sahlmann et al., 2011). Under this division, EPIC201702477b would clearly be classed in the second category as likely to be formed via molecular cloud fragmentation, as at its mass lies well above the mass division.
Unlike pure RV detections, transiting brown dwarfs can have true masses determined, as opposed to minimum masses. We can also be fairly certain that these discoveries are free from a mass bias, as to first order the discoveries are made on the basis of the planet-to-star radius ratio alone, and radius of the companion is largely independent of the mass in the brown dwarf regime. Therefore while the numbers are still small, transiting brown dwarfs provide a critical test of the two population model proposed in Ma & Ge (2014). As can be seen from Fig. 5, we do indeed see evidence of a gap in the mass distribution between about 40 and 55 , lending support to the two population hypothesis.
4.3 Mass-Radius-Age Relationship for Brown Dwarfs
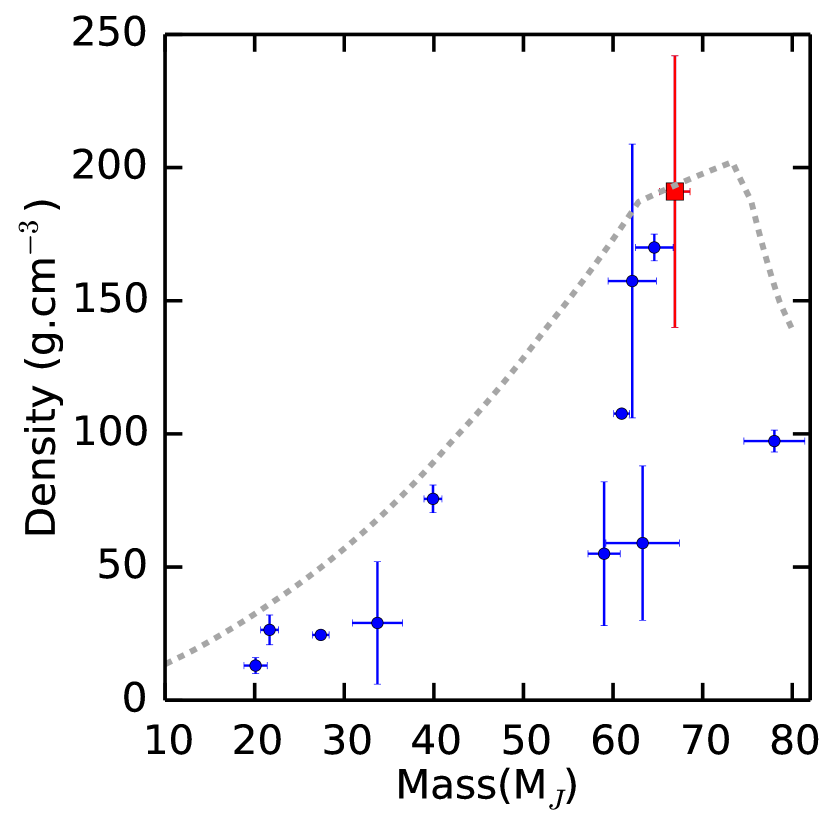
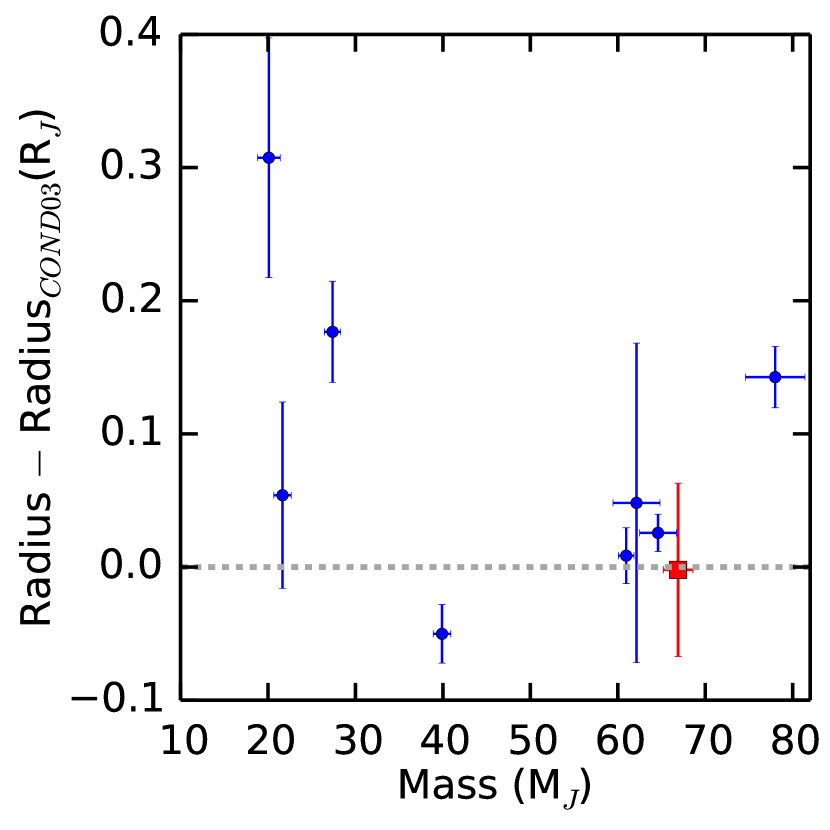
EPIC201702477b lies at the minimum for brown dwarf radii, and with a density of it is the highest density object ever discovered in the regime from planets to main sequence stars - see Fig. 6. To investigate the mass-radius relationship for brown dwarfs we take the known systems with precise (uncertainties 20%) mass and radius and compare the measured radius with the radius predicted from the cond03 models (Baraffe et al., 2003). We use the published masses and ages for each transiting brown dwarf (set out in Table 6), and compute a cond03 model radius for each object based on a 2-D linear interpolation of the model grid-points. We plot the difference between the measured radius and these computed radii in Fig. 7. For hot Jupiters, there exists a population of inflated radius objects at short periods where the insolation flux exceeds erg cm-2 s-1 (Demory & Seager, 2011). However for brown dwarfs the radii do not appear to exhibit such a trend, and the radii appear to be uncorrelated with the insolation flux (or for that matter orbital period). This may be expected as most of the mechanisms proposed for giant planet inflation do not apply to these more massive brown dwarfs (Bouchy et al., 2011b). A possible exception may be KELT-1b (Siverd et al., 2012) which receives extremely high insolation of 7.81109 erg cm-2 s-1 and indeed appears to be inflated. However we do note that the higher mass population of brown dwarfs are in much closer agreement to the cond03 models than the lower mass population of brown dwarfs (see Fig. 7).
4.4 The Mass Edge at 60
Of the 12 known transiting brown dwarfs, six have masses in the range of 59-67 , as shown in Fig. 5. The lack of higher mass objects is only because we restricted our sample to objects less than 80 (the usual limit for what is considered a brown dwarf). Many transit and radial velocity surveys may also not report objects above this mass. However the lack of discoveries with masses below this group of high mass transiting brown dwarfs is interesting, and appears as a sharp lower mass edge to the high-mass brown dwarfs. While we caution that the sample size is still small, the edge is intriguing and may be related to the ejection process during formation. In the simulations of Stamatellos & Whitworth (2009) it is found that although the formation of brown dwarfs is approximately flat in the regime of 15-80 , the subsequent ejection process, which results in the loss of over half of the companions, is strongly mass dependent. Primarily it is the lower-mass brown dwarfs that are ejected, leaving behind a higher-mass population. These simulations even show that companions around 70 are among the least likely to get ejected (see Fig. 15 of Stamatellos & Whitworth, 2009). It is possible it is these objects that we find as the population of transiting brown dwarfs with masses from 60-70 .
| Name | Period | Mass | Radius | Age | Ref. |
|---|---|---|---|---|---|
| (days) | () | () | (Gyr) | ||
| CoRoT-3b | 4.256 | 2.2 | Deleuil et al. (2008) | ||
| NLTT41135b | 2.889 | 5.0 | Irwin et al. (2010) | ||
| CoRoT-15b | 3.060 | 2.24 | Bouchy et al. (2011b) | ||
| WASP-30b | 4.156 | 1.5 | Anderson et al. (2011) | ||
| LHS6343C | 12.713 | 5.0 | Johnson et al. (2011) | ||
| Kepler-39b | 21.087 | 4.75 | Bouchy et al. (2011a) | ||
| KELT-1b | 1.217 | 1.75 | Siverd et al. (2012) | ||
| KOI-205b | 11.720 | 3.9 | Díaz et al. (2013) | ||
| KOI-415b | 166.788 | 10.5 | Moutou et al. (2013) | ||
| KOI-189b | 30.360 | 6.1 | Díaz et al. (2014b) | ||
| CoRoT-33b | 5.819 | 7.8 | Csizmadia et al. (2015) | ||
| EPIC201702477b | 40.737 | 8.8 | this work |
Acknowledgments
This work has been carried out within the framework of the National Centre for Competence in Research ”PlanetS” supported by the Swiss National Science Foundation (SNSF). This paper includes data collected by the K2 mission. Funding for the K2 mission is provided by the NASA Science Mission directorate. This paper makes use of data and services from NASA Exoplanet Archive (Akeson et al., 2013), which is operated by the California Institute of Technology, under contract with the National Aeronautics and Space Administration under the Exoplanet Exploration Program. We are grateful to our colleagues who have performed some of the observations presented here with the HARPS spectrograph: F. Motalebi, A. Wyttenbach, and B. Lavie. The Porto group acknowledges the support from the Fundação para a Ciência e Tecnologia, FCT (Portugal) in the form of the grants, projects, and contracts UID/FIS/04434/2013 (POCI-01-0145-FEDER-007672), PTDC/FIS-AST/1526/2014 (POCI-01-0145-FEDER-016886), IF/00169/2012, IF/00028/2014, IF/01312/2014 and POPH/FSE (EC) by FEDER funding through the Programa Operacional de Factores de Competitividade - COMPETE”.
Partly based on observations made at Observatoire de Haute Provence (CNRS), France and with ESO Telescopes at the La Silla Paranal Observatory under programme ID 096.C-0657. Some of the data presented herein were obtained at the W.M. Keck Observatory, which is operated as a scientific partnership among the California Institute of Technology, the University of California and the National Aeronautics and Space Administration. The Observatory was made possible by the generous financial support of the W.M. Keck Foundation. The authors wish to recognize and acknowledge the very significant cultural role and reverence that the summit of Mauna Kea has always had within the indigenous Hawaiian community.
AS is supported by the European Union under a Marie Curie Intra-European Fellowship for Career Development with reference FP7-PEOPLE-2013-IEF, number 627202. J. L-B acknowledges financial support from the Marie Curie Actions of the European Commission (FP7-COFUND) and the Spanish grant AYA2012- 38897-C02-01. JMA acknowledges funding from the European Research Council under the ERC Grant Agreement n. 337591-ExTrA. D.J.A. and D.P acknowledge funding from the European Union Seventh Framework programme (FP7/2007- 2013) under grant agreement No. 313014 (ETAEARTH). OD acknowledges support by CNES through contract 567133. KH and ACC acknowledge support from UK Science and Technology Facilities Council (STFC) grant ST/M001296/1. DJAB acknowledges support from the UKSA and the University of Warwick. B.J.F. notes that this material is based upon work supported by the National Science Foundation Graduate Research Fellowship under grant No. 2014184874. Any opinion, findings, and conclusions or recommendations expressed in this material are those of the authors(s) and do not necessarily reflect the views of the National Science Foundation. W.D.C. acknowledges support from NASA Grants NNX15AV58G and NNX16AE70G. This material is based upon work supported by the National Science Foundation Graduate Research Fellowship under Grant No. DGE-1144469 This work was performed in part under contract with the Jet Propulsion Laboratory (JPL) funded by NASA through the Sagan Fellowship Program executed by the NASA Exoplanet Science Institute.
CAO:2.2 m (AstraLux), ESO:3.6 m (HARPS), K2, Keck:II (NIRC2), Keck:I (HIRES), LCOGT, OHP:1.93 m (SOPHIE), ANU:2.3 m (WiFeS)
References
- Akeson et al. (2013) Akeson, R. L., Chen, X., Ciardi, D., et al. 2013, PASP, 125, 989
- Anderson et al. (2011) Anderson, D. R., Collier Cameron, A., Hellier, C., et al. 2011, ApJ, 726, L19
- Bakos et al. (2004) Bakos, G., Noyes, R. W., Kovács, G., et al. 2004, PASP, 116, 266
- Bakos et al. (2013) Bakos, G. Á., Csubry, Z., Penev, K., et al. 2013, PASP, 125, 154
- Baraffe et al. (2003) Baraffe, I., Chabrier, G., Barman, T. S., Allard, F., & Hauschildt, P. H. 2003, A&A, 402, 701
- Baranne et al. (1996) Baranne, A., Queloz, D., Mayor, M., et al. 1996, A&AS, 119, 373
- Barros et al. (2015) Barros, S. C. C., Almenara, J. M., Demangeon, O., et al. 2015, MNRAS, 454, 4267
- Bayliss et al. (2013) Bayliss, D., Zhou, G., Penev, K., et al. 2013, AJ, 146, 113
- Bessell (1999) Bessell, M. S. 1999, PASP, 111, 1426
- Boisse et al. (2010) Boisse, I., Eggenberger, A., Santos, N. C., et al. 2010, A&A, 523, A88
- Borucki et al. (2010) Borucki, W. J., Koch, D., Basri, G., et al. 2010, Science, 327, 977
- Bouchy et al. (2009a) Bouchy, F., Isambert, J., Lovis, C., et al. 2009a, in EAS Publications Series, Vol. 37, EAS Publications Series, ed. P. Kern, 247–253
- Bouchy et al. (2001) Bouchy, F., Pepe, F., & Queloz, D. 2001, A&A, 374, 733
- Bouchy et al. (2009b) Bouchy, F., Hébrard, G., Udry, S., et al. 2009b, A&A, 505, 853
- Bouchy et al. (2011a) Bouchy, F., Bonomo, A. S., Santerne, A., et al. 2011a, A&A, 533, A83
- Bouchy et al. (2011b) Bouchy, F., Deleuil, M., Guillot, T., et al. 2011b, A&A, 525, A68
- Brahm et al. (2016) Brahm, R., Jordán, A., Bakos, G. Á., et al. 2016, AJ, 151, 89
- Brown et al. (2013) Brown, T. M., Baliber, N., Bianco, F. B., et al. 2013, PASP, 125, 1031
- Chabrier et al. (2014) Chabrier, G., Johansen, A., Janson, M., & Rafikov, R. 2014, Protostars and Planets VI, 619
- Claret & Bloemen (2011) Claret, A., & Bloemen, S. 2011, A&A, 529, A75
- Csizmadia et al. (2015) Csizmadia, S., Hatzes, A., Gandolfi, D., et al. 2015, A&A, 584, A13
- Deleuil et al. (2008) Deleuil, M., Deeg, H. J., Alonso, R., et al. 2008, A&A, 491, 889
- Demory & Seager (2011) Demory, B.-O., & Seager, S. 2011, ApJS, 197, 12
- Díaz et al. (2014a) Díaz, R. F., Almenara, J. M., Santerne, A., et al. 2014a, MNRAS, 441, 983
- Díaz et al. (2013) Díaz, R. F., Damiani, C., Deleuil, M., et al. 2013, A&A, 551, L9
- Díaz et al. (2014b) Díaz, R. F., Montagnier, G., Leconte, J., et al. 2014b, A&A, 572, A109
- Dotter et al. (2008) Dotter, A., Chaboyer, B., Jevremović, D., et al. 2008, ApJS, 178, 89
- Eastman et al. (2013) Eastman, J., Gaudi, B. S., & Agol, E. 2013, PASP, 125, 83
- Foreman-Mackey et al. (2015) Foreman-Mackey, D., Montet, B. T., Hogg, D. W., et al. 2015, ApJ, 806, 215
- Grether & Lineweaver (2006) Grether, D., & Lineweaver, C. H. 2006, ApJ, 640, 1051
- Gustafsson et al. (2008) Gustafsson, B., Edvardsson, B., Eriksson, K., et al. 2008, A&A, 486, 951
- Halbwachs et al. (2000) Halbwachs, J. L., Arenou, F., Mayor, M., Udry, S., & Queloz, D. 2000, A&A, 355, 581
- Hormuth et al. (2008) Hormuth, F., Hippler, S., Brandner, W., Wagner, K., & Henning, T. 2008, in Proc. SPIE, Vol. 7014, Ground-based and Airborne Instrumentation for Astronomy II, 701448
- Howard et al. (2010) Howard, A. W., Johnson, J. A., Marcy, G. W., et al. 2010, ApJ, 721, 1467
- Howell et al. (2014) Howell, S. B., Sobeck, C., Haas, M., et al. 2014, PASP, 126, 398
- Irwin et al. (2010) Irwin, J., Buchhave, L., Berta, Z. K., et al. 2010, ApJ, 718, 1353
- Johnson et al. (2011) Johnson, J. A., Apps, K., Gazak, J. Z., et al. 2011, ApJ, 730, 79
- Kipping (2013) Kipping, D. M. 2013, MNRAS, 434, L51
- Lillo-Box et al. (2014) Lillo-Box, J., Barrado, D., & Bouy, H. 2014, A&A, 566, A103
- Lillo-Box et al. (2016) Lillo-Box, J., Ribas, A., Barrado, D., Merín, B., & Bouy, H. 2016, ArXiv e-prints, arXiv:1606.02398
- Ma & Ge (2014) Ma, B., & Ge, J. 2014, MNRAS, 439, 2781
- Marcy & Butler (2000) Marcy, G. W., & Butler, R. P. 2000, PASP, 112, 137
- Mayor et al. (2003) Mayor, M., Pepe, F., Queloz, D., et al. 2003, The Messenger, 114, 20
- Montet et al. (2015) Montet, B. T., Morton, T. D., Foreman-Mackey, D., et al. 2015, ApJ, 809, 25
- Mordasini et al. (2009) Mordasini, C., Alibert, Y., & Benz, W. 2009, A&A, 501, 1139
- Morton (2012) Morton, T. D. 2012, ApJ, 761, 6
- Moutou et al. (2013) Moutou, C., Bonomo, A. S., Bruno, G., et al. 2013, A&A, 558, L6
- Nayakshin & Fletcher (2015) Nayakshin, S., & Fletcher, M. 2015, MNRAS, 452, 1654
- Penev et al. (2013) Penev, K., Bakos, G. Á., Bayliss, D., et al. 2013, AJ, 145, 5
- Pepper et al. (2012) Pepper, J., Kuhn, R. B., Siverd, R., James, D., & Stassun, K. 2012, PASP, 124, 230
- Petigura (2015) Petigura, E. A. 2015, PhD thesis, University of California, Berkeley
- Pollacco et al. (2006) Pollacco, D. L., Skillen, I., Collier Cameron, A., et al. 2006, PASP, 118, 1407
- Ricker et al. (2014) Ricker, G. R., Winn, J. N., Vanderspek, R., et al. 2014, in Proc. SPIE, Vol. 9143, Space Telescopes and Instrumentation 2014: Optical, Infrared, and Millimeter Wave, 914320
- Rouan et al. (1999) Rouan, D., Baglin, A., Barge, P., et al. 1999, Physics and Chemistry of the Earth C, 24, 567
- Sahlmann et al. (2011) Sahlmann, J., Ségransan, D., Queloz, D., et al. 2011, A&A, 525, A95
- Santerne et al. (2012) Santerne, A., Díaz, R. F., Moutou, C., et al. 2012, A&A, 545, A76
- Santerne et al. (2014) Santerne, A., Hébrard, G., Deleuil, M., et al. 2014, A&A, 571, A37
- Santerne et al. (2015) Santerne, A., Díaz, R. F., Almenara, J.-M., et al. 2015, MNRAS, 451, 2337
- Santerne et al. (2016) Santerne, A., Moutou, C., Tsantaki, M., et al. 2016, A&A, 587, A64
- Siverd et al. (2012) Siverd, R. J., Beatty, T. G., Pepper, J., et al. 2012, ApJ, 761, 123
- Southworth (2011) Southworth, J. 2011, MNRAS, 417, 2166
- Sozzetti et al. (2007) Sozzetti, A., Torres, G., Charbonneau, D., et al. 2007, ApJ, 664, 1190
- Stamatellos & Whitworth (2009) Stamatellos, D., & Whitworth, A. P. 2009, MNRAS, 392, 413
- Stone (1989) Stone, R. C. 1989, AJ, 97, 1227
- Strehl (1902) Strehl, K. 1902, Astronomische Nachrichten, 158, 89
- Vanderburg & Johnson (2014) Vanderburg, A., & Johnson, J. A. 2014, PASP, 126, 948
- Vogt et al. (1994) Vogt, S. S., Allen, S. L., Bigelow, B. C., et al. 1994, in Proc. SPIE, Vol. 2198, Instrumentation in Astronomy VIII, ed. D. L. Crawford & E. R. Craine, 362
- Wilson et al. (2016) Wilson, P. A., Hébrard, G., Santos, N. C., et al. 2016, A&A, 588, A144