Using SDO/HMI magnetograms as a source of the solar mean magnetic field data
keywords:
Integrated Sun Observations; Instrumental Effects1 Introduction
sec-Introduction
The solar mean magnetic field (SMMF) represents imbalance of the line-of-sight (LOS) magnetic flux integrated over the entire visible solar hemisphere (García et al., 1999; Haneychuk, Kotov, and Tsap, 2003). A strong correlation exists between the SMMF and the interplanetary magnetic field measured from Earth (Severny et al., 1970; Scherrer et al., 1977; Bremer, 1996) as well as between the SMMF and the solar wind speed (Neugebauer et al., 2000). In a number of papers Sheeley et al. (Sheeley, DeVore, and Boris, 1985; Sheeley and DeVore, 1986a, b) investigated the evolution of photospheric magnetic fields and the connection between the SMMF and magnetic transport parameters, including differential rotation and the diffusion coefficient. Fitting the model parameters to obtain the best agreement between the simulations and the observed SMMF allowed them to confirm the existence of the meridional flow (Wang, Nash, and Sheeley, 1989) and to establish the influence of the differential rotation on the SMMF temporal variations.
Systematic measurements of the SMMF are carried out at the Crimean astrophysical observatory (CrAO) since 1968 (Severny, 1969; Kotov and Severny, 1985). Several observatories performed SMMF measurements during past four decades as well: Mount Wilson Observatory (Howard, 1974), Sayan Observatory of the Solar-Terrestrial Physics Institute (Grigor’ev and Demidov, 1987), the Birmingham Solar Oscillation Network of observatories (Chaplin et al., 2003). The spaceborne Michelson Doppler Interferometer (MDI, Scherrer et al., 1995) and Global Oscillations at Low Frequencies (GOLF, García et al., 1999) instruments onboard the ESA/NASA Solar and Heliospheric Observatory (SOHO) produced high-cadence data on SMMF. The SOHO/MDI magnetic field observations were terminated in 2011. Instead the improved Helioseismic and Magnetic Imager (HMI, Scherrer et al., 2012) onboard the Solar Dynamic Observatory (SDO, Pesnell, Thompson, and Chamberlin, 2012) began to provide data on solar magnetic fields. Daily SMMF measurements provided by Wilcox Solar Observatory (WSO) since 1975 (Scherrer et al., 1977) have become a recognized benchmark for this type of data. A brief comparison between the WSO and SOHO/MDI SMMF measurements was undertaken by Boberg et al. (2002).
In the present paper, we compare the SMMF obtained by the SDO/HMI instrument with that provided by WSO to ensure consistency of datasets from these two sources. We also discuss some issues, in particular, the 24-hour artificial periodicity of SDO/HMI SMMF.
2 Observables and methods
sec-Observ In this research, we utilize two types of magnetic fields measurements. The first one is the WSO SMMF measurements that are carried on since May 1975 (Scherrer et al., 1977). A Babcock-type magnetograph (Babcock, 1953) is used in combination with a 33 cm coelostat and Littrow spectrograph (Scherrer et al., 1977). The LOS component of the magnetic field is measured ”as the difference between the Zeeman splitting in the Fe I line at 5250 Å and the zero offset signal in the magnetically insensitive Fe I line at 5124 Å” (Boberg et al., 2002). An observation run lasts twenty minutes and is repeated several times per day. The SMMF is computed by integration of the large-scale field over the solar disk. A daily averaged SMMF magnitude is then derived by averaging over all observations taken on a given day. The typical standard deviation is about 5 T.
Our second data set consists of the SDO/HMI measurements. The spacecraft is located in an inclined geosynchronous orbit at the altitude of 36000 km. It outlines a figure ”eight” trajectory along the W meridian spanning 57 degree in latitude as seen from the ground (Smirnova et al., 2013). The HMI instrument (Schou et al., 2012) onboard SDO is a filtergraph with the full-disk coverage by two CCD cameras of 40964096 pixels (Scherrer et al., 2012; Liu et al., 2012). The cameras produce 12 filtegrams used to derive LOS magnetograms: the profile of the photospheric Fe I 6173 Å spectral absorption line (Norton et al., 2006) is measured at six wavelength positions in two polarization states. The magnetic field sign and the magnitude are derived from Zeeman splitting of the line. The LOS magnetograms are provided with 45 second and 720 second cadence. The 24-hour periodicities in the HMI magnetic field products were revealed by Liu et al. (2012), which probably have resulted from the 24-hour cyclicity in the orbital velocity of the spacecraft combined with uncertainties in instrument calibration. The effect seems to be enhanced for strong fields related to sunspots (Liu et al., 2012; Smirnova et al., 2013).
We also used the CrAO daily patrol sunspots’ magnetic field measurements 111available at http://solar.craocrimea.ru/eng/observations.htm to determine unsaturated peak magnitudes of the sunspot magnetic fields. Magnetic field strength in a sunspot is derived from the Zeeman splitting in the Fe I 6302 Å line. The observations are presented as a solar disk sketch with sunspot group contours, their magnetic polarity, and field strength.
We calculated the SMMF magnitude by integrating the signed magnetic flux from all pixels of a 720-second magnetogram within a circumference with one solar radius centered at the solar disk center. The solar radius and the solar disk center data were taken from the header of the corresponding fits file.
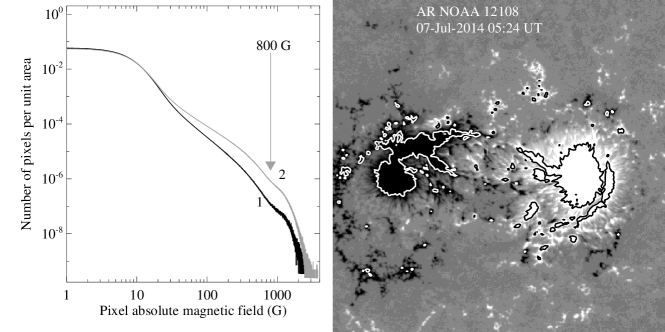
A typical histogram of the absolute magnetic field strength in HMI pixels is shown in Figure \irefFig1. The first curve (marked by 1 in the figure) was calculated as an average of 246 histograms calculated from full disk magnetograms measured between April 27 and December 31 of 2010. The second curve is the average of 348 histograms calculated from magnetograms acquired in 2014. One magnetogram per day was used in both cases. The histograms were normalized to unit area. The curves’ behavior beyond 10 G is explained by approaching to the noise limit of the instrument. The first curve, associated with the period of an extended solar minimum, shows the lack of pixels of strong and medium fields compared to the second curve referring to the cycle maximum. Nevertheless, the slight bend in the histogram at 800 G is clearly seen. The right panel in Figure \irefFig1 shows that the 800 G contour is predominantly a penumbra-to-umbra boundary. Accordingly we selected the 800 G value as a threshold to separate the sunspot’s fields from the rest of the solar magnetic fields. Thus, we summed magnetic flux separately over the strong-field areas and over the rest of the solar disk. This allowed us to reveal the contribution of sunspots to the appearance of the 24-hour artificial periodicity. Throughout this paper these sums are referred to as weak- and strong-field components of the SMMF.
The Joint Science Operation Center (JSOC) 222http://jsoc.stanford.edu/ run by the Stanford Solar Group allows to export LOS magnetogram FITS file headers alone that includes DATAMEAN parameter, which can be treated as SMMF. This parameter was used in this study to verify the calculated value of the total SMMF.
FITS file headers also contain the QUALITY parameter. A non-zero value of this parameter means that some data used in the magnetogram calculations were lost or corrupted. Such a magnetogram should not be used for scientific purposes. The HMI instrument calibration is performed at 06:00 UT and 18:00 UT every day and the corresponding magnetograms have non-zero QUALITY value. To minimize the influence of these bad data we used magnetograms obtained at twenty-fourth minute of every hour. Some of the selected magnetograms also had the non-zero QUALITY parameter, however in the cases the magnetogram showed no abnormal value of SMMF it was kept.
3 Results
sec-Results
3.1 Comparing WSO SMMF with SDO/HMI SMMF
subs-Res1
A one-year (July 2014 - June 2015) WSO and HMI SMMF data obtained by using the aforementioned approach is shown in Figure \irefFig2, top panel. Visual inspection revealed a very good correspondence between the measurements obtained with different instruments, which was further confirmed by calculations of the Pearson correlation coefficient, see Figure \irefFig3. The WSO SMMF data that were measured daily at 20:00 UT are compared with the co-temporal SDO/HMI SMMF data set. In total, 1507 data pairs were used to obtain the regression relationship between the WSO and SDO/HMI SMMF sets (Figure \irefFig3). Notwithstanding the fact that different photospheric lines as well as techniques were used for measurements, the linear regression coefficient is close to unity, namely 0.99(2), and the correlation coefficient is 0.86. Also, the advantage of a spaceborne instrument (weather, daylight, and seeing independence) can be seen in Figure \irefFig2: the gaps in WSO data can be successfully filled by uninterrupted HMI observations. A good example could be a rejuvenation of SMMF observed in December 2014. The effect was caused by a persistent emergence of magnetic flux in active regions, which significantly amplified the large-scale background fields (Sheeley and Wang, 2015). Unfortunately, the WSO data had many gaps in December 2014 right at the moments of the greatest increase of the absolute SMMF amplitude. Adopting the conversion factor as 1.0, we infer that the absolute maximum–minimum difference in SMMF was higher by approximately 40 % than that derived from the WSO data only.
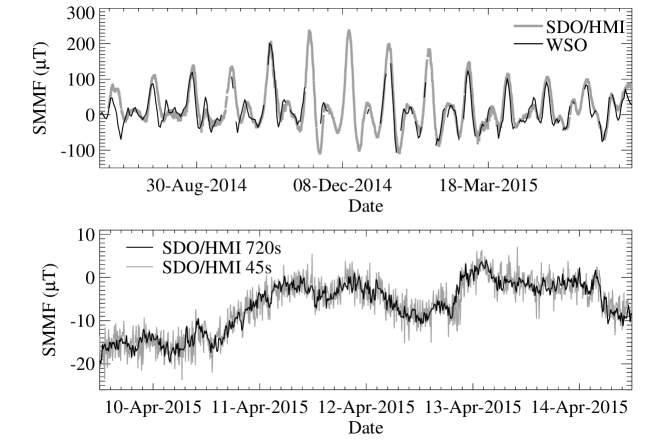
We estimated the level of high-frequency noise in the HMI SMMF time series. Low-frequency variations (13.5 and 27 day long and longer) were removed from the data by applying a high-pass filter to the SMMF data with a time constant of 24 hour. The standard deviation of the noise was found to be 3 T for 720-second HMI magnetograms, which does not exceed the 5 T value for the WSO data (Scherrer et al., 1977). The noise level in both 45-second and 720-second HMI magnetograms can be visually estimated from the curves shown in the bottom panel of Figure \irefFig2: the ratio of SMMF noise level in 45-second magnetograms to that of 720-second magnetograms is close to 2.4. This value is in an agreement with the estimation of Liu et al. (2012) based on magnetograms acquisition time: the noise level ratio was reported to be about 2.48.
3.2 SDO/HMI SMMF artifacts
subs-Res2
Using the technique described in Section 2, we calculated the SMMF components for a time interval from January 2011 to December 2015 with 1 hour cadence (Figure \irefFig4, top panel) to analyse artificial periodicities in SMMF.
The topic was discussed in a number of publications (e.g. Liu et al., 2012; Smirnova et al., 2013). The study by Liu et al. (2012) showed that the 12 and 24-hour magnetic field amplitude variations are present in SDO/HMI magnetograms and they can be attributed to the strong fields of active regions. The strong enough Zeeman splitting coupled with the Doppler effect due to the Sun rotation and the satellite movement caused the spectral line to shift every 24 hours beyond the well-determined part of the calibration curve. The calibration curve was extrapolated in this case and the periodicities are believed to be caused by some inaccuracy in the extrapolation. These 24-hour artifacts led to 3% variations of the sunspot’s magnetic field amplitude (Liu et al., 2012). There is no evidence of significant variations of magnetic fields of quiet-Sun regions. Smirnova et al. (2013) found these artificial oscillations in both background and active region fields with the amplitude of the oscillations increasing rapidly when the field strength exceeded 2000 G (Smirnova et al. (2013), see their conclusion).
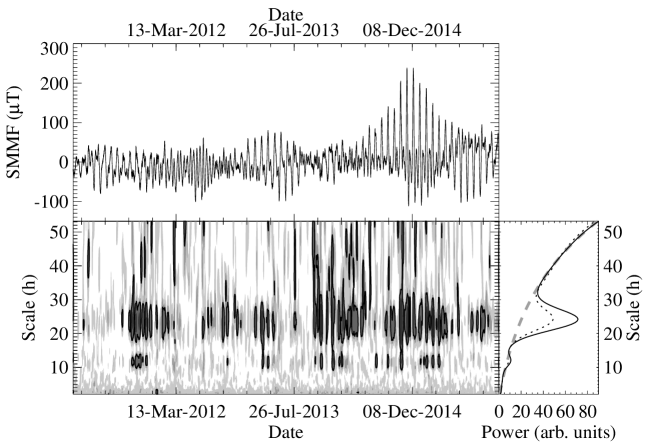
To reveal the influence of the artifacts on SDO/HMI SMMF, we performed a wavelet analysis (Torrence and Compo, 1998) of the entire five-year long SMMF time series. A Morlet mother function with nondimensional frequency equal to six was chosen.
The wavelet transform of the SMMF is shown in the lower left panel of Figure \irefFig4. Both 24-hour and 12-hour peaks can be clearly seen on the global (averaged over the entire time interval) wavelet power plot (Figure \irefFig4, lower right panel). Since both 24-hour and 12-hour harmonics have an artificial origin, we interpolated the global wavelet spectrum in the vicinity of these harmonics by an exponential fit in order to obtain unperturbed SMMF spectrum (Figure \irefFig4, bottom right panel, grey thick dashed curve). We chose this curve as a spectrum of an empirical background. In the wavelet spectrum (Figure \irefFig4, bottom left panel) the solid thick curve outlines the threefold excess of the harmonic power over the background level. Analysis of the wavelet transforms of both weak- and strong-field components separately shows that only approximately 50% of the spectral power of the 24-hour harmonic in the total SMMF is produced by the strong-field component (the global wavelet spectrum of the weak-field component is shown in the bottom right panel of Figure \irefFig4, black thin dotted curve). The Pearson correlation coefficient between the number of strong-field pixels and the amplitude of the 24-hour harmonic equals only 0.45.

The number of pixels that have the magnetic field strength above 2000 G is shown in Figure \irefFig5, top panel. The 2000 G level was suggested by Smirnova et al. (2013) as a threshold above which a rapid increase of the 24-hour harmonic amplitude was observed. In the same figure (bottom panel) the spectral power amplitude of 24-hour oscillations is shown for comparison. One can see that instances of a significant increase of the sunspot’s area are not necessarily associated with an increase of the 24-hour oscillation amplitude (for example, a sunspot area peak on July 07, 2014). At the same time, a relatively high 24-hour harmonic amplitude can be observed in the absence of large sunspots (e.g., harmonic peak on February 07, 2015). A moderate correlation exists between these two curves (Pearson’s correlation coefficient equals 0.55). This also confirms the conclusion that only approximately half of the 24-hour harmonic power is produced by strong-field solar regions. Meanwhile, both 24-hour and 12-hour harmonics were also detected in the global power spectrum of the weak-field component (Figure \irefFig4, bottom right panel, thin dotted black curve). In general, during the analysed five-year time period, the 24-hour harmonic amplitude exceeded the background level for 75% of the time, whereas the triple background level was exceeded for 30% of the time. Apparently, the persistence of the 24-hour harmonic in the weak-field component can be explained by the collective contribution of a very large number (more than 10 millions) of individual pixels that exhibited weak in-phase artificial variations of magnetic field that becomes significant after summation over the entire solar disk.
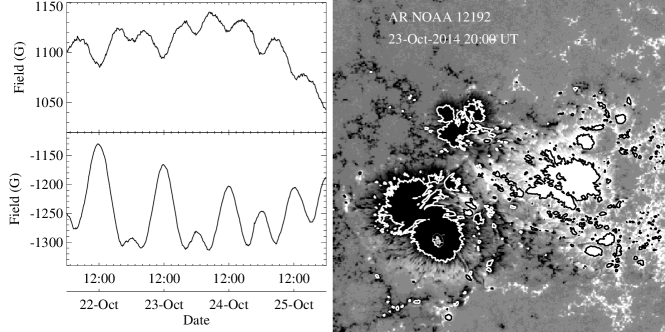
Day-to-day variations of SMMF due to the 24-hour harmonic are very well pronounced in October, 2014. A rapid notable increase of the 24-hour harmonic amplitude from October 19 to October 25 (Figure \irefFig5) was caused by the emergence of an active region (AR) NOAA 12192 that culminated on October 23. It was the largest naked-eye sunspot group since November 1990 (Sheeley and Wang, 2015). The amplitude of the 24-hour oscillations during the aforementioned time period exceeded 20 T (Figure \irefFig6), which is nearly 10% of the typical average level (200 T) of the SMMF during a cycle maximum (García et al., 1999).
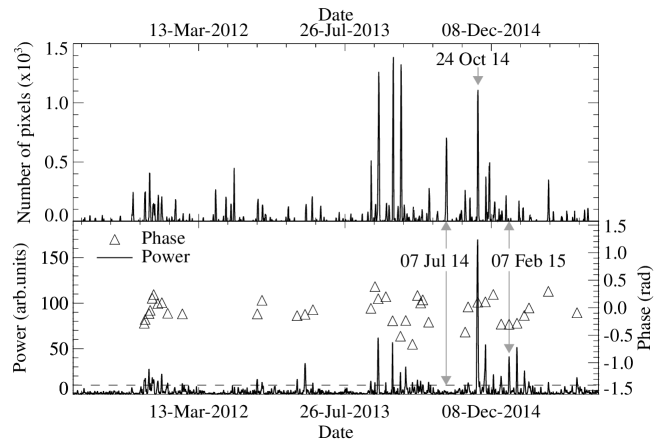
The apparent regularity of the SMMF high-frequency variations in Figure \irefFig6 motivated us to explore the phase of 24-hour harmonic (triangles in Figure \irefFig5, bottom panel). We derived the relative phase by the wavelet analysis at the moments when the 24-hour harmonic power exceeded the background level (bottom panel of Figure \irefFig5, dashed curve) at least tenfold. It was found that the phase remains quasi-stable during the five-year observation interval, which is expected assuming the artificial nature of the 24-hour harmonic. The phase deviation from the zero mean value does not exceed 0.5 rad and is caused by the data noise. The quasi-constant behavior of the phase explains why we observe artificial extrema in the SMMF at the same time instances around 12:00 UT (positive) and 00:00 UT (negative). The SMMF remains unperturbed at 06:00 UT and at 18:00 UT (except some specific days, see below). At these times the spacecraft velocity is close to zero (Liu, 2016) that confirms once again the orbital origin of 24-hour harmonic.
Liu et al. (2012) pointed out that in addition to the uncertainties in the calibration curve, the pixel saturation can also be a source of artificial periodicities. Simulations showed that HMI measurements become saturated every 12 hours when the measured magnetic fields exceed 3200 G (Liu et al., 2012). AR NOAA 12192 data did exhibit the saturation in October 2014 (Sun et al., 2015). Thus, magnetic field strength in the umbra of the south-east core of the following spot reached values down to -3300 G, while the west leading spot umbra had approximately 2400 G (Figure \irefFig7) according to the CrAO data. We calculated the temporal variations of the average field of the spots during four days. Only pixels with the absolute magnetic field exceeding 800 G were summed, negative and positive field separately. Results are shown in Figure \irefFig7, left panel. Both 12 and 24-hour periodicities are clearly seen in the averaged magnetic field of the sunspots. Oscillations of positive and negative fields are in opposite phase that probably could be explained by saturation effect: the field cannot exceed the saturation level and it remains stable or diminishes.
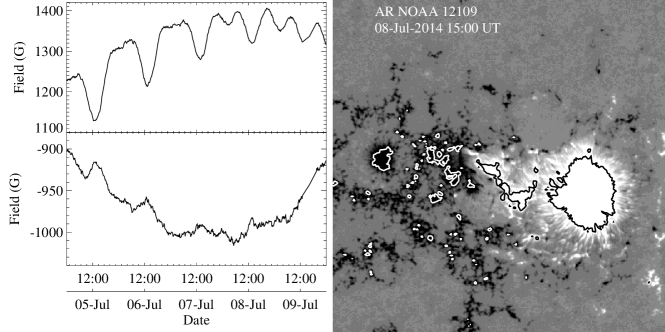
We performed the same procedure for a number of groups, namely AR NOAA 12032, 12033, 12034, 12108, 12109. The plot similar to Figure \irefFig7 for AR NOAA 12109 is shown in Figure \irefFig8. The leading spot umbra of AR NOAA 12109 had magnetic field strength exceeding 3500 G while AR NOAA 12032, 12033, 12034 leading spots did not exceed -2500 G (CrAO), i.e. we analyzed both saturated and unsaturated sunspots. The results of the calculations are: a) artificial periodicity, if exists, can exhibit both 12 and 24-hour time period regardless of the strength of the spot; b) negative and positive sunspot fields oscillate in opposite phase; c) in general, stronger sunspots exhibit greater artificial harmonic amplitudes; d) amplitudes of 12/24-hour harmonics can vary spontaneously.

The first result makes us unable to distinguish the contribution of saturation from that of the calibration curve uncertainties. Both factors can act simultaneously and in the same manner. Since positive and negative pixels of AR data oscillate in opposite phase and the harmonic amplitudes can vary spontaneously, the total signed flux of ARs can reveal artificial oscillation of either of two harmonics (or their sum - 36-hour time period as detected by Smirnova et al. (2013)) or reveal no oscillations at all. The latter, probably, can explain the medium correlation between the sunspots area and the 24-hour harmonic amplitude and the possible absence of 24-hour harmonic in the SMMF in the presence of strong sunspots. On the other hand, the opposite phase oscillations of pixels of different polarity implies that the resulting phase of AR’s magnetic field artificial periodicity can be determined by the dominant sunspot. This contradicts our above discussed result regarding the stable phase of the artificial periodicities in the SMMF. Changing the threshold value as well as integrating over constant size areas rather than over the pixels with certain values gave a similar outcome. Further investigations are needed to clarify the issue.
We performed brief analysis of the non-zero QUALITY magnetograms acquired at the HMI calibration times at 6:00 and 18:00 UT. The calibration is performed every day at the moments when the orbital velocity is close to zero. Pixel-by-pixel comparison of three consequent magnetograms acquired at, say, 05:48 UT, 06:00 UT, and 06:12 UT, generally shows no noticeable significant discrepancies between the magnetic field values. However, for two times a year this is not true for statistical moments such as mean value. The peculiarity of the magnetograms derived at calibration times is a sudden decrease of the SMMF at certain days of year. Daily spikes are observed from March 01 to 31 at 6:00 UT and from August 10 to September 12 at 18:00 UT (Figure \irefFig9). The exception was the leap year 2012 when the spikes started to appear on February 29th. The mean absolute amplitude of the spikes is 20 T in March and 15 T in August. Due to the calibration process certain filtergrams are lost, which may cause a zero-point offset of weak field pixels (Liu, 2016). Summation over the entire solar disk (more than 10 million pixels) leads to significant error in the SMMF determination. The reason why the effect becomes significant only twice a year remains unclear.

4 Conclusions
sec-Conclusions
SDO/HMI instrument provides SMMF data with 45 s and 720 s cadence that are not subjected to natural seeing or daylight variations. The SMMF values are in a very good agreement with the WSO mean field data, and the Pearson correlation coefficient for the two data sets equals 0.86. Despite of the different techniques and spectral lines used for the measurements, the agreement between two datasets is impressive. The conversion factor is very close to unity (0.99(2)) and can be used to ensure the consistency between these two datasets.
Meanwhile, at least two types of artifacts exist in the SDO/HMI SMMF data. The first one is the 24-hour and 12-hour oscillations caused by the orbital motion of the spacecraft. The amplitude of the oscillations can vary significantly, can reach values up to tens of microtesla, and is related, in part, to the varying area of the sunspots on the disk. We found, however, that these artificial harmonics are presented in the SMMF power spectrum most of the time regardless of the presence of sunspots. All in all during the five-year time period of observations the 24-hour harmonic power exceeded the background level for 75% of the time, whereas the triple background level was exceeded for 30% of the time. The effect might be caused by the collective contribution of a large number (more than 10 millions) of individual pixels summed over the entire disk, each of them exhibiting in-phase weak artificial oscillations in the magnetic field amplitude. This is probably why the 24-hour and 12-hour oscillations did not get attention in previous studies (Liu et al., 2012; Smirnova et al., 2013), where the integration was performed over relatively small areas of the solar disk.
The phase of the 24-hour harmonic remains quasi-stable as expected from the artificial nature of 24-hour oscillations. The maximum positive and negative perturbations of the SMMF are observed at 12:00 UT and at 00:00 UT correspondingly.
Acknowledgments
We thank Dr. V. Yurchyshyn for a careful reading of the manuscript and valuable suggestions and criticism that led to significant improvement of the manuscript. We also are grateful to Dr. Liu Yang for valuable information on SDO/HMI instrument, to V.I. Haneychuk for recommendation on SDO/HMI data processing. We thank the anonymous referee for his/her very useful comments and raised questions that helped us to improve the paper. SDO is a mission for NASA’s Living With a Star (LWS) program. The SDO/HMI data were provided by the Joint Science Operation Center (JSOC). Wilcox Solar Observatory data used in this study was obtained via the website http://wso.stanford.edu, courtesy of J.T. Hoeksema. The wavelet software provided by C. Torrence and G. Compo (available at http://paos.colorado.edu/research/wavelets/) was useful for developing software applied in this paper.
The reported study was supported by the RFBR research project 16-02-00221 A and the Presidium of the Russian Academy of Science Program 21.
References
- Babcock (1953) Babcock, H.W.: 1953, Astrophys. J. 118, 387. DOI ADS
- Boberg et al. (2002) Boberg, F., Lundstedt, H., Hoeksema, J.T., Scherrer, P.H., Liu, W.: 2002, J.Geophys. Res. A 107, 1318. DOI ADS
- Bremer (1996) Bremer, J.: 1996, Ann. Geophys. 39, 713. DOI
- Chaplin et al. (2003) Chaplin, W.J., Dumbill, A.M., Elsworth, Y., Isaak, G.R., McLeod, C.P., Miller, B.A., New, R., Pintér, B.: 2003, Mon. Not. Roy. Astron. Soc. 343, 813. DOI ADS
- García et al. (1999) García, R.A., Boumier, P., Charra, J., Foglizzo, T., Gabriel, A.H., Grec, G., Régulo, C., Robillot, J.M., Turck-Chièze, S., Ulrich, R.K.: 1999, Astron. Astroph. 346, 626. ADS
- Grigor’ev and Demidov (1987) Grigor’ev, V.M. Demidov, M.L.: 1987, Solar Phys. 114, 147. ADS
- Haneychuk, Kotov, and Tsap (2003) Haneychuk, V.I., Kotov, V.A., Tsap, T.T.: 2003, Astron. Astroph. 403, 1115. DOI ADS
- Howard (1974) Howard, R.: 1974, Solar Phys. 38, 283. DOI ADS
- Kotov and Severny (1985) Kotov, V. A., Severny, A. B.: 1983, Mean Magnetic Field of the Sun as a star. Catalogue 1968–1976, Soviet Geophysical Committee, Moscow (in Russian)
- Liu et al. (2012) Liu, Y., Hoeksema, J.T., Scherrer, P.H., Schou, J., Couvidat, S., Bush, R.I., Duvall, T.L., Hayashi, K., Sun, X., Zhao, X.: 2012, Solar Phys. 279, 295. DOI ADS
- Liu (2016) Liu, Y.: 2016, private communications.
- Neugebauer et al. (2000) Neugebauer, M., Smith, E.J., Ruzmaikin, A., Feynman, J., Vaughan, A.H.: 2000, Journal of Geophysical Research 105, 2315. DOI ADS
- Norton et al. (2006) Norton, A.A., Graham, J.P., Ulrich, R.K., Schou, J., Tomczyk, S., Liu, Y., Lites, B.W., López Ariste, A., Bush, R.I., Socas-Navarro, H., Scherrer, P.H.: 2006, Solar Phys. 239, 69. DOI ADS
- Pesnell, Thompson, and Chamberlin (2012) Pesnell, W.D., Thompson, B.J., Chamberlin, P.C.: 2012, Solar Phys. 275, 3. DOI ADS
- Scherrer et al. (1977) Scherrer, P.H., Wilcox, J.M., Kotov, V., Severny, A.B., Howard, R.: 1977, Solar Phys. 52. DOI ADS
- Scherrer et al. (1977) Scherrer, P.H., Wilcox, J.M., Svalgaard, L., Duvall, T.L., Jr., Dittmer, P.H., Gustafson, E.K.: 1977, Solar Phys. 54, 353. DOI ADS
- Scherrer et al. (1995) Scherrer, P.H., Bogart, R.S., Bush, R.I., Hoeksema, J.T., Kosovichev, A.G., Schou, J., Rosenberg, W., Springer, L., Tarbell, T.D., Title, A., Wolfson, C.J., Zayer, I., MDI Engineering Team: 1995, Solar Phys. 162, 129. DOI ADS
- Scherrer et al. (2012) Scherrer, P.H., Schou, J., Bush, R.I., Kosovichev, A.G., Bogart, R.S., Hoeksema, J.T., Liu, Y., Duvall, T.L., Zhao, J., Title, A.M., Schrijver, C.J., Tarbell, T.D., Tomczyk, S.: 2012, Solar Phys. 275, 207. DOI ADS
- Schou et al. (2012) Schou, J., Scherrer, P.H., Bush, R.I., Wachter, R., Couvidat, S., Rabello-Soares, M.C., Bogart, R.S., Hoeksema, J.T., Liu, Y., Duvall, T.L., Akin, D.J., Allard, B.A., Miles, J.W., Rairden, R., Shine, R.A., Tarbell, T.D., Title, A.M., Wolfson, C.J., Elmore, D.F., Norton, A.A., Tomczyk, S.: 2012, Solar Phys. 275, 229. DOI ADS
- Severny (1969) Severny, A.: 1969, Nature 224, 53. DOI ADS
- Severny et al. (1970) Severny, A., Wilcox, J.M., Scherrer, P.H., Colburn, D.S.: 1970, Solar Phys. 15, 3. DOI ADS
- Sheeley and DeVore (1986a) Sheeley, N.R., Jr., DeVore, C.R.: 1986, Solar Phys. 103, 203. DOI ADS
- Sheeley and DeVore (1986b) Sheeley, N.R., Jr., DeVore, C.R.: 1986, Solar Phys. 104, 425. DOI ADS
- Sheeley, DeVore, and Boris (1985) Sheeley, N.R., Jr., DeVore, C.R., Boris, J.P.: 1985, Solar Phys. 98, 219. DOI ADS
- Sheeley and Wang (2015) Sheeley, N.R., Jr., Wang, Y.-M.: 2015, Astrophys. J. 809, 113. DOI ADS
- Smirnova et al. (2013) Smirnova, V., Efremov, V.I., Parfinenko, L.D., Riehokainen, A., Solov’ev, A.A.: 2013, Astron. Astroph. 554, A121. DOI ADS
- Sun et al. (2015) Sun, X., Bobra, M.G., Hoeksema, J.T., Liu, Y., Li, Y., Shen, C., Couvidat, S., Norton, A.A., Fisher, G.H.: 2015, Astrophys. J. 804, L28. DOI ADS
- Torrence and Compo (1998) Torrence, C., Compo, G.P.: 1998, Bull. Am. Meteorol. Soc. 79, 61. DOI
- Wang, Nash, and Sheeley (1989) Wang, Y.-M., Nash, A.G., Sheeley, N.R., Jr.: 1989, Science 245, 712. DOI ADS