Identifying statistically significant patterns in gene expression data
Patrick E. McSharry1 and Edmund J. Crampin2,∗
1 Oxford Centre for Industrial and Applied Mathematics, Mathematical Institute, Oxford, OX1 3LB, UK and Department of Engineering Science, University of Oxford, Oxford, OX1 3PJ, UK, and 2 Centre for Mathematical Biology, Mathematical Institute, Oxford, OX1 3LB, UK, University Laboratory of Physiology, University of Oxford, Oxford, OX1 3PT.
To whom correspondence should be addressed.
Both authors contributed equally to this work.
Manuscript Date: 9th August 2002
Running head: Statistical significance in gene expression data
Abstract
Motivation
Clustering techniques are routinely applied to identify patterns of co-expression in gene expression data. Co-regulation, and involvement of genes in similar cellular function, is subsequently inferred from the clusters which are obtained. Increasingly sophisticated algorithms have been applied to microarray data, however, less attention has been given to the statistical significance of the results of clustering studies. We present a technique for the analysis of commonly used hierarchical linkage-based clustering called Significance Analysis of Linkage Trees (SALT).
Results
The statistical significance of pairwise similarity levels between gene expression profiles, a measure of co-expression, is established using a surrogate data analysis method. We find that a modified version of the standard linkage technique, complete-linkage, must be used to generate hierarchical linkage trees with the appropriate properties. The approach is illustrated using synthetic data generated from a novel model of gene expression profiles and is then applied to previously analysed microarray data on the transcriptional response of human fibroblasts to serum stimulation.
Availability
A set of MATLAB functions are available on request.
Contact
edmund.crampin@unimelb.edu.au
1 Introduction
The ability to measure expression levels of multiple genes simultaneously promises insights into the regulation of gene expression under both normal and pathological conditions. Gene expression data is now routinely collected using oligonucleotide and cDNA microarray technologies [Fodor et al., 1993, Pease et al., 1994, Schena et al., 1996]. Microarray experiments involve many separate steps in the preparation of samples, of the arrays themselves and in the subsequent image acquisition and analysis [Hauser et al., 1998]. However, as the reliability of the data improves, there is an increasing need for tools for data analysis and interpretation. While increasingly sophisticated clustering techniques are being applied to microarray data, the statistical significance of clustering results has yet to be fully explored.
A wide variety of statistical techniques have been used to investigate these gene expression profiles, including principal component analysis [Holter et al., 2000, Alter et al., 2000, Holter et al., 2001], correspondence analysis [Fellenberg et al., 2001], neural networks [Herrero et al., 2001] and the construction of statistical models [Zhao et al., 2001, Ramoni et al., 2002]. A common starting point for the analysis of microarray data is to use a clustering technique to group together genes with similar expression profiles [Wen et al., 1998, Eisen et al., 1998, Yeung and Ruzzo, 2001]. Genes exhibiting similar patterns suggest co-regulation of gene expression, and co-expressed genes may be involved in similar functions within the cell. The ultimate goal of such studies is to be able to predict the underlying gene networks giving rise to the gene expression data [Yeung et al., 2002].
In this paper we aim to determine the significance of the similarity between gene expression profiles. We deal with data collected over several time intervals (time series data), although the technique applies equally for gene expression data recorded over multiple separate experiments. In particular, we show how the significance of the number of clusters emerging from linkage analysis techniques can be assessed. Linkage analysis, a simple and widely used clustering technique, performs clustering by sorting the gene expression profiles according to pairwise similarity. A distance metric is used to quantify the similarity between genes, where the closer two genes are in distance the more similar are their expression patterns, i.e. the more likely they are to be co-expressed. The ordered gene expression profiles can be represented graphically using a tree (called a dendrogram) where the position of the branch connecting two genes reflects the similarity of their expression profiles. Sorting the genes in this way results in similar expression profiles being grouped together. Currently many investigators identify clusters of interest from the tree by both visual inspection and a priori knowledge. The tree identifies many different possible numbers of clusters, ranging from one extreme where there are as many clusters as genes (one per cluster) to the other extreme, where one cluster contains all genes in the data set. Cutting the tree at a particular distance value establishes a number of clusters into which the expression profiles are grouped.
The major difficulties in the analysis of microarray data, as for most data sets, arise in discriminating between signal and noise. Given limited data, there will always be a nonzero probability of incorrectly identifying noise as genuine co-expression. For microarray data the situation is exacerbated by the generally low number of observations made on large numbers of variables (genes). Any statistical test applied to the data must indicate an acceptable level of such ‘false positives’ arising. Statistical tests rely on assumptions made about what constitutes noise in the data set, against which a null hypothesis is tested. The nominal level of the statistical test will only be meaningful if the assumptions about the noise are correct, and the null hypothesis relevant to the data set. We use the method of surrogate data [Theiler et al., 1992, Smith, 1992] to determine a threshold on the tree at which we can reject, with a given confidence level, the null hypothesis that observed similarity values could have occurred by chance. This threshold can be used to determine which clusters are significant.
We demonstrate the approach (Significance Analysis of Linkage Trees, SALT) using synthetic gene expression data generated using a simple model, and subsequently apply the surrogate analysis technique to a publicly available gene expression data set which analyses the response of human fibroblasts to serum [Iyer et al., 1999].
2 Methods
Gene expression data is commonly expressed as the logarithm of the ratio of an observed signal to the initial or other reference expression level. Hence values are initially zero, and a positive value indicates up-regulation, whereas negative values represent down-regulation of gene expression, and up- and down-regulation are given equal numerical importance.
Synthetic Gene Expression Data
To illustrate how linkage clustering performs on a data set containing predetermined patterns of co-expression of genes, where gene clusters are known, we generated synthetic gene expression data. Six time-dependent response functions (labelled I to VI) were used to simulate early and late response, and up- and down-regulation expression patterns (Fig. 1).
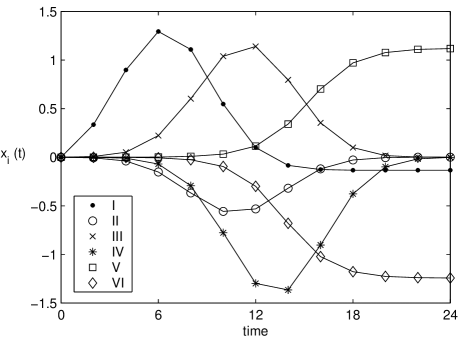
We used a Gaussian function to simulate genes switching on and off transiently during the experiment (response functions I through IV in Fig. 1) and a sigmoid function to replicate genes responding slowly during the experiment, to reach a new threshold expression level (response functions V and VI in Fig. 1). Here is a time delay for each of the six responses, and and are gene-specific delays and timescales.
A time series of points was used to mimic the change in gene expression data over a 24hr period. Our synthetic data set contained genes: genes for each of the six responses. Co-expressed genes may respond after different delays and over different timescales, and will show different amplitudes of expression. We incorporated such variation into the amplitudes of the gene expression profiles and the response times by representing the expression level for gene through , where stands for either up- or down-regulation with response function or , as described in Table 1. For each gene , the variation in the amplitude , time delay and timescale are sampled from uniform distributions with , and . In addition, we simulate observational uncertainty due to measurement errors by adding a normally distributed noise term with zero mean and standard deviation 0.05.
| Response | I | II | III | IV | V | VI |
|---|---|---|---|---|---|---|
| 7 | 10 | 12 | 14 | 15 | 14 |
Fibroblast Data Set
We used the published data set of Iyer et al. [1999] for the response of human fibroblasts to serum following serum starvation. Data was collected at 12 times over a 24hr period for around 8,600 distinct human transcripts. A further data point is included for exponentially growing cells (“unsynch”) to give a series of observations. Of these genes 517 were found to change expression levels in response to serum stimulation (for more information see Iyer et al. [1999] and the accompanying website http://genome-www.stanford.edu/serum). We restricted our analysis to these 517 genes.
Similarity Measure
In order to cluster a data set containing gene expression profiles using a linkage algorithm, a mathematical definition of the similarity between expressions is required. Two genes which are co-expressed are likely to be similar in shape, but not necessarily in magnitude and for this reason the correlation coefficient is a suitable similarity metric. Following Eisen et al. [1998], denoting the logarithm of the expression ratio for gene at time by , the similarity between genes and is quantified by , where and is the number of observations. Note that if the means were subtracted from each of the expression profiles then would be the standard deviation and the correlation coefficient [Chatfield, 1989]. By explicitly setting the mean to zero [Eisen et al., 1998], corresponding to an expression ratio of one, we are selecting a reference state against which subsequent changes are contrasted. Values of can vary from (completely correlated) to (completely anti-correlated), whereas implies that the two genes are uncorrelated.
The similarity measure takes negative values for anti-correlated data and so cannot be used as a distance between two observations. A distance measure can be calculated from using which fulfils the conditions required for a distance metric: namely (i) if and only if , i.e. the genes have the same expression profiles, (ii) and (iii) [Mantegna, 1999]. The unique distances (, ) can be used to determine a tree connecting genes using a graph consisting of linkage distances. Clearly, this reduction in the number of distances used to generate the tree implies a loss of information. The aggregation process for constructing the tree must be carefully chosen so that important information is not lost, and can be achieved by using a suitable linkage algorithm.
Clustering by Complete-Linkage
Linkage algorithms iteratively combine the genes into clusters. A measure of affinity between clusters is used to decide the order in which clusters are combined at any given step. Starting from clusters, each consisting of a single gene, the two clusters with the highest affinity are combined into a new cluster. This linkage is marked on the tree by a connection between the clusters at a linkage distance equal to the affinity value. This process is repeated until there is only one large cluster containing all genes. If the affinity between clusters is chosen to be the distance between the closest pair of genes then the method is known as single-linkage. The tree constructed with single-linkage is called a minimum spanning tree. This has the disadvantage that the linkage distance does not place a bound on how dissimilar genes within the same cluster may be. This is because the distances for each of the other pairings of genes between the clusters will be larger than the linkage distance, , by construction. Choosing the distance between the averages of the clusters as the measure of affinity is known as average-linkage, and is a choice commonly used in microarray data analysis [Eisen et al., 1998]. Similarly, for average-linkage does not place an upper bound on the pairwise distances within clusters.
We suggest that the appropriate linkage technique to choose is complete-linkage, where the maximal pairwise distance between clusters is used to determine the tree. At each step the two clusters with the smallest maximal pairwise distance are combined. Thus the tree contains maximal distances between clusters, and hence is appropriate for an analysis of statistical significance. In particular, for the complete-linkage algorithm all genes clustered below a threshold distance must be separated by distances satisfying . If we cut the tree at and ignore all linkages above then we are certain not to neglect any gene pairings which are separated by a distance . This property of the complete-linkage algorithm will be employed to obtain significant clusters.
It still remains to be decided at which distance to cut the tree, to determine the number of clusters which with high probability represent co-expression of their constituent genes. To obtain the distribution of distances that one would expect to find for genes which are not being co-expressed, we have generated surrogate data [Theiler et al., 1992, Smith, 1992].
Surrogate Gene Profiles
The SALT technique determines how small the distance between two genes must be before they are inferred to be co-expressed. This is achieved by testing against a particular null hypothesis: that a particular value of the distance arises by chance from two genes which are not co-expressed. We test this null hypothesis using the distribution of distances which results from genes that are not co-expressed. Since we do not have an analytical description for this distribution, we estimate it using surrogates gene expression profiles, generated by sampling from the original data set. A significance level must be specified at which the null hypothesis is tested. For example, if we allow a 5% chance that the null hypothesis is falsely rejected, then the test is valid at the 95% level. Testing at the 95% significance level means that we reject the null hypothesis for any distance in the tree less than a threshold distance corresponding to the 5th percentile of the distribution obtained from the surrogates. Each pair of surrogate gene expression profiles provides one sample of the distribution. A large number of surrogates (10000) was used to resolve the tail of the distribution, giving a robust estimate of the 5th percentile.
We generate surrogate expression profiles which preserve some aspects of the original data but which are also consistent with the null hypothesis. Appropriate surrogates should reflect obvious properties of the data, in particular that the gene expression profiles vary smoothly with time. An analysis of the probability density function (PDF) of the gene expression profiles for the fibroblast data set (the probability that, at a given time point, a gene selected at random from the data set will have a given expression level) shows that there is a time-dependent trend running through the data (Fig. 2). This suggests that surrogate data sets based on permutations which shuffle the temporal information are likely to destroy important correlations which are due to the time series nature of the experiment.
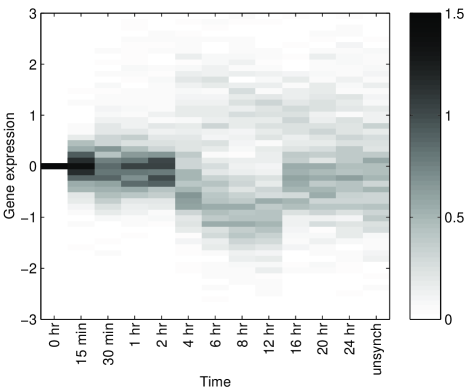
To preserve the temporal continuity we have constructed surrogate gene expression profiles by sampling without replacement from the original data at each time point independently. In this way the PDF of the gene expression at different time points (Fig. 2) is preserved in the surrogates.
We can then reject the null hypothesis for distances calculated from the original data for which with confidence 95%. The construction of the tree using complete-linkage algorithm ensures that for clusters below , the distance between every gene pair within a cluster is statistically significant. Note that this is not the case for the other linkage algorithms described above.
3 Implementation
We applied complete-linkage clustering to both the synthetic and fibroblast data sets. Surrogates were generated to find and this threshold was used to determine statistically significant clusters. We found that 10000 surrogates was sufficient to produce robust results when testing at the 95% significance level.
Synthetic data
The distances corresponding to the synthetic data set (Fig. 3) fall into distinct groups because of the clearly defined response profiles underlying the data (Fig. 1).
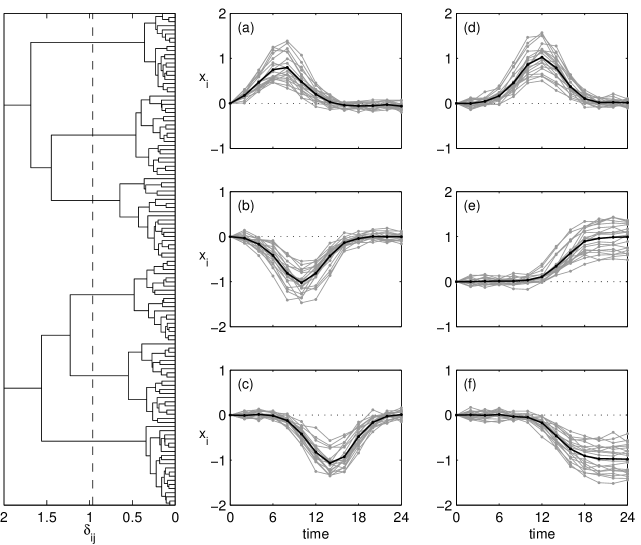
The tree (left) shows the hierarchical organisation of the linkage distances, indicating that the correct number of clusters can be identified by cutting the tree at a threshold distance in the range . Surrogate analysis provided a threshold distance of corresponding to the 95% significance level. This threshold correctly identifies the clusters, assigning the 20 genes for each response function to the corresponding cluster. The correspondence between the original responses (Fig. 1) and the clusters (Fig. 3) is given by: I (a), II (b), III (d), IV (c), V (e) and VI (f). Note that the expression profiles are clustered together, even though their magnitudes are different, because they have the same shape, as quantified by the choice of distance metric based on the correlation coefficient.
We expect that significantly higher noise levels will obscure the original pattern of gene expression. Increasing the observational noise in the synthetic data set was found to increase the linkage distances used to construct the tree, but not to have a strong influence on the threshold distance (data not shown). Many more of the distances in the data set are found to be consistent with the null hypothesis, and therefore not considered significant for clustering. In this case, a larger number of clusters than the six original responses is obtained by cutting the tree at the threshold distance, however, the members of each cluster were still found to correspond to only one of the six response functions.
Fibroblast Data Results
We applied the same surrogate data analysis technique to the 517 gene expression profiles in the published data set corresponding to fibroblast transcriptional response to serum stimulation. The published clustering for this data set found clusters corresponding to different aspects of the physiological response of fibroblasts to wound healing (serum stimulation). Iyer et al. used hierarchical clustering [using average-linkage, Eisen et al., 1998] from which they obtained clusters by visual inspection of the ordered tree, reporting cluster sizes of 142, 100, 60, 40, 32 and 31 genes for the six largest clusters.
We used surrogates to obtain a threshold distance of corresponding to the 95% significance level, which was used to cut the tree. The fifteen largest clusters obtained, those containing 10 or more genes, are shown in Fig. 4, along with the red-green display [Eisen et al., 1998] of the entire clustered data set, ordered by increasing mean expression value.
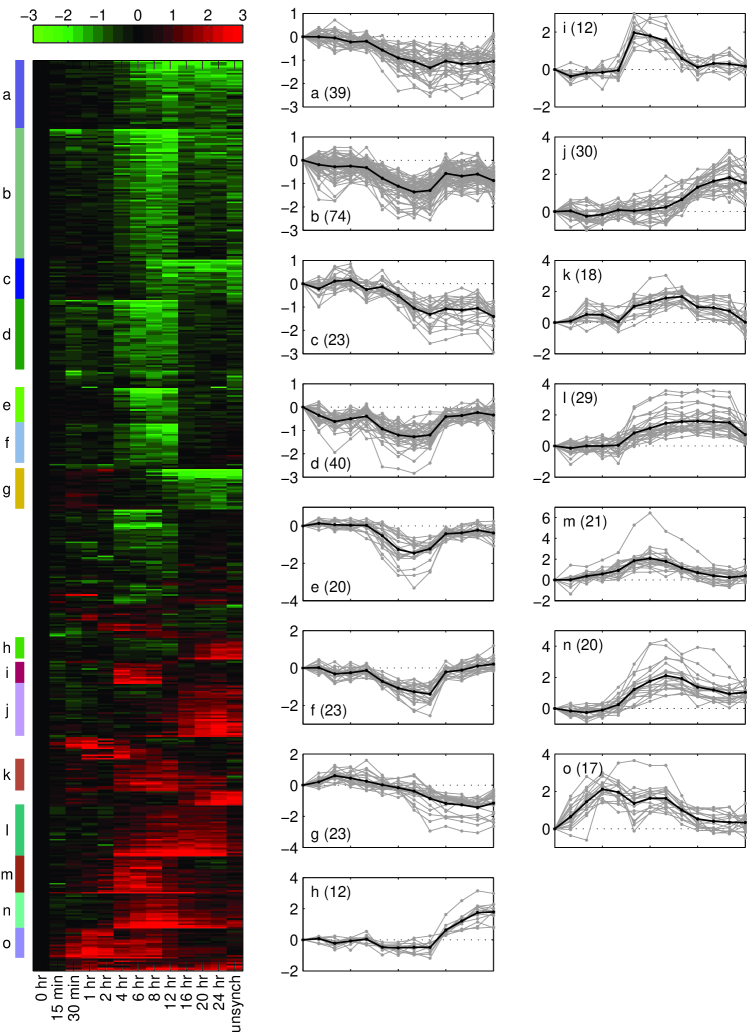
In total 47 statistically significant clusters were found, including 30 containing more than two genes. The maximum cluster size found to be of statistical significance by this technique is 74, and the six largest clusters are of size 74 (b), 40 (d), 39 (a), 30 (j), 29 (l) and 23 (c,f,g), suggesting that some of the correlations within the larger clusters reported previously may not be statistically significant.
4 Discussion
The measurement of gene expression data using DNA microarray techniques may provide a deeper understanding of many of the complicated processes underlying biological systems. To investigate the large data sets resulting from microarray experiments we have presented a new technique (SALT). This technique is straightforward and can be easily implemented in existing computer analysis packages.
SALT uses surrogate data analysis to identify clusters on the hierarchical tree generated using the complete-linkage algorithm, at a prescribed significance level. We have used surrogate data which preserves the temporal variation of the gene expression profiles. This is also the appropriate method for data collected for different experimental conditions or from different tissue preparations, in order to preserve characteristics of the data within the different experiments. A better understanding of the dynamical processes underlying the gene expression data and, in particular, the sources of measurement error, would allow surrogates to be constructed using better models of the properties of independent gene expression data.
The application of the technique to the published fibroblast data set found significant clusters containing fewer genes than previous analyses [Ramoni et al., 2002, Iyer et al., 1999]. One explanation is that previous analyses employ similarity values between data points which are not statistically significant to obtain their clusters. Studies using alternative methods of clustering in which the data is divided into a predetermined number of clusters (K-means clustering, for example) also risk grouping together genes for which the expression profiles have distances above the significance threshold.
Statistical significance testing using SALT could also be used for clustering other examples of large data sets where one wishes to identify which elements of a given set of profiles are (i) interacting with each other or (ii) interacting in a similar way in response to some external perturbation.
Acknowledgements
This research was supported by an Engineering and Physical Sciences Research Council Grant GR/N02641 to PEM and The Wellcome Trust (EJC).
References
- Alter et al. [2000] O. Alter, P. O. Brown, and D. Botstein. Singular value decomposition for genome-wide expression data processing and modeling. Proc. Natl. Acad. Sci. USA, 97:10101–10106, 2000.
- Chatfield [1989] C. Chatfield. The Analysis of Time Series. Chapman and Hall, London, 4th edition, 1989.
- Eisen et al. [1998] M. B. Eisen, P. T. Spellman, P. O. Brown, and D. Botstein. Cluster analysis and display of genome-wide expression patterns. Proc. Natl. Acad. Sci. USA, 95:14863–14868, 1998.
- Fellenberg et al. [2001] K. Fellenberg, N. C. Hauser, B. Brors, A. Neutzner, J. D. Hoheisel, and M. Vingron. Correspondence analysis applied to microarray data. Proc. Natl. Acad. Sci. USA, 98:10781–10786, 2001.
- Fodor et al. [1993] S. P. Fodor, R. P. Rava, X. C. Huang, A. C. Pease, C. P. Holmes, and C. L. Adams. Multiplexed biochemical assays with biological chips. Nature, 364:555–556, 1993.
- Hauser et al. [1998] N. C. Hauser, M. Vingron, M. Scheideler, B. Krems, K. Hellmuth, K. D. Entian, and J. D. Hoheisel. Transcriptional profiling on all open reading frames of saccharomyces cerevisiae. Yeast, 14:1209–1221, 1998.
- Herrero et al. [2001] J. Herrero, A. Valencia, and J. Dopazo. A hierarchical unsupervised growing neural network for clustering gene expression patterns. Bioinformatics, 17:126–136, 2001.
- Holter et al. [2000] N. S. Holter, M. Madhusmita, A. Maritan, M. Cieplak, and N. V. Banavar, J. R.and Fedoroff. Fundamental patterns underlying gene expression profiles: simplicity from complexity. Proc. Natl. Acad. Sci. USA, 97:18409–8414, 2000.
- Holter et al. [2001] N. S. Holter, A. Maritan, M. Cieplak, N. V. Fedoroff, and J. R. Banavar. Dynamic modeling of gene expression data. Proc. Natl. Acad. Sci. USA, 98:1693–1698, 2001.
- Iyer et al. [1999] V. R. Iyer, M. B. Eisen, D. T. Ross, G. Schuler, T. Moore, J. C. F. Lee, J. M. Trent, L. M. Staudt, J. Hudston Jr., M. S. Boguski, D. Lashkari, D. Shalon, D. Botstein, and P. O. Brown. The transcriptional program in the response of human fibroblasts to serum. Science, 283:83–87, 1999.
- Mantegna [1999] R. N. Mantegna. Hierarchical structure in financial markets. Eur. Phys. J. B, 11:193–197, 1999.
- Pease et al. [1994] A. C. Pease, D. Solas, E. J. Sullivan, M. T. Cronin, C. P. Holmes, and S. P. Fodor. Light-generated nucleotide arrays for rapid DNA sequence analysis. Proc. Natl. Acad. Sci. USA, 91:5022–5026, 1994.
- Ramoni et al. [2002] M. F. Ramoni, P. Sebastiani, and I. S. Kohane. Cluster analysis of gene expression dynamics. Proc. Natl. Acad. Sci. USA, 99:9121–9126, 2002.
- Schena et al. [1996] M. Schena, D. Shalon, R. Heller, A. Chai, P. O. Brown, and R. W. Davis. Parallel human genome analysis: microarray-based expression monitoring of 1000 genes. Proc. Natl. Acad. Sci. USA, 93:10614–10619, 1996.
- Smith [1992] L. A. Smith. Identification and prediction of low-dimensional dynamics. Physica D, 58:50–76, 1992.
- Theiler et al. [1992] J. Theiler, S. Eubank, A. Longtin, B. Galdrikan, and J. D. Farmer. Testing for nonlinearity in time series: the method of surrogate data. Physica D, 58:77, 1992.
- Wen et al. [1998] X. Wen, S. Fuhrman, G. S. Michaels, D. B. Carr, S. Smith, J. L. Barker, and R. Somogyi. Large-scale temporal gene expression mapping of central nervous system development. Proc. Natl. Acad. Sci. USA, 95:334–339, 1998.
- Yeung and Ruzzo [2001] K. Y. Yeung and W. L. Ruzzo. Principle component analysis for clustering gene expression data. Bioinformatics, 17:763–774, 2001.
- Yeung et al. [2002] M. K. S. Yeung, J. Tegnér, and J. J. Collins. Reverse engineering gene networks using singular value decomposition and robust regression. Proc. Natl. Acad. Sci. USA, 99:6163–6168, 2002.
- Zhao et al. [2001] L. P. Zhao, R. Prentice, and L. Breeden. Statistical modeling of large microarray data sets to identify stimulus-response profiles. Proc. Natl. Acad. Sci. USA, 98:5631–5636, 2001.