Wideband Excitation of Microbubbles with Chirps to Maximize the Sonoporation Efficiency and Contrast in Ultrasound Imaging
Abstract
The importance of the excitation bandwidth is well known in diagnostic ultrasound imaging. However, the effect of excitation bandwidth in therapeutic applications of microbubbles has been mostly overlooked. A majority of contrast agent production techniques generate polydisperse microbubble populations, so a wide range of resonance frequencies exist. Therefore, wideband excitation is necessary to fully utilize microbubble resonance behavior and maximize the reradiated energy from a microbubble population, both for imaging and therapy.
Oscillations of sixty SonoVue microbubbles in proximity of a rigid boundary were captured on a high speed camera at 3 Mfps, excited with a peak negative pressure of 50 kPa at 1 MHz. Measurements were analyzed according to their peak radiated pressure, radial oscillations, root mean squared pressure, and shear stress generated by microbubbles. Results showed that long duration and wideband excitation at low intensity levels was preferable for sonoporation, where microbubbles can be driven in a stable oscillation state without experiencing inertial cavitation or destruction.
I Introduction
Microbubbles (MBs) are used predominantly as ultrasound contrast agents for imaging applications; e.g. echocardiography Yeh and Nihoyannopoulos (2015), perfusion and Doppler imaging Tremblay-Darveau et al. (2014), and molecular imaging of cardiovascular diseases Lindner (2009). The therapeutic potential of MBs is mostly seen as a delivery mechanism such as sonoporation of endothelial cells to facilitate drug delivery Kooiman et al. (2011); Skachkov et al. (2014), enhancing DNA transfection using sonoporation Greenleaf et al. (1998); Qiu et al. (2012); Delalande et al. (2013), and localised drug delivery using acoustic radiation force Raiton et al. (2012).
Sonoporation of the cell membrane is generally pronounced as one of the main mechanisms that improves the cellular uptake Bao, Thrall, and Miller (1997); Delalande et al. (2013). Release of a drug can be spatiotemporally controlled by using ultrasonically triggered encapsulated MBs, which interact strongly with an ultrasonic field and oscillate. There are several hypothesis regarding to sonoporation and increasing the efficacy of ultrasound induced drug delivery. According to Escoffre et al. and Meng et al. MB destruction is a key parameters in sonoporation efficiency Escoffre et al. (2013); Meng et al. (2014). Karshafian et al. suggests that MB disruption is a necessary but an insufficient indicator of sonoporation Karshafian et al. (2009). However, it has been presented that cell viability decreases with the increasing acoustic pressure Karshafian et al. (2009); Qiu et al. (2012). The use of high power ultrasound, which leads to instantaneous bubble destruction, is causing concerns about biosafety of this technique Yeh and Nihoyannopoulos (2015). Stable cavitation, mechanical streaming and radiation forces are the main non-thermal effects obtained at low acoustic pressure levels, which makes the low-intensity reparable sonoporation a suitable candidate for therapeutic delivery Delalande et al. (2013). Therefore, a great deal of recent studies focus on maximizing the cell viability by using low intensity ultrasound Nejad et al. (2011); Qiu et al. (2012); Skachkov et al. (2014).
A MB should be excited at its natural frequency to achieve sonoporation at low intensities, where they absorb and therefore reradiate more acoustic energy. This localized energy may be used to target specific cell populations in the vasculature with minimal impact on the surrounding tissues. Resonant MBs also improve the separation between tissue and contrast agents with the application of contrast-specific methods such as pulse inversion and amplitude modulation and therefore resulting in a higher contrast-to-tissue ratio Harput et al. (2012); Harput (2012); Harput et al. (2013a, b). Most commercial phospholipid encapsulated MBs typically have a polydisperse size distribution (1-10 m), where a range of resonant frequencies would exist in a single population. The response of a polydisperse MB population to wideband and long duration excitation is stronger Harput et al. (2013a); McLaughlan et al. (2013), since more MBs can be excited close to their resonance frequency.
II Materials and Methods
To evaluate the effect of bandwidth, a high speed imaging setup was created to record the oscillations of MBs next to a boundary. The rigid boundary was decided to be the most relevant choice for the drug and gene delivery with targeted MBs and molecular imaging, because the development of a tumor can increase the stiffness of the vasculature and interstitial tissue, which will result in a rigid vessel wall Qin and Ferrara (2007).
Three different waveforms were used during the experiments and the results were analyzed by using 4 different metrics; root mean squared (RMS) pressure, peak radiated pressure, radial oscillations, and shear stress generated by MBs. A linear frequency modulated (LFM) chirp was generated with a center frequency of MHz, duration of 15 s, and fractional bandwidth of 75%. For comparison, a sinusoidal tone-burst was generated with a center frequency of MHz, and a duration of 15 s, and a Gaussian pulse was generated with a center frequency of MHz, and a fractional bandwidth of 75%. The reasons for choosing these waveforms were that the direct comparison of the LFM and the tone-burst reveals the effect of bandwidth, and the direct comparison of the LFM and the Gaussian pulse reveals the effect of signal duration on MB oscillations. Among these excitation signals LFM with the higher time-bandwidth product will give the highest SNR for imaging Misaridis and Jensen (2005); Harput et al. (2011).
A MHz V303-SM immersion transducer (Olympus-NDT Inc., Waltham, MA) with 75% fractional bandwidth was calibrated to generate an in situ peak negative pressure of kPa in a -Slide I (ibidi GmbH, Munich, Germany), where MBs from SonoVue (Bracco S.p.A, Milan, Italy) were individually imaged. The -Slide was placed on a Nikon Eclipse Ti-U inverted microscope (Nikon Corp., Tokyo, Japan), which was coupled to Cordin 550 high speed camera (Cordin Company, Salt Lake City, Utah) working at Mfps.
Oscillations of 60 MBs next to a rigid boundary were imaged with the described experimental setup above. A total of 4 measurements were discarded because of image noise, MB aggregation, and MB destruction (2 measurements). The remaining 56 recorded high speed measurements consisted of 10 Gaussian pulse, 22 sinusoidal tone-burst, and 24 LFM chirp excitations. Peak and bandwidth of the signals were measured by using linear interpolation Harput et al. (2014a).
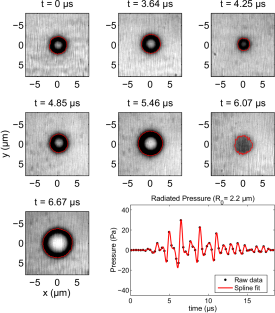
To estimate the acoustic pressure radiated from individual MBs, radial oscillations of MBs were calculated from the high-speed camera frames as shown in Fig. 1. First, the area of MBs were measured by using a global image thresholding method Otsu (1979) in Matlab (The MathWorks Inc., Natick, MA). The area of the MB, as highlighted with a red contour in Fig. 1, was later used to calculate the bubble radius, , with an assumption of a circular 2D MB footprint; . Finally, the emitted pressure, , in a liquid with the density of was calculated at a distance of from the bubble center as Morgan et al. (2000)
| (1) |
III Results and Discussion
Peak pressure is one of the most significant metrics for contrast-enhanced ultrasound imaging with targeted or un-targeted MBs, since image contrast is directly proportional with the pressure. Fig. 2 shows the peak pressure values calculated at mm and their average value. The peak radiated pressure was defined as the largest of peak negative pressure or peak positive pressure; .
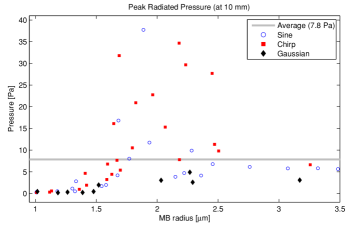
None of the MBs excited by a Gaussian pulse has generated a peak pressure value above the average of Pa due to the low energy content of the pulsed excitation. Long duration waveforms have generated higher peak pressure values, where 23% (5 out of 22) of sinusoidal tone-burst excitations, and 46% (11 out of 24) of LFM chirp excitations were above the average pressure level. Although long duration excitation has the potential to increase the image contrast, it results in poor image resolution. For sinusoidal tone-burst excitation, the resolution cannot be improved; however, a matched filter will recover the resolution of a chirp signal by compressing the scattered energy with a certain chirp rate into a single pulse Harput et al. (2014b). Therefore, chirp excitation is the most suitable excitation method for contrast-enhanced ultrasound imaging Harput, McLaughlan, and Freear (2015).
Although, the emitted acoustic pressure is an effective method to analyze the MB behavior, the peak radiated pressure is not an ideal metric to evaluate the MB response for both imaging and therapy. Sonoporation can be defined as the transient increase in the cell membrane permeability and porosity; however it is difficult to define a sonoporation threshold based on the ultrasonic exposure parameters. Greenleaf et al. observed the gene transfection threshold at a spatial average peak positive pressure of 0.12 MPa at 1 MHz with Albunex MBs Greenleaf et al. (1998). Wu et al. shown that the shear stress threshold for sonoporation generated by microstreaming was determined to be Pa at kHz Wu, Ross, and Chiu (2002). Kooiman et al. reported that targeted lipid-coated MBs induced drug uptake in endothelial cells when their relative vibration amplitude was larger than for a peak negative pressure as low as 80 kPa at 1 MHz Kooiman et al. (2011). Therefore, the shear stress values and the radial oscillations of MBs were calculated to assess their sonoporation efficiency.
The shear stress generated by an oscillating MB can be defined as Wu, Ross, and Chiu (2002)
| (2) |
where is the density of liquid, is the viscosity of liquid, is the initial bubble radius, and is the angular frequency.
After analyzing all 56 measurements, a maximum shear stress value of 31 kPa and a minimum shear stress value of 35 Pa were calculated with an average of 6 kPa. The average shear stress generated by Gaussian pulse, sinusoidal tone-burst, and chirp excitations were kPa, kPa, and kPa respectively. These values indicate that it is possible to achieve sonoporation for all excitation methods at as low as 50 kPa peak negative pressure, where MB destruction is observed in only 3.3% of all measurements. Chirp excitation is generated 3 and 9 fold higher stress compared to sinusoidal tone-burst and Gaussian pulse excitations on average, and therefore it is the most effective excitation method used in this study.
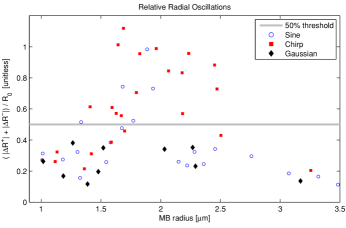
Fig. 3 shows the relative radial oscillations, which is the sum of the maximum radial expansion and compression; . Analysis of relative radial oscillations resulted in similar conclusions with the peak pressure analysis. None of the MBs excited by a Gaussian pulse has generated radial oscillations above the 50% threshold. Most of the MBs (63%) excited by a chirp have generated larger radial oscillations than 50%. For sinusoidal tone-burst excitation, however, only 23% of MBs have generated more than 50% radial oscillations.
The peak radiated pressure, shear stress, and relative radial oscillations are metrics that based on peak values, where the temporal effects are disregarded. Therefore, the root mean squared (RMS) pressure is used to summarize the general MB behavior as
| (3) |
where and are the time interval, and is the pressure calculated by Eq. (1) at mm.
Fig. 4 shows the scattered RMS pressure from MBs. The resonant MBs were between m and m radius for chirp and Gaussian pulse excitations, and m and m radius for the sinusoidal tone-burst excitation.
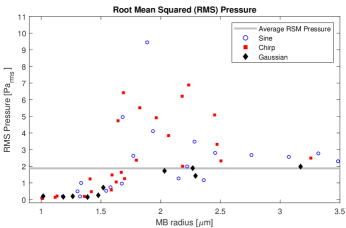
The tone-burst excitation has the largest peak amongst all excitations in Fig. 4, but the narrowband sinusoidal waveform will efficiently drive only a small subpopulation of polydisperse MBs. Even for monodisperse MBs, the resonance frequency shifts as a function of distance between the MB and arterial wall Qin and Ferrara (2007). Therefore, it is difficult to maximize therapeutic efficiency with MBs using a narrowband excitation, which is also not suitable for imaging. The response from the MB population when excited by a Gaussian pulse, shown in Fig. 4, is weaker than the chirp excitation due to its lower energy content. The chirp excitation generates the ideal microbubble response for imaging compared to the other methods thanks to high pressure generation for a wide range of MBs. There is a smaller deviation between the peak and average RMS pressure values for chirp excitation that makes it possible to control the behavior of a larger portion of the MB population.
IV Conclusions
The resonance behavior increases the radiated pressure from MBs at a specific frequency that can be beneficial in both diagnostic and therapeutic ultrasound. However, dynamics of MBs change when they are injected into the blood stream. For a rigid boundary, the natural frequency shifts toward the lower frequency region when the distance between the bubble and the boundary is reduced. Near to an elastic boundary, the MB natural frequency can both decrease and increase Doinikov, Aired, and Bouakaz (2011). Therefore, to trigger the resonance behavior for a larger amount of the MB population, a wideband excitation is necessary.
The resonance behavior precipitates strong MB oscillations, which can result in inertial cavitation and cause cell death at high pressure levels. Therefore, therapeutic ratio, which defined as the ratio of permeabilised to nonviable cells, is used to measure the sonoporation efficiency Karshafian et al. (2009). Although there are opposing views regarding to sonoporation, therapeutic efficiency is usually inversely proportional with cell death, which can be prevented by using low intensity ultrasound. The acoustic energy lost by reducing the intensity can be compensated by increasing the duration of the excitation. Findings of Nejad et al. showed that inertial cavitation, which causes lethal sonoporation, is observed in a microsecond time scale and low intensity ultrasound sonoporation happened on a time scale of millisecond Nejad et al. (2011), which also favors the use of long duration waveforms. Therefore, this study concludes that wideband and long duration excitation at low intensity levels is preferable for sonoporation, where MBs can be driven in a stable oscillation state without experiencing inertial cavitation.
Acknowledgment
This work was supported by EPSRC grant EP/K029835/1. J. M. would like to acknowledge Leverhulme fellowship ECF-2013-247. The Cordin 550 high speed camera was borrowed from EPSRC Engineering Instrument Pool (Loan 3793).
References
- Yeh and Nihoyannopoulos (2015) J. Yeh and P. Nihoyannopoulos, in Introduction to Translational Cardiovascular Research, edited by D. V. Cokkinos (Springer International Publishing, 2015) pp. 465–500.
- Tremblay-Darveau et al. (2014) C. Tremblay-Darveau, R. Williams, L. Milot, M. Bruce, and P. Burns, IEEE Trans. Ultrason. Ferroelectr. Freq. Control 61, 1988 (2014).
- Lindner (2009) J. R. Lindner, Nat Rev Cardiol 6, 475 (2009).
- Kooiman et al. (2011) K. Kooiman, M. Foppen-Harteveld, A. F. van der Steen, and N. de Jong, Journal of Controlled Release 154, 35 (2011).
- Skachkov et al. (2014) I. Skachkov, Y. Luan, A. van der Steen, N. de Jong, and K. Kooiman, IEEE Trans. Ultrason. Ferroelectr. Freq. Control 61, 1661 (2014).
- Greenleaf et al. (1998) W. J. Greenleaf, M. E. Bolander, G. Sarkar, M. B. Goldring, and J. F. Greenleaf, Ultrasound Med. Biol. 24, 587 (1998).
- Qiu et al. (2012) Y. Qiu, C. Zhang, J. Tu, and D. Zhang, Journal of Biomechanics 45, 1339 (2012).
- Delalande et al. (2013) A. Delalande, S. Kotopoulis, M. Postema, P. Midoux, and C. Pichon, Gene 525, 191 (2013).
- Raiton et al. (2012) B. Raiton, J. McLaughlan, S. Harput, P. Smith, D. M. J. Cowell, and S. Freear, Applied Physics Letters 101, 044102 (2012).
- Bao, Thrall, and Miller (1997) S. Bao, B. D. Thrall, and D. L. Miller, Ultrasound Med. Biol. 23, 953 (1997).
- Escoffre et al. (2013) J. Escoffre, A. Novell, J. Piron, A. Zeghimi, A. Doinikov, and A. Bouakaz, IEEE Trans. Ultrason. Ferroelectr. Freq. Control 60, 46 (2013).
- Meng et al. (2014) L. Meng, F. Cai, P. Jiang, Z. Deng, F. Li, L. Niu, Y. Chen, J. Wu, and H. Zheng, Applied Physics Letters 104, 073701 (2014).
- Karshafian et al. (2009) R. Karshafian, P. D. Bevan, R. Williams, S. Samac, and P. N. Burns, Ultrasound Med. Biol. 35, 847 (2009).
- Nejad et al. (2011) S. M. Nejad, S. H. R. Hosseini, H. Akiyama, and K. Tachibana, Biochem. Biophys. Res. Commun. 413, 218 (2011).
- Harput et al. (2012) S. Harput, J. McLaughlan, P. R. Smith, D. M. J. Cowell, S. D. Evans, and S. Freear, in IEEE Ultrasonics Symposium (2012) pp. 1930–1933.
- Harput (2012) S. Harput, Use of Chirps in Medical Ultrasound Imaging, Ph.D. Thesis, School of Electronic and Electrical Engineering, University of Leeds, UK (2012).
- Harput et al. (2013a) S. Harput, M. Arif, J. McLaughlan, D. M. J. Cowell, and S. Freear, IEEE Trans. Ultrason. Ferroelectr. Freq. Control 60, 2532 (2013a).
- Harput et al. (2013b) S. Harput, M. Arif, J. McLaughlan, P. R. Smith, D. M. J. Cowell, and S. Freear, in IEEE International Ultrasonics Symposium (IUS) (2013) pp. 1501–1504.
- McLaughlan et al. (2013) J. McLaughlan, N. Ingram, P. R. Smith, S. Harput, P. L. Coletta, S. Evans, and S. Freear, IEEE Trans. Ultrason. Ferroelectr. Freq. Control 60, 2511 (2013).
- Qin and Ferrara (2007) S. Qin and K. W. Ferrara, Ultrasound Med. Biol. 33, 1140 (2007).
- Misaridis and Jensen (2005) T. Misaridis and J. A. Jensen, IEEE Trans. Ultrason., Ferroelectr., Freq. Control 52, 177 (2005).
- Harput et al. (2011) S. Harput, T. Evans, N. Bubb, and S. Freear, IEEE Trans. Ultrason., Ferroelectr., Freq. Control 58, 2096 (2011).
- Harput et al. (2014a) S. Harput, J. McLaughlan, D. M. Cowell, and S. Freear, in IEEE International Ultrasonics Symposium (IUS) (2014) pp. 440–443.
- Otsu (1979) N. Otsu, IEEE Trans. Syst., Man, Cybern. 9, 62 (1979).
- Morgan et al. (2000) K. E. Morgan, J. S. Allen, P. A. Dayton, J. E. Chomas, A. L. Klibanov, and K. W. Ferrara, IEEE Trans. Ultrason. Ferroelectr. Freq. Control 47, 1494 (2000).
- Harput et al. (2014b) S. Harput, J. McLaughlan, D. M. J. Cowell, and S. Freear, IEEE Trans. Ultrason. Ferroelectr. Freq. Control 61, 1802 (2014b).
- Harput, McLaughlan, and Freear (2015) S. Harput, J. McLaughlan, and S. Freear, in IEEE Ultrasonics Symposium (2015) pp. 1–4.
- Wu, Ross, and Chiu (2002) J. Wu, J. P. Ross, and J.-F. Chiu, The Journal of the Acoustical Society of America 111, 1460 (2002).
- Doinikov, Aired, and Bouakaz (2011) A. A. Doinikov, L. Aired, and A. Bouakaz, Phys. Med. Biol. 56, 6951 (2011).