The stellar mass distribution of
S4G disk galaxies
Abstract
We use 3.6 m imaging from the S4G survey to characterize the typical stellar density profiles () and bars as a function of fundamental galaxy parameters (e.g. the total stellar mass ), providing observational constraints for galaxy simulation models to be compared with. We rescale galaxy images to a common frame determined by the size in physical units, by their disk scalelength, or by their bar size and orientation. We stack the resized images to obtain statistically representative average stellar disks and bars. For a given bin (), we find a significant difference in the stellar density profiles of barred and non-barred systems that gives evidence for bar-induced secular evolution of disk galaxies: (i) disks in barred galaxies show larger scalelengths and fainter extrapolated central surface brightnesses, (ii) the mean surface brightness profiles of barred and non-barred galaxies intersect each other slightly beyond the mean bar length, most likely at the bar corotation, and (iii) the central mass concentration of barred galaxies is larger (by almost a factor 2 when ) than in their non-barred counterparts. We also show that early- and intermediate-type spirals () host intrinsically narrower bars than the later types and S0s, whose bars are oval-shaped. We show a clear correlation between galaxy family and bar ellipticity.
keywords:
galaxies: structure - galaxies: evolution - galaxies: barred - galaxies: statistics1 Introduction
Approximately two-thirds of the galaxies in the local universe are barred (e.g. [Knapen et al. (2000), Knapen et al. 2000], [Laurikainen et al. (2004), Laurikainen et al. 2004]). Simulation models predict that bars participate in the redistribution of stars and gas inside the galactic disk (e.g. [Athanassoula (2013), Athanassoula 2013]) by pushing them outwards (inwards) beyond (within) corotation. Bars are expected to increase the disk size (e.g., ; [, Athanassoula Misiriotis 2002]; ; ; ) and the central mass concentration after the bar-funneled cold gas is turned into stars (e.g., ; [, Wada Habe 1992]). Using 2-D decompositions, [, Sánchez-Janssen Gadotti (2013)] found observational evidence for the bar-driven disk evolution.
2 1-D average stellar density profiles
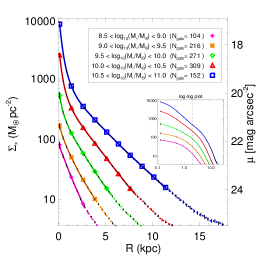
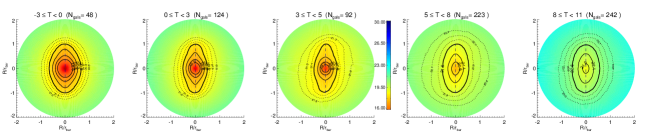
We use the 3.6 m photometry from the Spitzer Survey of Stellar Structure (S4G; [Sheth et al. (2010), Sheth et al. 2010]) for 1154 disk galaxies (). [Díaz-García et al. (2016), Díaz-García et al. (2016)] de-projected and Fourier decomposed the images in a polar grid using the NIR-QB code ([Salo et al. (1999), Salo et al. 1999]; [Laurikainen Salo (2002), Laurikainen Salo 2002]). Here, we resize the radial amplitudes () to a common frame defined by (i) the extent of the disks in physical units, and (ii) the disk scalelength (, from [Salo et al. (2015), Salo et al. 2015]). We stack the rescaled profiles to obtain 1-D average stellar density profiles () in bins of (from [Muñoz-Mateos et al. (2015), Muñoz-Mateos et al. 2015]) and Hubble type (Fig. 1). For all the bins, the resulting profiles show an exponential decay down to at least . The disk central surface brightness and scalelength of the mean increase with increasing . We show that central mass concentrations in massive systems () are substantially larger than in less massive galaxies on average. For the faintest systems, the mean presents hardly any deviation from the exponential disk.
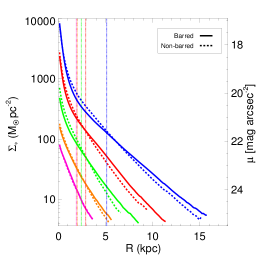
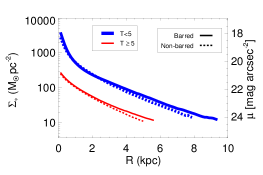
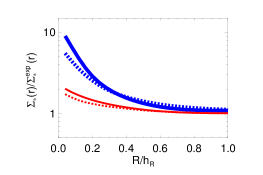
We find observational evidence for bar-induced secular evolution of a representative sample of disk galaxies, which is independent of any decomposition technique. For , there is a significant difference in the mean between barred and non-barred systems, which is clear both for early- () and late-type () systems (shown in Fig. 1): (i) disks in barred galaxies present larger scalelengths and fainter extrapolated central surface brightnesses; (ii) the average of barred and non-barred galaxies intersect each other very close to the mean bar length; and (iii) the central mass concentration of barred galaxies is larger (by almost a factor 2 when ) than in their non-barred counterparts.
3 2-D stacked stellar bars
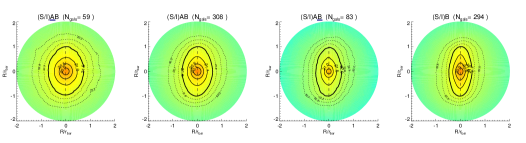
Roughly 2/3 of the galaxies in our sample are barred according to [Buta et al. (2015), Buta et al. (2015)]. Prior to obtaining 2-D bar stacks, the images of barred galaxies are reconstructed from the Fourier modes and rotated with respect to the bar major axis, so that the final bar position angle is zero. If the spiral arms wind anticlockwise in the sky, we perform a geometric reflection across the bar major axis to make them winding clockwise. Finally, we resize the reoriented image to a grid of radius 3 times the bar radius.
In Fig. 2 we show 2-D synthetic bars resulting from co-adding the rescaled images in bins of total stellar mass and galaxy family (B/AB/A/B, from [Buta et al. (2015), Buta et al. 2015]). We show that bars are oval-shaped among lenticular galaxies, and look intrinsically narrower in early- and intermediate-type spirals (). However, among early-types the bar shape is rounded off by bulges and barlenses ([Laurikainen et al. (2011), Laurikainen et al. 2011]) in the inner parts. We also show a clear dependence of the bar ellipticity on the galaxy family.
Acknowledgements.
We acknowledge financial support to the DAGAL network from the People Programme (Marie Curie Actions) of the European Union’s Seventh Framework Programme FP7/2007- 2013/ under REA grant agreement number PITN-GA-2011-289313.References
- [Athanassoula (1992)] Athanassoula, E. 1992, MNRAS, 259, 328
- [Athanassoula Misiriotis (2002)] Athanassoula, E. Misiriotis, A. 2002, MNRAS, 330, 35
- [Athanassoula (2012)] Athanassoula, E. 2012, MNRAS, 426, L46
- [Athanassoula (2013)] Athanassoula, E. 2013, Bars and secular evolution in disk galaxies: Theoretical input, ed. J. Falcón-Barroso J. H. Knapen, 305
- [Buta et al. (2015)] Buta, R. J., Sheth, K., Athanassoula, E., et al. 2015, ApJS, 217, 32
- [Debattista et al. (2006)] Debattista, V. P., Mayer, L., Carollo, C. M. et al. 2006, ApJ, 645, 209
- [Díaz-García et al. (2016)] Díaz-García, S., Salo, H., Laurikainen, E., Herrera-Endoqui, M. 2016, AA, 587, A160
- [Herrera-Endoqui et al. (2015)] Herrera-Endoqui, M., Díaz-García, S., Laurikainen, E., Salo, H. 2015, AA, 582, A86
- [Hohl (1971)] Hohl, F. 1971, ApJ, 168, 343
- [Knapen et al. (2000)] Knapen, J. H., Shlosman, I., Peletier, R. F. 2000, ApJ, 529, 93
- [Laurikainen Salo (2002)] Laurikainen, E. Salo, H. 2002, MNRAS, 337, 1118
- [Laurikainen et al. (2004)] Laurikainen, E., Salo, H., Buta, R. 2004, ApJ, 607, 103
- [Laurikainen et al. (2011)] Laurikainen, E., Salo, H., Buta, R., Knapen, J. H. 2011, MNRAS, 418, 1452
- [Minchev et al. (2011)] Minchev, I., Famaey, B., Combes, F., 2011, AA, 527, A147
- [Muñoz-Mateos et al. (2015)] Muñoz-Mateos, J. C., Sheth, K., Regan, M., et al. 2015, ApJS, 219, 3
- [Salo et al. (1999)] Salo, H., Rautiainen, P., Buta, R., et al. 1999, AJ, 117, 792
- [Salo et al. (2015)] Salo, H., Laurikainen, E., Laine, J., et al. 2015, ApJS, 219, 4
- [Sánchez-Janssen Gadotti (2013)] Sánchez-Janssen, R. Gadotti, D. A. 2013, MNRAS, 432, L56
- [Sheth et al. (2010)] Sheth, K., Regan, M., Hinz, J. L., et al. 2010, PASP, 122, 1397
- [Wada Habe (1992)] Wada, K. Habe, A. 1992, MNRAS, 258, 82