Recent galaxy mergers and residual star formation of red sequence galaxies in galaxy clusters
Abstract
This study explored the GALEX ultraviolet (UV) properties of optical red sequence galaxies in 4 rich Abell clusters at . In particular, we tried to find a hint of merger-induced recent star formation (RSF) in red sequence galaxies. Using the NUV colors of the galaxies, RSF fractions were derived based on various criteria for post-merger galaxies and normal galaxies. Following correction, about 36% of the post-merger galaxies were classified as RSF galaxies with a conservative criterion (NUV ), and that number was doubled ( 72%) when using a generous criterion (NUV ). The trend was the same when we restricted the sample to galaxies within R200. Post-merger galaxies with strong UV emission showed more violent, asymmetric features in the deep optical images. The RSF fractions did not show any trend along the clustocentric distance within R200. We performed a Dressler-Shectman test to check whether the RSF galaxies had any correlation with the sub-structures in the galaxy clusters. Within R200 of each cluster, the RSF galaxies did not appear to be preferentially related to the clusters’ sub-structures. Our results suggested that only 30% of RSF red sequence galaxies show morphological hints of recent galaxy mergers. This implies that internal processes (e.g., stellar mass-loss or hot gas cooling) for the supply of cold gas to early-type galaxies may play a significant role in the residual star formation of early-type galaxies at a recent epoch.
Subject headings:
galaxies: clusters: individual (Abell 119, Abell 2670, Abell 3330, Abell 389) – galaxies: star formation – ultraviolet: galaxies1. Introduction
The origin of residual star formation in early-type galaxies is still under debate. Since the launch of the GALEX (Galaxy Evolution Explorer) ultraviolet (UV) space telescope (Martin et al., 2005), it has been discovered that about 30% of massive early-type galaxies at 0.1 show a hint of recent star formation (RSF) at a level of 1–3% of their stellar mass (Kaviraj et al., 2007). Galaxy mergers have been suggested as a primary driver of this phenomenon (Yi et al., 2005; Kaviraj et al., 2007). Another reason may be gas cooling in elliptical galaxies (Mathews & Brighenti, 2003; Valentini & Brighenti, 2015). However, due to the difficulties in detecting signs of galaxy mergers and gas cooling in early-type galaxies, the residual star formation in early-type galaxies has only been investigated in detail for a few individual galaxies equipped with deep optical or X-ray images (Fabbiano & Schweizer, 1995; O’Sullivan, Forbes, & Ponman, 2001). Several studies have therefore highlighted the need for deep optical imaging surveys of early-type galaxies (Kaviraj et al., 2009; Salim & Rich, 2010).
In Sheen et al. (2012), post-merger galaxies were identified among massive red sequence galaxies (M) in rich Abell clusters at using deep optical images. The galaxies’ features suggested that they had gone through galaxy mergers relatively recently ( 0.5). Although their optical colors indicated that they were dominated by old stellar populations, as in typical early-type galaxies, their post-merger features suggested that they may have had a certain level of star formation induced by recent merger events.
We explored the GALEX UV-optical colors of red sequence galaxies in Abell 119, Abell 2670, Abell 3330, and Abell 389 at 0.044, 0.076, 0.089, and 0.112, respectively, in order to investigate the relation between recent galaxy mergers and the residual star formation of red sequence galaxies in galaxy clusters. One of the most effective ways to investigate recent star formation is to measure UV light from the galaxies, as the UV light is very sensitive to the existence of stellar populations younger than 1 Gyr. By combining deep UV and optical images of the four rich Abell clusters, a data set providing robust clues on mass-assembly histories as well as on the star formation histories of red sequence galaxies was established.
The UV-optical data and galaxy samples are described in Section 2. In Section 3, the RSF fractions for post-merger galaxies and normal galaxies are derived under various conditions, including correction, RSF criterion, and distance from the cluster center. The morphological properties, stellar populations and spatial distributions of the RSF galaxies are presented in Section 4, and the results are discussed in Section 5.
2. Data and Galaxy Samples
GALEX UV images of three clusters (A2670, A3330, and A389) were taken in Deep Imaging Survey (DIS) mode to study UV upturn phenometnon in early-type galaxies (Ree et al., 2007). A119 imaging was performed in Medium Imaging Survey (MIS) mode. The GALEX exposure times for the cluster samples are presented in Table 1. UV catalogs of the target clusters were obtained from the GALEX GR7 Data Release. The Galactic extinction was corrected for GALEX FUV and NUV magnitudes using the formulas and , as in Wyder et al. (2005).
| Cluster | EXPFUV | EXPNUV | NUV detection rates |
|---|---|---|---|
| (hours) | (hours) | among RSspec (%) | |
| A119 | 0.8 | 0.8 | 79.1 (53/67)aaGalaxy counts are presented in the parentheses. |
| A2670 | 6.0 | 8.6 | 84.4 (81/96) |
| A3330 | 6.3 | 16.7 | 85.5 (53/62) |
| A389 | 6.0 | 8.7 | 94.4 (57/61) |
| Total | … | … | 85.3 (244/286) |
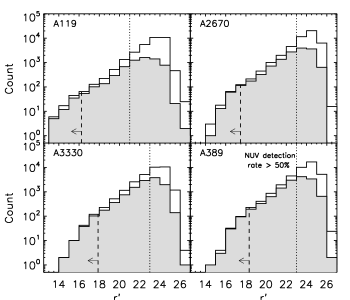
Optical photometric catalogs were established from the deep optical images taken with the MOSAIC II CCD on the Blanco 4-m telescope at CTIO. The galaxy magnitudes in the bands were measured with the Auto_Magnitude (MAG_AUTO) of the SExtractor (Bertin & Arnouts, 1996), and their Galactic foreground extinction was corrected using reddening maps from Schlegel, Finkbeiner, & Davis (1998). The optical catalogs were then matched with the GALEX UV catalogs using a 6 matching radius. Figure 1 presents galaxy histograms of MOSAIC II optical catalogs and the matched GALEX UV catalogs. In the figure, the filled histograms represent galaxies matched with valid (note that GALEX photometry failed to derive magnitudes on some detections) NUV magnitudes. NUV detection rates were higher than 50% for galaxies brighter than in A2670, A3330, and A389, which were taken in DIS mode. For A119, which had GALEX images in MIS mode, the limit for a 50% NUV detection rate was . To provide a guide for our galaxy samples, the magnitude limit (M) was approximately calculated using the distance modulus of each cluster (36.25, 37.46, 37.88, and 38.32 for A119, A2670, A3330, and A389, respectively) and was indicated with a dashed line on the figure. Our galaxy samples had magnitudes above and below these limits, as the absolute magnitude of each galaxy was calculated based on its own spectroscopic redshift.
Optical red sequence galaxies were identified from the vs M color-magnitude relations (CMRs) of the spectroscopic members of the clusters. As introduced in Sheen et al. (2012), the cluster memberships were assigned using the velocity distributions from the spectra taken by a multi-object spectrograph, Hydra, on the Blanco 4-m telescope at CTIO. For A119 and A2670, the spectroscopic catalogs were supplemented with spectroscopic redshifts from SDSS (Sloan Digital Sky Survey) for missing objects from Hydra observations. The completeness of the spectroscopic survey for the massive red sequence galaxies (M using the distance moduli of the clusters) were 94%, 92%, 81%, and 75% for A119, A2670, A3330, and A389, respectively. The line-of-sight velocity dispersions () were 895, 1039, 869, 873 km/s, respectively. Cluster memberships were assigned to galaxies within of the velocity distribution of each cluster. In this paper, we only considered the cluster members with spectroscopic redshifts. Optical CMRs of the spectroscopic cluster members are presented in the top panels in Figure 2. We should mention that our Hydra observations were focused to get cluster memberships of red sequence galaxies first. Therefore the Hydra redshift catalogs are not complete for galaxies in blue clouds. To begin with, the red sequences were determined through iterative fitting using the 2 clipping method. The red sequence, green valley, and blue clouds were then defined according to their color ranges as , , and , respectively, for the best fit of each cluster (the dotted lines in the top panels in Figure 2). We identified 67, 96, 62, and 61 red sequence galaxies from A119, A2670, A3330, and A389, respectively (including 4 galaxies and 22 galaxies from the SDSS spectroscopic redshift catalogs for A119 and A2670). Therefore, our volume-limited red sequence sample included 286 galaxies with a magnitude limit of M from the four target clusters. Among the 286 red sequence galaxies, 263 have valid NUV magnitudes from the GALEX catalogs.
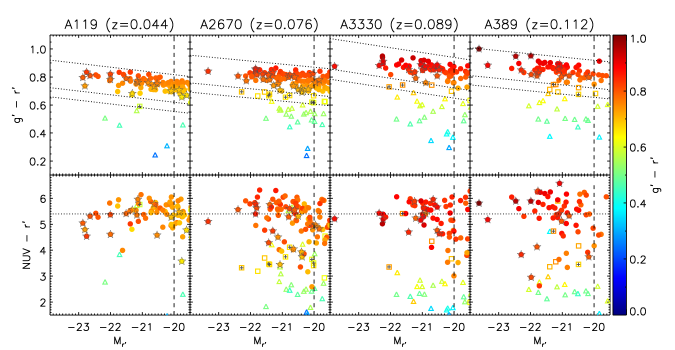
Prior to UV analysis, we conducted a visual inspection of the photometric apertures used by the GALEX pipeline, as introduced in Yi et al. (2011). This process is critical to the avoidance of contamination from nearby UV bright objects that were not resolved into separate objects by the pipeline due to the low spatial resolution (1.5 arcsec pixel-1) of GALEX images. Nineteen galaxies, including 3 post-merger galaxies, were rejected from the 263 NUV-detected galaxies. The rejection rate was 7.2% (19/263), which was similar to that found in Yi et al. (2011) for the early-type galaxies in clusters with SDSS data (6.8% (88/1294)). Thus, we obtained 244 red sequence galaxies with robust NUV detections. Henceforth, these volume-limited red sequence galaxies with NUV magnitudes will be called “RSVL” (Red Sequence Volume-Limited) samples. The UV-optical color-magnitude relations of the target clusters are presented in the bottom panels of Figure 2. The figure shows that the galaxies lying in a tight red sequence in the optical CMRs are widely spread in UV-optical CMRs.
3. RSF Fractions
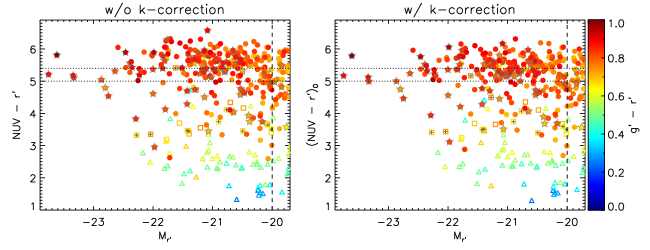
In this work, we utilised NUV colors as the only criteria for identifying RSF galaxies among the red sequence galaxies. However, as shown on the optical CMRs in Figure 2, the optical color shifts of the red sequence galaxies between clusters at different redshifts demanded a correction of the magnitudes. We computed the correction of the UV-optical magnitudes using two-component stellar population modeling. This involved matching the observed photometric SEDs (Spectral Energy Distributions) with composite model SEDs made up of young and old stellar populations. In our modeling, the old population was fixed as a 12 Gyr old stellar population. We constructed model SEDs using the models of Starburst99 (Leitherer et al., 1999) for young stellar populations and the models of Yi (2003) for an old stellar population, by varying the age and mass fraction of the young stellar component as well as the internal extinction. Both stellar population had a solar metallicity. The best match between an observed SED and a model SED was found with a test. We derived the correction terms by comparing the magnitudes from the best fit model at the spectroscopic redshift of a galaxy and another one shifted to the rest frame. For more details on the two-component stellar population modeling, please refer to Sheen et al. (2009). Figure 3 shows the combined UV-optical CMRs of the four clusters before and after the correction. In order to see the effect of the correction in this study with galaxies at and to compare it with other studies that did not apply correction to the galaxy UV-optical colors, we derived the RSF fractions of both sub-samples with and without correction. In the following section, however, we discuss only the results of the corrected samples, unless stated otherwise.
One of the conventional selection criteria for quiescent galaxies has been NUV 5.4, based on the NUV color of a representative UV upturn galaxy, NGC 4552 (Yi et al., 2005; Kaviraj et al., 2007). Jeong et al. (2009) later suggested NUV as a conservative limit for selecting RSF galaxies. Crossett et al. (2014) tested the two criteria using post-starburst galaxies and found that a post-starburst galaxy appeared redder than NUV . According to Figure 3, however, the majority of red sequence galaxies appeared to reside at NUV after correction. Since those NUV cuts were empirical suggestions, we present the results for both criteria in order to avoid a bias from ambiguous RSF criteria.
| Galaxy samples | w/ k-correction | w/o k-correction | ||
|---|---|---|---|---|
| NUV 5.4 | NUV 5 | NUV 5.4 | NUV 5 | |
| Post-mergers | 72.414.7 | 36.29.2 | 62.113.2 | 32.88.7 |
| Normal galaxies | 50.06.4 | 26.34.2 | 41.95.7 | 22.63.9 |
| Post-mergers 0.5 R200 | 70.017.2 | 30.09.9 | 60.015.5% | 27.59.4 |
| Normal galaxies 0.5 R200 | 51.17.5 | 25.94.8 | 43.26.7% | 21.64.3 |
| All RSVL | 55.35.9 | 28.73.9 | 46.75.3 | 25.03.6 |
| All RSVL ( 0.5 R200) | 55.36.9 | 26.84.4 | 46.96.2 | 22.94.0 |

The RSF fractions of the RSVL samples were calculated using different criteria based on the morphological signatures (post-mergers vs normal/featureless galaxies), correction (corrected vs not corrected), NUV cuts (NUV or 5), and distances from the cluster center (RSVL samples in the full MOSAIC II field-of-view vs RSVL within R200 of each cluster). Table 2 shows the averages of the RSF fractions from the four Abell clusters (the fractions of each cluster are presented in Appendix A). On average, about 36% of the post-merger galaxies showed RSF signatures with NUV . This was about 40% larger than the fraction of the normal galaxies ( 26%). When applying NUV as the RSF criterion, the fractions almost doubled in both sub-samples. The ratio of the fractions between the post-merger galaxies and the normal galaxies was 1.4 regardless of the RSF criterion. Following correction, the galaxy colors typically became bluer in the UV-optical bands. Therefore, the RSF fraction was slightly higher after the correction. Our target clusters covered slightly different areas in the optical data as they were located at different redshifts within 0.1. Therefore, we also checked the RSF fractions for galaxies within 0.5R200 of each cluster. As shown in Table 2, we could not find significant differences in the average RSF fractions of the galaxies within 0.5R200 as compared to the fractions using all RSVL samples.
A schematic view of the RSF fractions is presented in Figure 4. The RSF fractions are plotted along with the different RSF criteria for post-merger galaxies and normal galaxies. The solid lines are used to represent all RSVL samples and the dashed lines are for the samples within 0.5R200. The post-merger galaxies showed a slight lack of UV bright (NUV ) galaxies in the central region. Although the errors are large, this makes sense, as most post-merger galaxies may have gone through galaxy mergers at the cluster outskirts. The merger-induced star formation is probably quenched (by environment) and their stellar populations have aged during the dynamical friction time of the galaxy with respect to the cluster.
4. Properties of RSF Galaxies
4.1. Morphology
The galaxy samples were selected based on their optical colors. The previous section, however, showed that UV-optical colors spanned a wide range. We considered the way the post-merger features differed according to the UV-optical colors. Post-merger features were identified at Sheen et al. (2012) using disturbed features, e.g., asymmetric structures, faint features, discontinuous halo structures, rings and dust lanes.
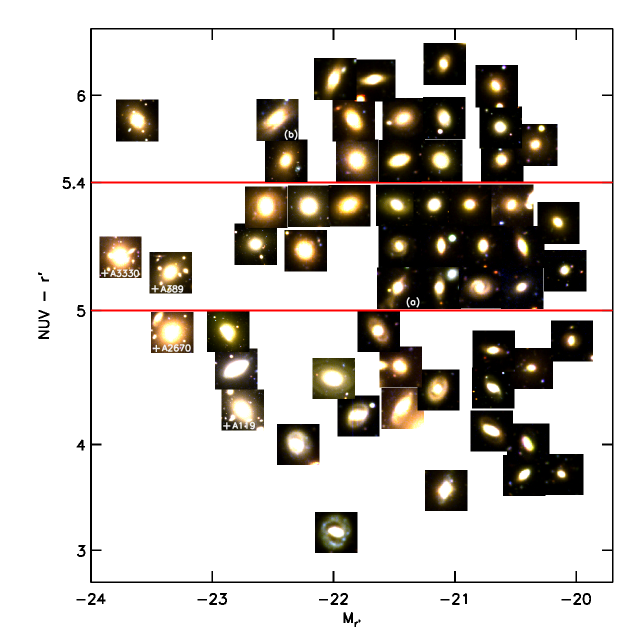
To begin with, we examined the appearance of post-merger galaxies. Thumbnail images of the post-merger galaxies are presented within a plot of NUV colors vs M in Figure 5. The galaxies were divided into three groups of NUV colors based on the two RSF criteria used in this paper (red lines in the figure). We found that galaxies at NUV displayed very asymmetric shapes and blue spots from recent star formation. In the NUV range, the galaxy morphologies appeared more symmetric, some showing thick bar structures or ring structures. Massive elliptical galaxies within this color range showed faint structures such as shells or filamentary structures in their halos. In the 5 NUV range, blue spots were no longer found in the galaxies. Most of them showed elliptical shapes, while some of them presented short spiral structures. A violently-disturbed galaxy that was likely to be a remnant of a galaxy merger between gas-poor galaxies was also found in this range ((a) in Figure 6). In the NUV range, most of the post-merger galaxies seemed to be bulge-dominated regardless of their stellar masses. One massive galaxy showing a dusty disk and disturbed faint features may have been an obscured post-merger galaxy with high internal extinction ((b) in Figure 6).
We calculated the bulge-to-total (B/T) ratios for all the red sequence galaxies in Sheen et al. (2012) to verify that our post-merger classification had not been affected by the spiral structure of the late-type galaxies. To derive the B/T ratios, we measured the radial surface brightness profiles of the galaxies using the ellipse task in IRAF. A least-squares fitting of the profiles was performed with a composite model of a de Vaucouleurs’ profile and an exponential profile using IDL routines from the MPFIT package. The best fit model was chosen using the minimum method. From the models, we calculated the B/T ratios of the galaxies. For more details on the B/T calculations, please refer to Sheen et al. (2012).
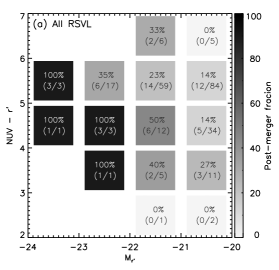
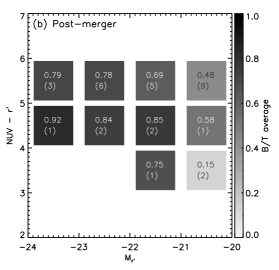
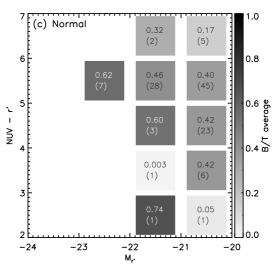
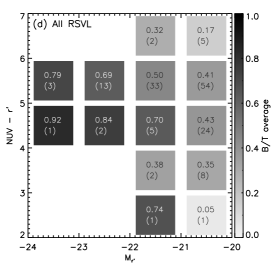
We compared the average B/T ratios of the red sequence galaxies as a function of the NUV colors and the M. Only the RSVL samples with were included. Before considering the B/T ratios, Figure 6 (a) shows the post-merger fractions among the RSVL galaxies in a NUV vs M grid. It suggests that 1) the post-merger fractions of more massive galaxies are larger, and 2) all massive RSF galaxies (M and NUV ) show post-merger features. Figure 6 (b) shows the average B/T ratios for the post-merger galaxies. The post-merger samples were mostly “bulge-dominated” (B/T 0.4 for E/S0 galaxies following Somerville & Primack (1999)). However, it should be noted that no robust profile fitting was obtained for about half of the UV-bright post-merger galaxies due to their asymmetric structures, as shown in Figure 5. The average B/T ratios for the normal galaxies are presented in Figure 6 (c). In general, their average B/T ratios were smaller than those of the post-merger galaxies in the same bin. As shown in Table 2, we found that the RSF fractions for normal, featureless red sequence galaxies were also large (up to 50% with NUV ). We considered the possibility that this may have been caused by passive spirals being included in optical red sequences. However, passive spirals did not seem to be the primary origin of those UV-bright normal galaxies, as their average B/T ratios were too large for them to be considered spiral galaxies. Interestingly, “disk-dominated” galaxies were found in the very red UV-optical color bins ( NUV ). These most likely were late-type galaxies with high internal extinction.
4.2. UV Upturn
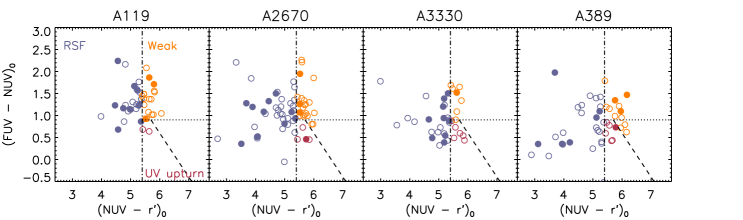
The UV-optical color-color diagrams were also examined to check the UV upturn phenomenon in the red post-merger galaxies. Among the RSVL samples, 189 galaxies (142 normal, 47 post-merger) were detected in both the FUV and NUV GALEX bands. The UV-optical color-color diagrams are presented in Figure 7. Demarcation lines were adopted from Yi et al. (2011) to select candidates for the UV upturn galaxies. About 4% (2/47) of the post-merger galaxies were classified as UV upturn galaxies, while about 11% (16/142) of the normal galaxies showed UV upturn features in this diagram (without correction from non-detections in the FUV). The smaller UV upturn fraction among the post-merger galaxies may have been a consequence of the larger RSF fractions among them, which hid the FUV excess from the evolved stellar systems.
Yi et al. (2011) showed that UV upturn is not a common phenomena at 0.1 using SDSS galaxy clusters. Hernández-Pérez & Bruzual (2014) suggested that binary star populations of very low metallicity can show UV-optical colors in the RSF regime. However a typical metallicity distribution would not expect a substantial fraction of metal-poor stars (e.g., Kodama & Arimoto (1997)). Therefore UV upturn is negligible in this study.
4.3. Spatial Distributions
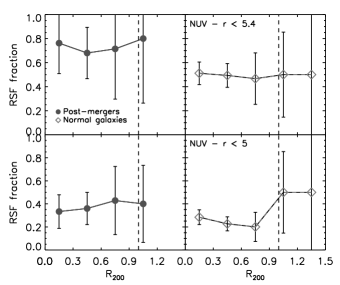
Figure 8 presents the RSF fractions as functions of the clustocentric distance in R200 units using RSF criteria of NUV (upper panels) and NUV (bottom panels). The RSF fractions for the post-merger galaxies did not show any particular trend within R200 under either of those RSF criteria. This may indicate that post-merger RSF galaxies are randomly located within R200 of a cluster, matching the results for the dependence of post-merger fractions on the distance from the cluster center in Sheen et al. (2012). In that study, it was shown that the fraction of UV-bright (NUV ) normal galaxies was large at the cluster outskirts (R R200). However, the number of galaxies at that distance in this study’s sample was too small to be conclusive.
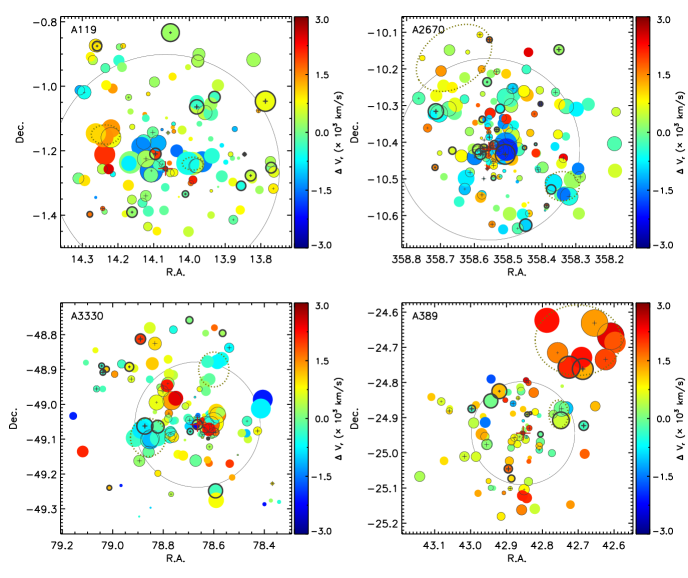
We performed a Dressler-Shectman test (Dressler & Shectman, 1988) to identify sub-structures within the clusters. Sub-structures found in clusters may indicate that they have infalled to a central cluster at relatively recent epoch. As a group environment induces more active evolutionary processes (e.g., galaxy mergers and star formation), in general, the correlation of the distribution of RSF galaxies with sub-structures is worthy of confirmation. In short, the DS test was used to compare the local velocity and velocity dispersion for each galaxy with the global values. Using the spectroscopic members of each cluster, we first computed the mean velocity () and the velocity dispersion (). The mean velocity and velocity dispersion of the 10 nearest neighbors were also computed for each galaxy i. These quantities were then combined to compute the individual galaxy deviations (), as follows:
| (1) |
The sub-structure candidates were initially identified using values and were then confirmed through visual inspection of their spatial and velocity distributions. If more than 4 galaxies with lay close to one another in terms of position and radial velocity, we selected them as a possible sub-structure. For more details, we refer readers to Jaffé et al. (2013). The distribution of the cluster members and possible group candidates is presented in Figure 9. Since we were looking mostly within R200, we could not identify many robust sub-structures except for Abell 389, the furthest cluster sample, at . We inspected whether the RSF galaxies had any preference for lying in sub-structures. As shown in Figure 9, however, neither post-merger galaxies nor post-merger RSF galaxies were preferentially found in the sub-structures.
5. Summary and Discussion
This study explored the GALEX UV properties of optical red sequence galaxies in 4 rich Abell clusters at . In particular, we tried to find a hint of merger-induced recent star formation in the red sequence galaxies. Using the NUV colors of the galaxies, RSF fractions were derived based on various criteria for post-merger galaxies and normal galaxies. Following correction, about 36% of the post-merger galaxies were classified as RSF galaxies with a conservative recent star formation (RSF) criterion (NUV ), and that number was doubled ( 72%) when using a generous criterion (NUV ). The trend was the same when the sample was limited to galaxies within R200. Post-merger galaxies with strong UV emission were found to show more violent, asymmetric features in the deep optical images. The RSF fractions did not show any trend along the clustocentric distance within R200. A Dressler-Shectman test was carried out to check whether the RSF galaxies had any correlation with sub-structures in the galaxy clusters. We could not identify many sub-structures from our clusters as the data only effectively included areas within R200. Within our given field-of-view, the RSF galaxies did not appear to be preferentially related to the clusters’ sub-structures.
The 30% of RSF fraction among the volume-limited red sequence (RSVL) galaxies in galaxy clusters is what we have found through this study. The result is comparable with what Kaviraj et al. (2007) found, at least 30% of a RSF fraction among 2100 early-type galaxies across a wide range of environments. Fitzpatrick & Graves (2015) also looked into 29000 nearby early-type galaxies from SDSS and found that their star formation histories are mostly determined by structural parameters, not by environments. These results suggest that currrent environment where an early-type galaxy sits in is not a critical factor to determine its star formation history.
Although the RSF fraction of post-merger galaxies seemed larger than that of normal galaxies, only 30% (21/70) of RSF galaxies among the optical red sequence galaxies showed post-merger signatures in the deep optical images. The remaining 70% of UV-bright red sequence galaxies did not show morphologically-disturbed features, and they mostly populated the less massive end of the sample’s mass range (M). It is possible that the study may have missed minor merger features in these galaxies from the deep optical images, as post-merger features become more difficult to detect as the galaxy magnitude gets fainter. It has been claimed through a series of papers (Kaviraj et al., 2009, 2011; Crockett et al., 2011; Kaviraj, 2014) that minor merger has a significant role in the recent star formation in early-type galaxies. Also Ji et al. (2014) reported that they could not see merger features from a 1:10 merger simulation with a given imaging depth which is comparable to ours. However, considering the timescale difference for the fading of morphological merger features ( 4 Gyr) and the young stellar populations ( 1 Gyr), the fraction of RSF red sequence galaxies without disturbed features was still significantly large. We also confirmed that those featureless RSF galaxies were mostly bulge-dominated early-type galaxies and so they have a low chance to be a passively evolving spiral galaxy. Our results imply that there may be other and perhaps more influential channels triggering residual star formation in early-type galaxies.
If recent galaxy merger is not a predominant driver of residual star formation in red sequence galaxies, another possible explanation may be gas cooling from internal processes. The source of cold gas for early-type galaxies remains an open question. According to theoretical studies (Kimm, Yi, & Khochfar, 2011; Lagos et al., 2014; Vijayaraghavan & Ricker, 2015), external sources may be gas accretion from minor mergers and internal processes may be stellar mass-loss or hot gas cooling. Lagos et al. (2014) concluded by comparison of semi-analytic models to observations of gas in early-type galaxies that more than 90% of neutral gas contents were supplied by radiative cooling from hot haloes, 8% by gas accretion from minor mergers, and 2% by mass-loss from old stars. Vijayaraghavan & Ricker (2015) simulated ram pressure stripping of hot gas from galaxies in cluster environment and suggested that stripped gas can be confined in a galaxy’s gravitational potential in the form of tail. Therefore, it is possible that the 70% of featureless RSF galaxies in this study may be mainly fuelled by their hot haloes.
According to the result, it seems that post-merger feature in low surface brightness is not a critical hint for RSF in red sequence galaxies. Therefore still NUV excess remains as a powerful tool to find RSF in early-type galaxies effectively.
This study is focused on the photometric properties of galaxies. A future study that makes use of spectroscopic data with adequate signal-to-noise ratios will be useful to address the effect of weak AGN on RSF in elliptical galaxies, as suggested by Valentini & Brighenti (2015), and to derive various star-formation related properties.
References
- Bertin & Arnouts (1996) Bertin, E. & Arnouts, S. 1996, A&AS, 117,393
- Crossett et al. (2014) Crossett, J. P., Pimbblet, K. A., Stott, J. P., & Heath Jones, D. 2014, MNRAS, 437, 2521
- Crockett et al. (2011) Crockett, R. M., Kaviraj, S., Silk, J. I., et al. 2011, ApJ, 727, 115
- Davis et al. (2011) Davis, T. A., Alatalo, K., Sarzi, M., et al. 2011, MNRAS, 417, 882
- Dressler & Shectman (1988) Dressler, A. & Shectman, S. A. 1988, AJ, 95, 985
- Fabbiano & Schweizer (1995) Fabbiano, G. & Schweizer, F. 1995, ApJ, 447, 572
- Fitzpatrick & Graves (2015) Fitzpatrick, P. J. & Graves, G. J. 2015, MNRAS, 447, 1383
- Jaffé et al. (2013) Jaffé, Y. L., Poggianti, B. M., Verheijen, M. A. W., Deshev, B. Z., & van Gorkom, J. H. 2013, MNRAS, 431, 2111
- Jeong et al. (2009) Jeong, H., Yi, S. K., Bureau, M., et al. 2009, MNRAS, 398, 2028
- Ji, Peirani, & Yi (2014) Ji, I., Peirani, S., & Yi, S. K. 2015, A&A, 566, 97
- Hernández-Pérez & Bruzual (2014) Hernández-Pérez, F. & Bruzual, G. 2014, MNRAS, 444, 2571
- Kaviraj et al. (2007) Kaviraj, S., Schawinski, K., Devriendt, J. E. G., et al. 2007, ApJS, 173, 619
- Kaviraj et al. (2009) Kaviraj, S., Peirani, S., Khochfar, S., Silk, J., & Kay, S. 2009, MNRAS, 394, 1713
- Kaviraj et al. (2011) Kaviraj, S., Tan, K. -M., Ellis, R. S., & Silk, J. 2011, MNRAS, 411, 2148
- Kaviraj (2014) Kaviraj, S. 2014, MNRAS, 437, L41
- Kimm, Yi, & Khochfar (2011) Kimm, T., Yi, S. K., & Khochfar, S. 2011, ApJ, 729, 11
- Kodama & Arimoto (1997) Kodama, T. & Arimoto, N. 1997, A&A, 320, 41
- Lagos et al. (2014) Lagos, C. P., Davis, T. A., Lacey, C. G., et al. 2014, MNRAS, 443, 1002
- Leitherer et al. (1999) Leitherer, C., Schaerer, D., Goldader, J. D., et al. 1999, ApJS, 123, 3
- Mathews & Brighenti (2003) Mathews, W. G & Brighenti, F. 2003, ApJ, 590, L5
- Martin et al. (2005) Martin, D. C., Fanson, J., Schiminovich, D., et al. 2005, ApJ, 619, L1
- Oh et al. (2011) Oh, K., Sarzi, M., Schawinski, K., & Yi, S. K. 2011, ApJS, 195, 13
- O’Sullivan, Forbes, & Ponman (2001) O’Sullivan, E., Forbes, D. A., & Ponman T. J. 2001, MNRAS, 324, 420
- Ree et al. (2007) Ree, C. H., Lee, Y.-W., Yi, S. K., et al. 2007, ApJS, 173, 607
- Salim & Rich (2010) Salim, S. & Rich, R. M. 2010, ApJ, 714, L290
- Schawinski et al. (2007a) Schawinski, K., Kaviraj, S., Khochfar, S., et al. 2007, ApJS, 173, 512
- Schawinski et al. (2007b) Schawinski, K., Thomas, D., Sarzi, M., et al. 2007, MNRAS, 382, 1415
- Schlegel, Finkbeiner, & Davis (1998) Schlegel, D. J., Finkbeiner, D. P., & Davis, M. 1998, ApJ, 500, 525
- Sheen et al. (2009) Sheen, Y.-K., Jeong, H., Yi, S. K., et al. 2009, AJ, 138, 1911
- Sheen et al. (2012) Sheen, Y.-K., Yi, S. K., Ree. C. H., & Lee, J. 2012, ApJS, 202, 8
- Somerville & Primack (1999) Somerville, R. S., & Primack, J. R. 1999, MNRAS, 310, 1087
- Valentini & Brighenti (2015) Valentini, M., & Brighenti, F. 2015, MNRAS, 448, 1979
- Vijayaraghavan & Ricker (2015) Vijayaraghavan, R. & Ricker, P. M. 2015, MNRAS, 449, 2312
- Wyder et al. (2005) Wyder, T. K., Treyer, M. A., Milliard, B., et al. 2005, ApJ, 619, L15
- Yi (2003) Yi, S. K. 2003, ApJ, 582, 202
- Yi et al. (2005) Yi, S. K., Yoon, S.-J., Kaviraj, S., et al. 2005, ApJ, 619, L111
- Yi et al. (2011) Yi, S. K., Lee, J., Sheen, Y.-K., et al. 2011, ApJS, 195, 22
- Yi et al. (2013) Yi, S. K., Lee, J., Jung, I., Ji, I., & Sheen, Y.-K. 2013, A&A, 554, 122
Appendix A A Table of RSF fractions
| Samples | Cluster ID | w/ k-correction | w/o k-correction | ||
|---|---|---|---|---|---|
| NUV 5.4 | NUV 5 | NUV 5.4 | NUV 5 | ||
| Post-merger | A119 | 76.9 (10/13) | 38.5 (5/13) | 69.2 (9/13) | 30.8 (4/13) |
| A2670 | 72.2 (13/18) | 50.0 (9/18) | 66.7 (12/18) | 44.4 (8/18) | |
| A3330 | 78.6 (11/14) | 21.4 (3/14) | 57.1 (8/14) | 21.4 (3/14) | |
| A389 | 61.5 (8/13) | 30.8 (4/13) | 53.8 (7/13) | 30.8 (4/13) | |
| Average | 72.4 (42/ 58) | 36.2 (21/ 58) | 62.1 (36/ 58) | 32.8 (19/ 58) | |
| Normal galaxies | A119 | 40.0 (16/40) | 17.5 (7/40) | 32.5 (13/40) | 15.0 (6/40) |
| A2670 | 54.0 (34/63) | 33.3 (21/63) | 44.4 (28/63) | 25.4 (16/63) | |
| A3330 | 53.8 (21/39) | 25.6 (10/39) | 48.7 (19/39) | 25.6 (10/39) | |
| A389 | 50.0 (22/44) | 25.0 (11/44) | 40.9 (18/44) | 22.7 (10/44) | |
| Average | 50.0 (93/186) | 26.3 (49/186) | 41.9 (78/186) | 22.6 (42/186) | |
| Post-merger | A119 | 72.7 (8/11) | 36.4 (4/11) | 63.6 (7/11) | 36.4 (4/11) |
| ( 0.5 R200) | A2670 | 68.8 (11/16) | 43.8 (7/16) | 62.5 (10/16) | 37.5 (6/16) |
| A3330 | 100 (4/4) | 0.0 (0/4) | 75.0 (3/4) | 0.0 (0/4) | |
| A389 | 55.6 (5/9) | 11.1 (1/9) | 44.4 (4/9) | 11.1 (1/9) | |
| Average | 70.0 (28/ 40) | 30.0 (12/ 40) | 60.0 (24/ 40) | 27.5 (11/ 40) | |
| Normal galaxies | A119 | 42.9 (15/35) | 20.0 (7/35) | 37.1 (13/35) | 17.1 (6/35) |
| ( 0.5 R200) | A2670 | 53.8 (28/52) | 32.7 (17/52) | 46.2 (24/52) | 25.0 (13/52) |
| A3330 | 56.5 (13/23) | 21.7 (5/23) | 52.2 (12/23) | 21.7 (5/23) | |
| A389 | 51.7 (15/29) | 24.1 (7/29) | 37.9 (11/29) | 20.7 (6/29) | |
| Average | 51.1 (71/139) | 25.9 (36/139) | 43.2 (60/139) | 21.6 (30/139) | |
| All RSVL | Average | 55.3 (135/244) | 28.7 (70/244) | 46.7 (114/244) | 25.0 (61/244) |
| All RSVL ( 0.5 R200) | Average | 55.3 (99/179) | 26.8 (48/179) | 46.9 (84/179) | 22.9 (41/179) |