Upholding the Unified Model for Active Galactic Nuclei: VLT/FORS2 Spectropolarimetry of Seyfert 2 galaxies
Abstract
The origin of the unification model for Active Galactic Nuclei (AGN) was the detection of broad hydrogen recombination lines in the optical polarized spectrum of the Seyfert 2 galaxy (Sy2) NGC 1068. Since then, a search for the hidden broad-line region (HBLR) of nearby Sy2s started, but polarized broad lines have only been detected in 30–40% of the nearby Sy2s observed to date. Here we present new VLT/FORS2 optical spectropolarimetry of a sample of 15 Sy2s, including Compton-thin and Compton-thick sources. The sample includes six galaxies without previously published spectropolarimetry, some of them normally treated as non-hidden BLR (NHBLR) objects in the literature, four classified as NHBLR, and five as HBLR based on previous data. We report 4 detections of a HBLR in 11 of these galaxies (73% of the sample) and a tentative detection in NGC 5793, which is Compton-thick according to the analysis of X-ray data performed here. Our results confirm that at least some NHBLRs are misclassified, bringing previous publications reporting differences between HBLR and NHBLR objects into question. We detect broad H and H components in polarized light for 10 targets, and just broad H for NGC 5793 and NGC 6300, with line widths ranging between 2100 and 9600 km s-1. High bolometric luminosities and low column densities are associated with higher polarization degrees, but not necessarily with the detection of the scattered broad components.
keywords:
galaxies: active – galaxies: nuclei – galaxies: Seyfert – galaxies:polarization.1 Introduction
The unified model for active galactic nuclei (AGN; Antonucci 1993) stems from the detection of permitted broad lines in the optical polarized spectrum of the Seyfert 2 galaxy NGC 1068 (Antonucci & Miller, 1985). According to this model, the central engines of Seyfert 1 galaxies (hereafter Sy1s) can be seen directly, resulting in typical spectra with both narrow and broad emission lines produced in the kpc-scale narrow-line region (NLR) and the subparsec-scale broad-line region (BLR), respectively. On the other hand, the central engine and BLR of Seyfert 2 galaxies (Sy2s) are obscured by the dusty toroidal structure that surrounds the BLR, preventing a direct view of the broad lines. Thus, the detection of these broad components in the polarized spectra of a Sy2 can be explained as scattered emission from the hidden BLR (HBLR).
After the unified model was proposed, a search for the HBLRs of Sy2s started, and indeed optical spectropolarimetry revealed broad components of H in a significant fraction of them (Miller & Goodrich, 1990; Inglis et al., 1993; Young et al., 1996; Heisler et al., 1997; Barth et al., 1999a, b; Alexander et al., 2000; Moran et al., 2000, 2001; Lumsden et al., 2001, 2004; Tran, 2001, 2003). However, up to date, 60–70% of nearby Sy2s do not show a Sy1-type linearly polarized spectrum (Moran et al., 2001; Tran, 2003), and some authors proposed that these galaxies genuinely lack a Sy1 core, dubbed non-HBLR (NHBLR; Tran 2001, 2003; Gu & Huang 2002). Another possibility extensively explored in the literature is that the non-detection of the broad components is due to certain geometries/intrinsic properties of the scattering region, the torus and/or the host galaxy itself (e.g. Miller & Goodrich 1990; Heisler et al. 1997; Lumsden et al. 2004; Marinucci et al. 2012; Ichikawa et al. 2015).
The majority of previous spectropolarimetric observations of Seyfert galaxies were obtained with 3-4 m class telescopes, except for those obtained with the 10 m Keck Telescopes (Barth et al., 1999a, b; Moran et al., 2001; Tran, 2003). Since then, tens of works reported differences between HBLRs and NHBLRs relying on old spectropolarimetry data. However, if we consider the high signal-to-noise ratios (S/N) required to detect the linear polarization signal typical of Seyfert galaxies (1-5%; Antonucci & Miller 1985), it is very likely that at least some NHBLRs could be misclassified due to insufficient data quality. Deeper spectropolarimetry data of complete samples of Seyfert galaxies obtained with 8–10 m class telescopes might hold the key to unveil the HBLR of nearby Sy2s.
Here we present new linear optical spectropolarimetry of 15 Sy2s that reveal the presence of a HBLR in 11 galaxies at 4 (73% of the sample). Some of the targets were previously classified as NHBLRs, and for others there were no published spectropolarimetry data. Our results confirm that at least some galaxies currently treated as NHBLR in the literature are misclassified, bringing previous publications reporting differences between HBLR and NHBLR objects into question. Both detections and non-detections of HBLRs should always be reported in context with the achieved S/N.
2 Sample, Observations and Data Reduction
Our sample consists of 15 Sy2s with log L erg s-1 for which we had constraints on the inclination angle of their tori (see Table 1). These constraints are either from previous spectral energy distribution (SED) fitting with torus models (Alonso-Herrero et al., 2011; Ramos Almeida et al., 2011, 2014), from H2O maser detections (disk-maser candidates only111Disk-maser detections require high nuclear obscuration, and therefore are generally associated with edge-on tori.; Zhang et al. 2012) and/or from X-ray observations of the Fe K line (assuming that the accretion disk and the torus are coplanar; Weaver & Reynolds 1998; Leighly et al. 1999; Guainazzi et al. 2010). The sample includes 7 Compton-thick and 8 Compton-thin sources. We note that the Sy2 galaxies Centaurus A and NGC 4945 were also included in the observed sample, but the S/N of their total flux spectra was insufficient to obtain a polarized spectrum. The combination of extreme nuclear obscuration222Marconi et al. (2000a, b) reported optical extinctions A mag for the nuclei of Centaurus A and NGC 4945. and host galaxy dilution requires hours of infrared spectropolarimetric observations to obtain reliable polarized spectra for these galaxies (see e.g. Alexander et al. 1999). Therefore, in the following we will refer to the 15 galaxies included in Table 1.
| Galaxy | Previous classification | Axis ratio | itorus | Ref. | Ref. | log nH | Compton | log L | log Lbol | Ref. | |||
|---|---|---|---|---|---|---|---|---|---|---|---|---|---|
| Type | Data | Ref. | (b/a) | (deg) | (deg) | (cm-2) | thick | (erg s-1) | (erg s-1) | ||||
| Circinus | HBLR | a | 0.44 | 90 | m | 60 | s1 | 24.5 | 42.6 | 43.8 | 1 | ||
| IC 2560 | … | … | 0.63 | 90 | n | … | … | 24.5 | 41.8 | 43.1 | 2 | ||
| IC 5063 | HBLR | b,c | 0.68 | 80 | o | 60 | s2 | 23.4 | 42.8 | 44.0 | 1 | ||
| NGC 2110 | HBLR | d,e | 0.74 | 40∗ | p | 45 | s3 | 22.5 | 42.5 | 43.9 | 3 | ||
| NGC 3081 | HBLR | f | 0.78 | 71 | q | 75 | s4 | 23.9 | 42.5 | 43.6 | 1 | ||
| NGC 3281 | NHBLR | g | 0.50 | 62 | r | 50 | s5 | 23.9 | 42.6 | 43.8 | 1 | ||
| NGC 3393 | NHBLR | h† | 0.91 | 90 | n | 67 | s6 | 24.5 | 41.6 | 42.9 | 2,4 | ||
| NGC 4388 | HBLR | i,j | 0.23 | 90 | n | 45 | s7 | 23.5 | 42.9 | 44.1 | 1 | ||
| NGC 4941 | NHBLR | g | 0.54 | 76 | s | 50 | s8 | 23.8 | 41.3 | 42.6 | 5 | ||
| NGC 5135 | NHBLR | k,l | 0.71 | 12 | s | 60 | s9 | 24.5 | 43.1 | 44.4 | 1 | ||
| NGC 5506 | NHBLR‡ | c | 0.30 | 40 | t | 45 | s10 | 22.5 | 43.0 | 44.3 | 1 | ||
| NGC 5643 | NHBLR | g | 0.87 | 74 | q | 60 | s11 | 24.5 | 42.1 | 43.4 | 6,7 | ||
| NGC 5728 | NHBLR | i§ | 0.57 | 90 | n | 60 | s12 | 24.5 | 43.3 | 44.6 | 1 | ||
| NGC 5793 | … | … | 0.34 | 90 | n | … | … | 24.5 | 42.1 | 43.4 | 8 | ||
| NGC 6300 | NHBLR | c | 0.66 | 77 | u | … | … | 23.3 | 41.8 | 43.1 | 9 | ||
We obtained linear spectropolarimetry with the FOcal Reducer and low dispersion Spectrograph 2 (FORS2) on the 8 m Very Large Telescope (VLT). The data were taken during the night of 2013 April 6th in visitor mode (Program ID: 091.B-0190A). The observing conditions were photometric and the seeing varied between 0.6″ and 1.6″. We used the 600B+22 grism and a slit width of 1″, which provide a dispersion of 0.75 Å/pixel and a spectral resolution of R==780. In order to obtain simultaneous observations of H and H, we shifted the position of the slit on the EV2 detector to cover the spectral range 4100–6800 Å with the 600B+22 grism. The pixel scale was 0.126″ pixel-1.
The exposure time in each half wave-plate position ranged between 200 and 300 depending on the target (see Table 1). The instrument position angle (PA) was set to parallactic, with the exception of the galaxies IC 2560 and NGC 2110, for which it was PA=0°. The data were reduced using routines written in IDL, following the method described by Martínez González et al. (2015). The reduction steps include bias subtraction, flat-fielding correction, wavelength calibration, sky subtraction, cosmic rays removal, and flux calibration. In the latter step, we used the spectrophotometric standard star LTT 7379 and standard IRAF333IRAF is distributed by the National Optical Astronomy Observatory, which is operated by the Association of Universities for Research in Astronomy (AURA) under cooperative agreement with the National Science Foundation. routines to derive and then apply the corresponding sensitivity function to the individual spectra. This G0 star was observed at the end of the night, using an exposure time of 50 s per half wave-plate position.
Since we are interested in the nuclear spectra of the galaxies, we extracted one dimensional spectra in an aperture coincident with the value of the seeing at the moment of each target observation (see Table 1). By doing this we also avoid contamination from the galaxy (i.e., dilution of the emission lines). Previous works generally employed larger apertures to minimize the amplitude of spurious features in the continuum (e.g. Barth et al. 1999a; Moran et al. 2001; Tran 2003). However, since our aim is to detect the broad components of the recombination lines, we chose to reduce galaxy dilution by using nuclear apertures, which makes it easier to detect the scattered lines.
In order to calibrate the two beams produced by the FORS2 analyzer and to estimate the amount of instrumental polarization, we observed a linear polarization standard, the Hiltner 652 star, whose polarization degree and angle are known. According to the FORS2 webpage444http://www.eso.org/sci/facilities/paranal/instruments/fors/ inst/pola.html, in the B-band the Hiltner 652 star has a degree of polarization of 5.720.02% and a polarization angle of 179.80.1°. From our data, we measured 5.810.02% and 180.10.1° in the same filter, which we compute from the integrated Stokes parameters Q/I and U/I, weighted by the Johnson B filter transmission, as and (see Martínez González et al. 2015 for further details). We define =0° at the celestial N-S direction, increasing towards the East. The agreement between the calculated and tabulated values implies that the instrument rotation has been chosen correctly in the data reduction, and the instrumental polarization in the B-band is 0.09%. In order to check the latter, we also observed a zero polarization standard star, WD1620-391. In the B- and V-bands we measured PB=0.090.02% and PV=0.080.01% respectively, confirming the value of the instrumental polarization.
Another potential contributor to the continuum polarization of the galaxies is Galactic dust (Serkowski et al., 1975). In the case of our sample, the effect of interstellar polarization could be significant in the case of Circinus and NGC 2110, because of their proximity to the Galactic plane. Using the Heiles (2000) catalog, Moran et al. (2007) reported PV=0.33% and =34.5° for two stars at 12’ from NGC 2110. In the case of Circinus, Oliva et al. (1998) measured P1.8% and 68° for a foreground star at 4″ from the galaxy. We used those values to construct synthetic and spectra assuming a Serkowski et al. (1975) curve, and subtracted them from the normalized Stokes parameters of NGC 2110 and Circinus. The corrected polarization degree and position angle spectra are shown in Figures 6 and 9 of Appendix A.
Finally, we need to quantify the amount of diluting unpolarized starlight in the nuclear spectra of the galaxies. To do that, we fitted the continua of our observed spectra with stellar population templates of different ages (Vazdekis et al., 2010), including reddening, and a power-law () to account for the nonstellar nuclear continuum. We performed interactive fits until we successfully reproduced the stellar features of the underlying galaxy, and from the fitted templates we derived corresponding galaxy fraction spectra (f; see Figure 1 for two examples). We used stellar templates of ages between 1 and 14 Gyr to reproduce the stellar features, and power-law indices ranging from 0 to 2. We note that the values are in agreement with those derived from ultraviolet slope measurements of Sy2s (Kinney et al., 1991). Details of each individual fit, together with the galaxy fractions estimated at 4400 and 5500 Å, are reported in Table 2. f decreases towards the blue as the starlight contribution becomes less important. We note that, although it is the best we can do, this method can produce extremelly different values of fG for the same objects (see Tran 1995 and references therein). These differences do not only affect the derived polarization degrees, but also the wavelength dependence of the polarization.


As can be seen from Table 2, for the majority of the galaxies f1 at 5500 Å, and it ranges between 0.7 and 1 at 4400 Å. The exceptions are NGC 5135 and NGC 5506 (see Figure 1). This implies that for all the galaxies but those two, the large amount of unpolarized starlight prevents to study the behaviour of the true polarization in the continuum. Following Tran (1995), the starligth dilution-corrected and parameters are defined as:
| (1) |
| Galaxy | Age | E(B-V) | fG | fG | |
|---|---|---|---|---|---|
| (Gyr) | (4400 Å) | (5500 Å) | |||
| Circinus | 1.0 | 1.274 | -0.1 | 1.00 | 0.98 |
| IC 2560 | 10.0 | 0.453 | 1.6 | 0.79 | 0.95 |
| IC 5063 | 5.0 | 0.344 | 3.6 | 0.66 | 0.96 |
| NGC 2110 | 14.1 | 0.646 | 1.1 | 0.84 | 0.97 |
| NGC 3081 | 10.0 | 0.402 | 1.7 | 1.00 | 1.02 |
| NGC 3281 | 14.1 | 0.506 | 1.5 | 0.98 | 0.99 |
| NGC 3393 | 14.1 | 0.272 | 1.7 | 1.00 | 1.00 |
| NGC 4388 | 11.2 | 0.579 | 2.1 | 0.93 | 1.00 |
| NGC 4941 | 12.6 | 0.572 | 2.0 | 0.91 | 1.00 |
| NGC 5135 | 5.0 | 0.213 | 1.1 | 0.19 | 0.36 |
| NGC 5506 | 10.0 | 0.226 | 1.6 | 0.51 | 0.81 |
| NGC 5643 | 1.4 | 0.543 | 1.4 | 0.87 | 0.96 |
| NGC 5728 | 2.5 | 0.428 | 1.5 | 1.00 | 1.00 |
| NGC 5793 | 3.5 | 0.638 | 1.0 | 0.97 | 0.99 |
| NGC 6300 | 4.5 | 0.673 | 2.1 | 1.00 | 1.00 |
Thus, we can only obtain realistic dilution-corrected Stokes parameters for NGC 5135 and NGC 5506 using Equation 1. We note that, while the polarization degree () changes substantially with this correction, the polarized flux () is insensitive to it. The starligth dilution-corrected Stokes parameters and derived quantities are reported in Figures 14 and 15 of Appendix A and in Table 3.
3 Results
The sample studied here includes i) five Seyfert galaxies with previous detections of polarized broad components of the H line reported in the literature (also H in the case of NGC 3081); ii) four galaxies classified as NHBLR based on previous spectropolarimetry data; and iii) six galaxies without any published spectropolarimetry data (see Table 1 for the references). Four of the latter six galaxies (NGC 3281, NGC 3393, NGC 4941, and NGC 5643) are commonly treated as NHBLRs in the literature (e.g. Zhang & Wang 2006; Wu et al. 2011; Marinucci et al. 2012; Koulouridis 2014). In the case of NGC 3281, NGC 4941, and NGC 5643, this classification comes from Moran et al. (2001), who claimed non-detection of polarized broad components in their spectra from the Keck Telescopes, but never published the data. The origin of the classification of NGC 3393 as a NHBLR is uncertain, and indeed Kay et al. (2002) reported the detection of scattered broad H, but did not publish the data either.
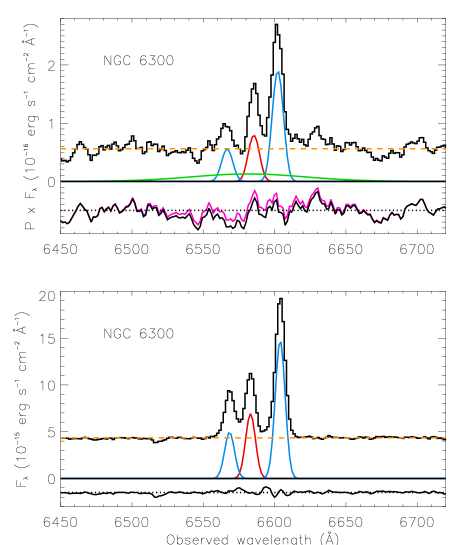
For each galaxy, we present the U/I and Q/I spectra, the degree of polarization and polarization angle, calculated as and , and the flux-calibrated polarized and total spectra. The polarized spectra were calculated as the product of the total flux spectra and the degree of polarization (PFλ). This is shown in Fig. 2 for the galaxy NGC 3393 and in Appendix A for the other 14 galaxies. Note that, as described in Section 2, in the case of Circinus and NGC 2110 we corrected the corresponding spectra from the effect of interstellar polarization, and for NGC 5135 and NGC 5506, of unpolarized starlight dilution.

3.1 Significance of the detections
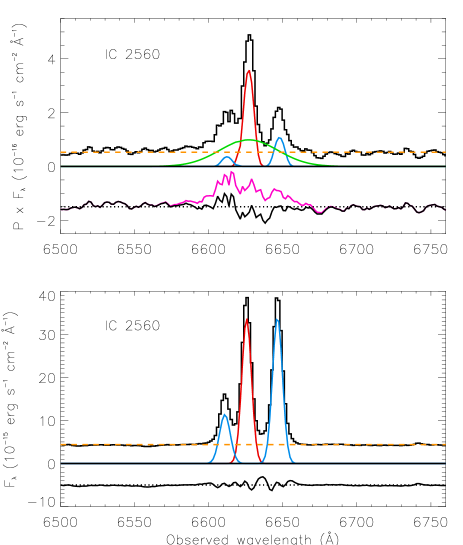
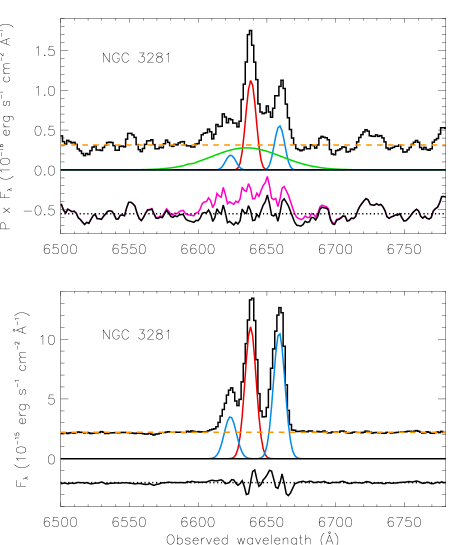
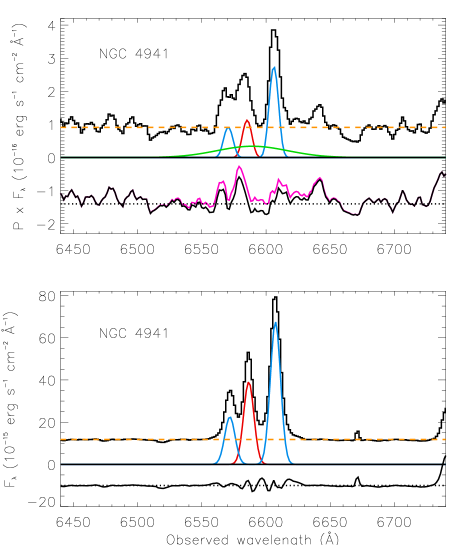

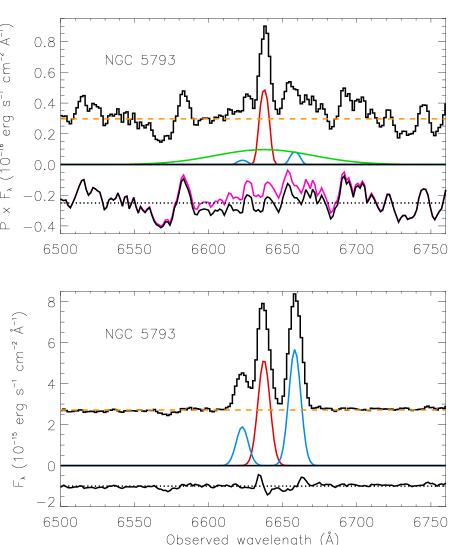
We fitted the H, [N II]6548,6583 Å, H, and [O III]4959,5007 Å line profiles with Gaussians using the Starlink program dipso. We used narrow components of full-width at half-maximum (FWHM) 300–500 km s-1, typical of NLR emission lines, to reproduce the line profiles in the total flux spectra. Normally, single Gaussian profiles are enough to accurately reproduce the narrow components, but in some cases two or three kinematic components were required (NGC 2110, NGC 3081, NGC 4388, NGC 5643, and NGC 5728555In the case of NGC 5728, three narrow components are necessary to reproduce the line profiles, as in Son et al. (2009).). Once we had a good fit to the total flux spectrum, we used the same input parameters (central wavelength of the lines and line width) and let them vary to fit the polarized flux spectrum (PFλ). Finally, we checked whether we require broad components to reproduce the line profiles.
We fitted broad H and H components in polarized light for 10 of the galaxies, and just broad H for NGC 5793 and NGC 6300. For the remaining three galaxies (NGC 5506, NGC 5643, and NGC 5728) we do not find evidence for broad H and H lines in the PFλ spectra presented here.
For the 12 galaxies in the sample for which we need broad components to reproduce the H profiles detected in the polarized spectra, the FWHMs vary from 2100 to 9600 km s-1. In the case of H, we fitted broad components of similar widths as those of H for 9 galaxies and fixed the FWHM to match that of H for NGC 4941. In the case of NGC 5793 and NGC 6300 we could not obtain reliable fits because of the low S/N of the H line. In Table 3 we show the FWHMs of these broad components, corrected for instrumental broadening.
| Galaxy | Apt. | Exp. | BIC | PHα | PV | H FWHM | H FWHM | HBLR | ||||
|---|---|---|---|---|---|---|---|---|---|---|---|---|
| (″) | (s) | H | (%) | (deg) | (%) | (deg) | (km s-1) | (km s-1) | ||||
| Circinus† | 1.0 | 250 | 4.4 | 4.9 | 228 | 1.770.06 | 192 | 1.710.02 | 173 | 2300500 | 28002700 | |
| IC 2560 | 1.3 | 300 | -4.7 | 1.1 | 363 | 0.820.08 | 1042 | 0.770.03 | 911 | 2100300 | 18001000 | |
| IC 5063 | 1.6 | 200 | 4.0 | 0.3 | 3865 | 5.080.37 | -13 | 3.540.23§ | -64 | 2800200 | 2600600 | |
| NGC 2110† | 0.8 | 300 | 15.5 | -20.7 | 2214 | 2.540.07 | 752 | 0.670.03 | 874 | 96001400 | 95004800 | |
| NGC 3081 | 1.0 | 200 | -2.4 | -5.9 | 59 | 0.540.08 | 892 | 0.290.03 | 868 | 2700700 | 30002100 | |
| NGC 3281 | 1.1 | 300 | -4.0 | 3.5 | 98 | 1.090.20 | 891 | 0.960.03 | 943 | 2700700 | 35002200 | |
| NGC 3393 | 1.0 | 300 | -0.5 | 10.4 | 744 | 1.160.07 | 21 | 0.630.02 | 24 | 5000600 | 5100800 | |
| NGC 4388 | 0.9 | 200 | -7.2 | 1.1 | 157 | 0.780.11 | 12819 | 0.530.04 | 959 | 45001400 | 43001100 | |
| NGC 4941 | 0.8 | 300 | 4.5 | -0.9 | 10 | 0.240.06 | 3811 | 0.060.02 | 187 | 2900700 | 2900 | |
| NGC 5135‡ | 0.8 | 300 | -4.0 | -0.9 | 75 | 0.670.08 | 1057 | 0.660.03 | 1043 | 34001200 | 37001900 | |
| NGC 5506‡ | 0.9 | 200 | -3.3 | 5.6 | … | 6.620.62 | 773 | 11.50.2 | 752 | … | … | ? |
| NGC 5643 | 0.8 | 300 | 3.7 | 1.6 | … | 1.080.05 | 773 | 1.150.02 | 831 | … | … | |
| NGC 5728 | 0.9 | 300 | 3.4 | -1.9 | … | 1.570.06 | 571 | 1.400.02 | 571 | … | … | |
| NGC 5793 | 1.1 | 300 | -2.3 | 1.3 | 9 | 0.180.08 | 11812 | 0.080.03 | 8613 | 35001200 | … | ? |
| NGC 6300 | 0.8 | 300 | -1.1 | -6.4 | 15 | 0.820.09 | 694 | 0.800.03 | 505 | 42002800 | … |
To quantify the significance of the detections, we first measured the value of the Stokes parameters by integrating in a bin width of 125 Å centred in H, following Barth et al. (1999a). The 125 Å bin covers the rest-frame range 6500–6625 Å, which is centered in H+[N II]. In the following we will refer to H detections only, which are more and have higher S/N than those of H. In the case of the galaxies with very broad scattered lines (FWHM100 Å: NGC 2110, NGC 3393, and NGC 4388), a broader H bin of 180 Å was used (6480–6660 Å). Those measurements were then compared with the corresponding Q/I and U/I continua, which we measured by integrating in two line-free adjacent bins of the same width, choosing the most adequate for each galaxy, as in Barth et al. (1999a). In Table 3 we report the significance level measured in the Q/I and U/I spectra for the individual galaxies ( and ), in standard deviations over the continuum level. As it can be seen from Figs. 2 and 6–19 in Appendix A, the Q/I and U/I spectra show spurious features at the 1–2 level, which correspond to polarization fringes (Semel, 2003). Therefore, here we only consider significant detections of scattered broad lines those having 4 and/or 4, which is the case of all the galaxies with broad lines detected but NGC 5793 (see Table 3).
Finally, to confirm the presence of a HBLR in the galaxies, we compare the residuals from the fits to the polarized H profiles including and not including the broad component. In Figs. 3 and 4 we show the fits of the six galaxies in the sample with and previously classified as NHBLRs or without published spectropolarimetry data. To quantify the significance of these residuals, we have computed the Bayesian Information Criterion (BIC; Schwarz 1978) for all the galaxies, which is reported in Table 3. The BIC is used for model selection among a finite set of models, with the model with the largest BIC (in absolute value) resulting preferred. In our case, the BIC reported in Table 3 is the difference between the model fits with the broad component included minus the model without it. BICs larger than 10 can be considered very strong and those between 6 and 10 just strong (Schwarz, 1978). The majority of the detections are very strong, although for NGC 4941, NGC 5793, and NGC 6300 the BICs are considerably lower than for the rest of the galaxies.
Considering the previous criteria, here we report the detection of a HBLR for 11 of the 15 galaxies in our sample (73%) at the 4 level. We then confirm the existence of a HBLR for the five sources previously classified as such (Circinus, IC 5063, NGC 2110, NGC 3081, and NGC 4388) and unveil polarized broad components, for the first time, for another six galaxies. Provided that previous spectropolarimetry of Seyfert galaxies revealed HBLRs in only 30–40% of the observed targets (Moran et al., 2001; Tran, 2003), the detection of scattered H emission in 73% of the sample is noteworthy. Indeed, NGC 5793 is probably a HBLR as well, but deeper spectropolarimetry data are required to confirm it. Finally, for the three galaxies whose fits do not require scattered broad components (NGC 5506, NGC 5643, and NGC 5728) we cannot discard the presence of a HBLR, but from the spectra presented here, broad components are not necessary to reproduce the line profiles in polarized flux. Perhaps the presence of two or more kinematic components in these galaxies prevents the detection of faint and broad lines (Nagar et al., 2002; Son et al., 2009; Cresci et al., 2015). Higher S/N observations than those presented here of a complete sample of Sy2 galaxies are required to either confirm or discard the ubiquitous existence of a HBLR in this type of AGN.
3.2 Polarization degree, polarization angle and FWHM of the broad components
In Table 3 we also report the values of the polarization degree and the polarization angle measured in the same H bins employed for calculating and (PHα, ) and in the Johnson V-band filter (PV, ). Uncertainties were calculated as described in Bagnulo et al. (2009) and Martínez González et al. (2015), and they include photon noise and background subtraction errors. We note that in the case of galaxies with low continuum polarizations, the values of the polarization degree reported in Table 3 are significantly lower than those that can be visually inferred from Figs. 2 and 6–19. This is because PHα and PV are calculated from Q/I and U/I integrated in the previously mentioned filters, which results in lower values than those that we would obtain by, for example, fitting a straight line to the continuum.
The majority of PV values reported in Table 3 are well above the instrumental polarization that we measured in this band (0.080.01%), except those of NGC 4941 and NGC 5793, which can be explained by instrumental polarization. In general, we detect significant enhancements in the polarization degree near H with respect to the continuum, confirming the presence of scattered H emission (Lumsden et al., 2001; Moran et al., 2000; Tran, 2010). On the other hand, some galaxies show PHα values which are consistent with PV considering the errors. The exception is NGC 5506, for which we measure PHα=6.60.6% and PV=11.50.2%. Thus, for this galaxy we observe a depolarization around the position of H, as also reported by Lumsden et al. (2004).
Middle panels of Figs. 2 and 6-19 show that the continuum polarization is roughly constant with wavelength for the majority of the galaxies, although there is a rise below 4500 Å, where dilution by starlight decreases (see Section 2). A constant polarization degree would be associated with electron scattering. However, as shown in Section 2, the large amount of unpolarized starlight dilution that affects the majority of the galaxies studied here (see Table 2), as well as the uncertainties inherent to the method employed for correcting it, prevent a detailed analysis of the polarization mechanisms at play.
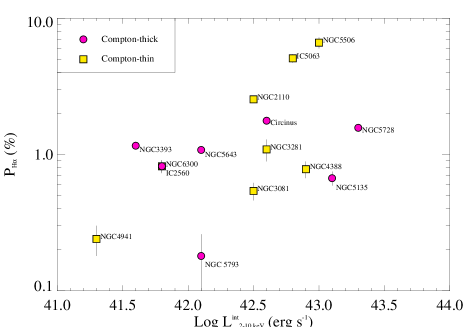
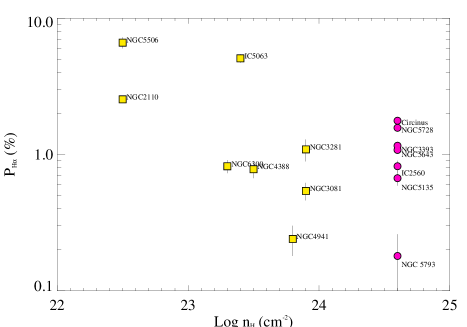
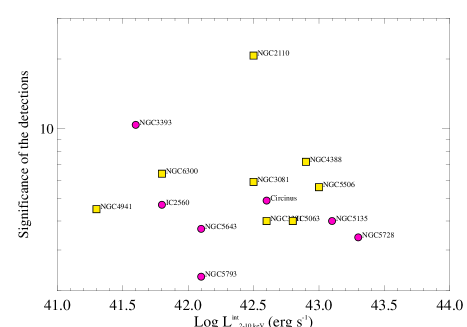
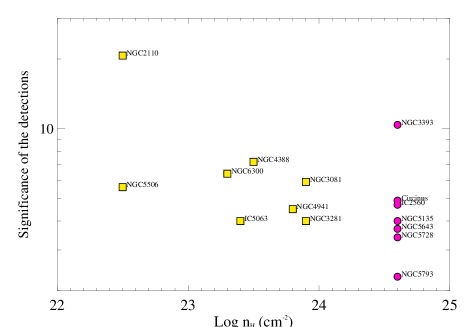
In the top left panel of Figure 5 we show the polarization degree measured in the H bin versus the intrinsic 2–10 keV luminosities reported in Table 3. In spite of the reduced size of the sample considered here and the uncertainties associated with the polarization degree described in Section 2, we find that relatively large PHα values are measured for galaxies with log L42.5 erg s-1. However, if we look at the significance of the scattered H detections ( or from Table 3), the previous trend disappears (see bottom left panel of Figure 5)666The detection significances plotted in Figure 5 are equivalent to the ratio between the polarization degrees measured in the H and V-band filters (P).. We find something similar if we look at the hydrogen column density instead (see right panels of Figure 5). While higher polarization degrees are measured in galaxies with lower nH, there is no correlation when we look at the significance of the detections.
Regarding the polarization angles, we observe rotations across the Balmer lines in some of the galaxies. For example, the middle right panels of Figs. 8, 9, 12, and 15 clearly show different features at the position of H and, to a lesser extent, H, for the galaxies IC 5063, NGC 2110, NGC 4388, and NGC 5506. Moreover, if we look at the and values reported in Table 3, rotations across H become evident for many of the of the targets.
As explained in Section 3.1, we fitted broad components to the H and H profiles detected in the PFλ spectra of 10 galaxies, and just broad H for another two. The broadest components that we measured are those of NGC 2110, NGC 3393, NGC 4388, and NGC 6300 (FWHMs 4200–9600 km s-1). These broad lines were already reported by Moran et al. (2007) and Tran (2010) for NGC 2110 and by Young et al. (1996) for NGC 4388. A polarized spectrum of NGC 6300 was presented by Lumsden et al. (2004), but they did not find any evidence for broad H, although they could not rule out the presence of a HBLR in this galaxy because of the low S/N of the data. For NGC 3393, here we report the first polarized spectrum of the galaxy, which reveals clear broad H and H components of 5000 km s-1. This broad component is also detected in H, but the emission line is too faint to obtain a reliable fit (see Fig. 2). For the rest of the galaxies with broad components detected, the FWHMs range between 1800 and 3700 km s-1.
For NGC 5506 we fitted intermediate-width H and H components of FWHMs1700 km s-1 to reproduce the line profiles detected in both polarized and total flux spectra. Nagar et al. (2002) reported the detection of a broad pedestal of 1800 km s-1 in the Pa line, using near-infrared spectroscopy, and classified the galaxy as an obscured NLSy1. The Stokes parameters, polarization degree, and polarization angle of NGC 5506, which are corrected from starlight dilution, show features at the position of H and H (see Figure 15 and Table 3), but we do not need a broader component to reproduce the line profiles in polarized flux. Indeed, the Q that we measure for NGC 5506 is 5.6 (see Table 3), indicating a significant detection. This galaxy has a low column density as measured from X-ray data, but it is nearly edge-on (see Table 1) and it has a prominent dust lane, which might complicate the detection of the broad lines.
Finally, two and three narrow components were needed to reproduce the line profiles of NGC 5643 (Cresci et al., 2015) and NGC 5728 (Son et al., 2009) respectively. Again, no broad components are required to fit the permitted lines in polarized flux, and furthermore, the detections of scattered H emission in the Stokes spectra are not significant (see Table 3).
4 Discussion
Based on the new VLT/FORS2 spectropolarimetric observations presented here, we report the detection of a HBLR for five Sy2 galaxies previously classified as NHBLRs and one galaxy without any previous classification (IC 2560; see Tables 1 and 3). This result stresses the need for revisiting the current classification of NHBLRs. The VLT/FORS2 spectra studied here are not particularly deep, as the integration times employed were relatively short (see Section 2), and yet, they allowed us to detect scattered broad H lines at for 11/15 galaxies in the sample (73%). Moreover, we report a tentative detection of a HBLR in the galaxy NGC 5793, although deeper observations are needed to confirm it.
The new data presented here might put published results based on previous HBLR/NHBLR classifications into question, as we have proved that at least some NHBLRs are misclassified. Detections and non-detections of HBLRs should always be put in context with the achieved S/N of the observations. Deep and high quality spectropolarimetry data of complete samples of Sy2 galaxies are required before continue searching for trends that might explain the non-detection of polarized broad lines.
We detect polarized broad components in both Compton-thick and Compton-thin objects (see Table 1). Several authors claimed that the detection of HBLRs might depend on the column density of the obscuring material (nH), with a higher percentage of HBLRs found in Compton-thin sources (Gu et al., 2001; Lumsden et al., 2004; Shu et al., 2007). However, for the galaxies in our sample we do not find a correlation between nH and the detectability of the polarized broad lines (see bottom right panel of Figure 5). Indeed, in the case of the three galaxies for which we do not detect broad components two are Compton-thick (NGC 5643 and NGC 5728) and NGC 5506 has a low column density (see Table 1). According to the top right panel of Figure 5, however, we find that the largest polarization degrees are measured for the galaxies with lower nH. We find a similar behavior if we look at the intrinsic 2–10 keV luminosities (left panels of Figure 5). Relatively high polarization degrees are measured for galaxies with log L, and, in general, the more luminous the galaxies, the higher the polarization degrees. However, this trend vanishes when we plot the significance of the detections instead (see bottom left panel of Figure 5). High bolometric luminosities and low column densities are associated with higher polarization degrees, but that does not necessarily imply more HBLR detections.
On the other hand, the so-called “true Sy2s” are low-column density galaxies supposed to intrinsically lack a BLR (Tran et al., 2011). The majority of these sources are low-luminosity AGN (e.g. Tran et al. 2011; Stern & Laor 2012), for which the absence of scattered broad lines can be explained e.g. by the disappearance of the BLR and the torus predicted in the disc-wind scenario (Elitzur & Ho, 2009), or just by dilution due to the stellar emission in the host galaxy. However, more recently, at least two high Eddington-ratio AGN of bolometric luminosities similar to those considered here have been suggested as “true Sy2s” candidates based on X-ray and optical observations (Ho et al., 2012; Miniutti et al., 2013), but spectropolarimetry data are needed to confirm the intrinsic lack of BLR in these galaxies.
There is no correlation between the detection of scattered broad lines and galaxy inclination (b/a) for the galaxies in our sample. Among the four galaxies which are nearly edge-on in the sample discussed here (Circinus, NGC 4388, NGC 5506 and NGC 5793), we have confirmed and tentative HBLR detections.
Finally, we do not find the correlation we were expecting when we selected the sample between the detectability of the polarized broad lines and the torus properties. As explained in Section 2, we have torus inclination constraints for all the galaxies, but we do not find any correlation with the properties of the polarized spectra (P, and FWHM of the broad lines). A possible explanation for this lack of correlation is that the scale height of the scattering region (either dust or electrons) is large enough for the scattered light to be detected independently of the torus inclination (see Ichikawa et al. 2015 for further discussion). Furthermore, we note that some of the torus inclination constraints that we have come from SED fitting with torus models (Alonso-Herrero et al., 2011; Ramos Almeida et al., 2011, 2014) and therefore are model-dependent. Besides, we are biased to large inclination angles (12 galaxies have torus orientations , i.e. close to edge-on, and the other three ), making it difficult to distinguish any trend.
We did not find any correlation with the torus width either, which we derived from the opening angle of the ionization cones for the majority of the galaxies and from SED modelling with clumpy torus models for NGC 4941 and NGC 5135 (see Table 1). Among the possible explanations for the lack of a HBLR in some Sy2s, Tran (2003) proposed that the obscuring medium in these objects is not a torus but something more extended. However, as noted by the latter author, this is difficult to reconcile with the presence of ionization cones in galaxies such as NGC 5728 and NGC 5643 among others. Another possibility are the different torus widths or covering factors (see e.g. Ramos Almeida et al. 2011), which can make easier or more difficult the detection of HBLRs. For the 12 galaxies in our sample with measurements available, which range between 45° and 75°, we do not find any trend with the polarization properties presented here. Spectropolarimetric observations of a larger sample of Sy2s are required to further investigate the influence of torus properties on the detection of the scattered broad lines.
Appendix A Spectropolarimetry of the individual galaxies
Here we include the spectropolarimetry data of all the galaxies in the sample discussed here, with the exception of NGC 3393, for which the data is shown in Fig. 2.


Appendix B Analysis of Chandra and XMM-Newton data of NGC 5793.
We retrieved from the Heasarc777http://heasarc.gsfc.nasa.gov archive Chandra (ObsIDs 10390) and XMM-Newton (ObsID 306050901) observations of NGC 5793 with the aim of performing spectral fitting. After reducing the two observations, we grouped both Chandra and XMM-Newton spectra to get at least 15 counts per spectral bin using the grppha task. The XMM-Newton spectrum shows a higher S/N than Chandra spectrum. Thus, the results presented here are based on the analysis of the XMM-Newton spectrum. However, we note that we have independently examined the Chandra data and all the results presented here are consistent with them.
The XMM-Newton observation was reduced using the Science Analysis Software (SAS), version 14.0.0. Before the extraction of the spectra, good-timing periods were selected (i.e. “flares” were excluded). The method used for this purpose maximises the S/N ratio of the net source spectrum by applying a different constant count rate threshold on the single-events, E 10 keV field-of-view background light curve. The net exposure time after flare removal is 11.5 ksec, and the net count rate in the 0.5–10 keV band is . The nuclear positions were taken from NED, while the extraction region was determined through circles of 20″ radius and the background was selected as a circular region with radius of 40″ in the same chip, free of other sources and as close as possible to the nucleus. The extraction of the source and the background regions were done by using the evselect task. Response matrix files (RMF) were generated using the rmfgen task, and the ancillary response files (ARF) were generated using the arfgen task.
We performed spectral fitting using the package Xspec within the Heasoft software. A reasonable fit is obtained with a combination a non-absorbed power-law () and a thermal component (MEKAL, kT keV). We have noticed an excess above keV compared to the fit. This could be reproduced by an absorbed power-law component or by the addition of the FeK line at 6.4 keV. None of the two models are preferred from the other. In the case of an absorbed power-law, the spectral index was fixed to the softer power-law obtaining an absorption of . In the case of adding a narrow () FeK line, its equivalent width is keV. Note that both scenarios are consistent with the source being Compton-thick. The observed 2–10 keV flux of the source is and the intrinsic 2-10 keV luminosity, once corrected for a factor 70 following Marinucci et al. (2012), .
Further indication of the Compton-thickness of the source is the ratio between the X-ray and [O III]5007 Å fluxes. From the FORS2 spectra analyzed here we derived a reddening corrected [O III] flux of 1.7, which gives . Finally, we can also use the IRAS 12 flux (=160 mJy) to derive the X-ray to mid-infrared ratio . All these results fully support the Compton-thickness nature of NGC 5793.
Acknowledgments
This research was supported by a Marie Curie Intra European Fellowship within the 7th European Community Framework Programme (PIEF-GA-2012-327934). Based on observations made with ESO Telescopes at the Paranal Observatory under programme ID 091.B-0190(A). MJMG and AAR acknowledge financial support by the Spanish Ministry of Economy and Competitiveness through projects AYA2010-18029 (Solar Magnetism and Astrophysical Spectropolarimetry) and Consolider-Ingenio 2010 CSD2009-00038. CRA and AAR also acknowledge financial support through the Ramón y Cajal fellowship. A.A.-H. acknowledges support from AYA2012-31447. The authors acknowledge support from the COST Action MP1104 “Polarization as a tool to study the Solar System and beyond” and the data analysis facilities provided by the Starlink Project which is run by CCLRC on behalf of PPARC. We finally acknowledge R. Antonucci and the anonymous referee for useful comments that have substantially contributed to improve this work.
References
- Alexander et al. (2000) Alexander, D. M., Heisler, C. A., Young, S., Lumsden, S. L., Hough, J. H., & Bailey, J. A. 2000, MNRAS, 313, 815
- Alexander et al. (1999) Alexander, D. M., Hough, J. H., Young, S., Bailey, J. A., Heisler, C. A., Lumsden, S. L., & Robinson, A. 1999, MNRAS, 303, L17
- Alonso-Herrero et al. (2011) Alonso-Herrero, A., Ramos Almeida, C., Mason, R., et al. 2011, ApJ, 736, 82
- Antonucci (1993) Antonucci, R. R. J. 1993, A&AR, 31, 473
- Antonucci & Miller (1985) Antonucci, R. R. J. & Miller, J. 1985, ApJ, 297, 621
- Annuar et al. (2015) Annuar, A., et al. 2015, ApJ, 815, 36
- Bagnulo et al. (2009) Bagnulo, S.,Landolfi, M., Landstreet, J. D., Landi Degl’Innocenti, E., Fossati, L.; Sterzik, M. 2009, PASP, 121, 993
- Barth et al. (1999a) Barth, A. J., Filippenko, A. V., & Moran, E. C. 1999a, ApJ, 525, 673
- Barth et al. (1999b) Barth, A. J., Tran, H. D., Brotherton, M. S., Filippenko, A. V., Ho, L. C., van Breugel, W., Antonucci, R., & Goodrich, R. W. 1999b, AJ, 118, 1609 Zamorani, G. 1999, ApJS, 121, 473
- Cooke et al. (2000) Cooke, A. J., Baldwin, J. A., Ferland, G. J., Netzer, H., & Wilson, A. S. 2000, ApJS, 129, 517
- Cresci et al. (2015) Cresci, G., et al. 2015, A&A, 582, A63
- de Vaucouleurs et al. (1991) de Vaucouleurs, G., de Vaucouleurs, A., Corwin, H. G., Jr., Buta, R. J., Paturel, G. Fouqué, P. 1991, Third Reference Catalogue of Bright Galaxies. Springer, New York, NY (USA)
- Elitzur & Ho (2009) Elitzur, M. & Ho, L. C. 2009, ApJ, 701, L91
- Elmouttie et al. (1998) Elmouttie, M., et al. 1998, MNRAS, 297, 49
- Ferruit et al. (2000) Ferruit, P., Wilson, A. S., & Mulchaey, J. 2000, ApJS, 128, 139
- González-Delgado et al. (2002) González-Delgado, R. M., Arribas, S., Pérez, E., Heckman, T. 2002, ApJ, 579, 188
- González-Martín et al. (2015) González-Martín, O., et al. 2015, A&A, 578, 74
- Greenhill et al. (2003) Greenhill, L. J., et al. ApJ, 590, 162
- Gu & Huang (2002) Gu, Q. & Huang, J. 2002, ApJ, 579 205
- Gu et al. (2001) Gu, Q., Maiolino, R., & Dultzin-Hacyan, D. 2001, A&A, 366, 765
- Guainazzi et al. (2010) Guainazzi, M., Bianchi, S., Matt, G., Dadina, M., Kaastra, J., Malzac, J., & Risaliti, G. 2010, MNRAS, 406, 2013
- Guainazzi et al. (2005) Guainazzi, M., Fabian, A. C., Iwasawa, K., Matt, G., & Fiore, F. 2005, MNRAS, 356, 295
- Heiles (2000) Heiles, C. 2000, AJ, 119, 923
- Heisler et al. (1997) Heisler, C. A., Lumsden, S. L., & Bailey, J. A. 1997, Nature, 385, 700
- Ho et al. (2012) Ho, L. C., Kim, M., & Terashima, Y. 2012, ApJ, 759, L16
- Ichikawa et al. (2015) Ichikawa, K., Packham, C., Ramos Almeida, C., et al. 2015, ApJ, 803, 57
- Inglis et al. (1993) Inglis, M. D., Brindle, C., Hough, J. H., Young, S., Axon, D. J., Bailey, J. A., & Ward, M. J. 1993, MNRAS, 263, 895
- Kay et al. (2002) Kay, L. E., Tran. H. D., & Magalhães, A. M. 2002, 200th AAS Meeting, Bulletin of the American Astronomical Society, 34, 646
- Kawamuro et al. (2016) Kawamuro, T., Ueda, Y., Tazaki, F., Terashima, Y., Mushotzky, R. 2016, ApJ, in press, arXiv:1604.07915
- Kinney et al. (1991) Kinney, A. L., Antonucci, R. R. J., Ward, M. J., Wilson, A. S., & Whittle, M. 1991, ApJ, 377, 100
- Koulouridis (2014) Koulouridis, E. 2014, A&A, 570, 72
- Leighly et al. (1999) Leighly, K. M., Halpern, J. P., Awaki, H., Cappi, M., Ueno, S., & Siebert, J. 1999, ApJ, 522, 209
- Lumsden et al. (2004) Lumsden, S. L., Alexander, D. M., & Hough, J. H. 2004, MNRAS, 348, 1451
- Lumsden et al. (2001) Lumsden, S. L., Heisler, C. A., Bailey, J. A., Hough, J. H., & Young, S. 2001, MNRAS, 327, 459
- Marconi et al. (2000b) Marconi, A., Oliva, E., van der Werf, P. P., Maiolino, R., Schreier, E. J., Macchetto, F., Moorwood, & A. F. M. 2000b, A&A, 357, 24
- Marconi et al. (2000a) Marconi, A., Schreier, E. J., Koekemoer, A., Capetti, A., Axon, D., Macchetto, D., & Caon, N. 2000a, ApJ, 528, 276
- Marinucci et al. (2012) Marinucci, A., Bianchi, S., Nicastro, F., Matt, G., & Goulding, A. D. 2012, ApJ, 748, 130
- Martínez González et al. (2015) Martínez González, M. J., Asensio Ramos, A., Manso Sainz, R., Corradi, R. L. M., & Leone, F. 2014, A&A, 574, 16
- Matsumoto et al. (2004) Matsumoto, C., Nava, A., Maddox, L. A., Leighly, K. M., Grupe, D., Awaki, H., & Ueno, S. 2004, ApJ, 617, 930
- Matt et al. (2013) Matt, G., Bianchi, S., Marinucci, A., Guainazzi, M., Iwawasa, K., & Jimenez Bailon, E. 2013, A&A, 556, 91
- Miller & Goodrich (1990) Miller, J. S. & Goodrich, R. W. 1990, ApJ, 355, 456
- Miniutti et al. (2013) Miniutti, G., et al. 2013, MNRAS, 433, 1764
- Moran et al. (2007) Moran, E. C., Barth, A. J., Eracleous, M., & Kay, L. E. 2007, ApJ, 668, L31
- Moran et al. (2001) Moran, E. C., Kay, L. E., Davis, M., Filippenko, A. V., & Barth, A. J., 2001, ApJ, 556, L75
- Moran et al. (2000) Moran, E. C., Barth, A. J., Kay, L. E., & Filippenko, A. V. 2000, ApJ, 540, L73
- Nagar et al. (2002) Nagar, N. M., Oliva, E., Marconi, A., & Maiolino, R. 2002, A&A, 391, L21
- Oliva et al. (1998) Oliva, E., Marconi, A., Cimatti, A., & di Serego Alighieri, S. 1998, A&A, 329, L21
- Pogge (1988) Pogge, R. W. 1988, ApJ, 332, 702
- Ramos Almeida et al. (2014) Ramos Almeida, C., Alonso-Herrero, A., Levenson, N. A., Asensio Ramos, A., Rodríguez Espinosa, J. M., González-Martín, O., Packham, C., & Martínez, M. 2014, MNRAS, 439, 3847
- Ramos Almeida et al. (2011) Ramos Almeida, C., Levenson, N. A., Alonso-Herrero, A., et al. 2011, ApJ, 731, 92
- Ramos Almeida et al. (2008) Ramos Almeida, C., Pérez García, A. M., Acosta-Pulido, J. A., & González-Martín, O. 2008, ApJ, 680, L17
- Rivers et al. (2014) Rivers, E., Markowitz, A., Rothschild, R., et al. 2014, ApJ, 786, 126
- Rosario et al. (2010) Rosario, D. J., Whittle, M., Nelson, C. H., Wilson, A. S. 2010, MNRAS, 408, 565
- Schmitt et al. (2003) Schmitt, H. R., Donley, J. L., Antonucci, R. R. J., Hutchings, J. B., & Kinney, A. L. 2003, ApJSS, 148, 327
- Schwarz (1978) Schwarz, G. 1978, Ann. Statist., 6, 461
- Semel (2003) Semel, M. 2003, A&A, 401, 1
- Serkowski et al. (1975) Serkowski, K., Mathewson, D. S., & Ford, V. L. 1975, ApJ, 196, 261
- Shu et al. (2007) Shu, X. W., Wang, J. X., Jiang, P., Fan, L. L., & Wang, T. G. 2007, ApJ, 657, 167
- Simpson et al. (1997) Simpson, C., Wilson, A. S., Bower, G., Heckman, T. M., Krolik, J. H., & Miley, G. K. 1997, ApJ, 474, 121
- Son et al. (2009) Son, D.-H., Hyung, S., Ferruit, P., Pècontal, E., Lee, W.-B. 2009, MNRAS, 395, 692
- Stern & Laor (2012) Stern, J. & Laor, A. 2012, MNRAS, 423, 600
- Storchi-Bergmann et al. (1992) Storchi-Bergmann, T., Wilson, A. S., & Baldwin, J. A. 1992, ApJ, 396, 45
- Tilak et al. (2008) Tilak, A., Greenhill, L. J., Done, C., & Madejski, G. 2008, ApJ, 678, 701
- Tran et al. (2011) Tran, H. D., Lyke, J. E., & Mader, J. A. 2011, ApJ, 726, L21
- Tran (2010) Tran, H. D. 2010, ApJ, 711, 1174
- Tran (2003) Tran, H. D. 2003, ApJ, 583, 632
- Tran (2001) Tran, H. D. 2001, ApJ, 554, L19
- Tran (1995) Tran, H. D. 1995, ApJ, 440, 565
- Vazdekis et al. (2010) Vazdekis A., Sánchez-Blázquez P., Falcón-Barroso J., Cenarro A. J., Beasley M. A., Cardiel N., Gorgas J., & Peletier R. F., 2010, MNRAS, 404, 1639
- Watanabe et al. (2003) Watanabe, M., Nagata, T., Sato, S., Nakaya, H. & Hough, J. H. 2003, ApJ, 591, 714
- Weaver & Reynolds (1998) Weaver, K. A. & Reynolds, C. S. 1998, ApJ, 503, L39
- Wilson et al. (1993) Wilson, A. S., Braatz, J. A., Heckman, T. M., Krolik, J. H., & Miley, G. K. 1993, ApJ, 419, L61
- Wilson et al. (1985) Wilson, A. S., Baldwin, J. A., & Ulvestad, J. S. 1985, ApJ, 291, 627
- Wu et al. (2011) Wu, Y. Z., Zhang, E. P., Liang, Y. C., Zhang, C. M., & Zhao, Y. H. 2011, ApJ, 730, 1214
- Young et al. (1996) Young, S., Hough, J. H., Efstathiou, A., Wills, B. J., Bailey, J. A., Ward, M. J., & Axon, D. J. 1996, MNRAS, 281, 1206
- Zhang et al. (2012) Zhang, J. S., Henkel, C., Guo, Q., & Wang, J. 2012, A&A, 538, 152
- Zhang & Wang (2006) Zhang, E.-P. & Wang, J.-M. 2006, ApJ, 653, 137