reception date \Acceptedacception date \Publishedpublication date
gamma-ray burst: individual — gamma-ray burst: general — galaxies: abundances — galaxies: star formation
The redshift selected sample of long gamma-ray burst host galaxies: the overall metallicity distribution at ††thanks: Based on observations obtained at the Gemini Observatory via the time exchange program between Gemini and the Subaru Telescope (processed using the Gemini IRAF package), which is operated by the Association of Universities for Research in Astronomy, Inc., under a cooperative agreement with the NSF on behalf of the Gemini partnership: the National Science Foundation (United States), the National Research Council (Canada), CONICYT (Chile), Ministerio de Ciencia, Tecnología e Innovación Productiva (Argentina), and Ministério da Ciência, Tecnologia e Inovação (Brazil). ††thanks: Based in part on data collected at Subaru Telescope, which is operated by the National Astronomical Observatory of Japan.
Abstract
We discuss the host galaxy metallicity distribution of all long gamma-ray bursts (GRBs) whose redshifts are known to be , including newly obtained spectroscopic datasets of the host galaxies of GRB 060614, 090417B, and 130427A. We compare the metallicity distribution of the low-redshift sample to the model predictions, and constrain the relation between metallicity and GRB occurrence. We take account of spatial variation of metallicities among star forming regions within a galaxy. We found that the models, in which only low-metallicity stars produce GRBs with a sharp cutoff of GRB production efficiency around 12+log(O/H) 8.3, can well reproduce the observed distribution, while the models with no metallicity dependence are not consistent with the observations. We also discuss possible sampling biases we may suffer by collecting long GRBs whose redshifts are known, presenting the photometric observations of the host galaxy of GRB 111225A at whose redshift has been undetermined until 2.3 years after the burst.
1 Introduction
A long gamma-ray burst (GRB) is one of the most energetic explosions in the universe, which is observed via soft gamma-ray emission followed by afterglow in lower energy range. It is now broadly agreed that at least some of long GRBs originate in core-collapse of massive stars together with core-collapse supernovae (CC SNe). However, CC SNe do not always accompany long GRBs, and the criteria discriminating between long GRBs and general CC SNe is one of the most important questions regarding long GRBs.
Some theoretical studies on the origin of long GRBs using stellar evolution models suggest that low-metallicity may be a necessary condition for a long GRB to occur (, e.g. [Yoon & Langer (2005), Hirschi et al. (2005), Woosley & Heger (2006)]). Metallicity distribution of long GRB host galaxies provides us with an important clue to study the relation between metallicity and a long GRB occurrence. Although metallicity of a long GRB host galaxy is not necessarily identical to that of the progenitor (e.g., [Niino et al. (2011), Niino (2011), Levesque et al. (2011), Niino et al. (2015)]), galaxies with low-metallicity would have higher GRB production efficiency [i.e., long GRB rate to star formation rate (SFR) ratio] than high-metal galaxies if low-metallicity is a necessary condition for a long GRB to occur.
With a sample of 5 host galaxies (3 long GRBs and 2 X-ray flashes, XRFs), \authorciteStanek:2006a (\yearciteStanek:2006a, hereafter S06) showed that the metallicity distribution of the host galaxies at redshifts is significantly biased towards low-metallicities compared with star forming galaxies at similar redshifts, suggesting long GRBs really occur in low-metallicity environment. However their sample is too small to determine the relation between metallicity and long GRB occurrence rate. The sample number of spectroscopically studied long GRB host galaxies has been dramatically increased during the 10 years after S06 (e.g., [Savaglio et al. (2009), Levesque et al. (2010b), Graham & Fruchter (2013), Krühler et al. (2015)]). However, the relation between metallicity and long GRB occurrence rate is not understood quantitatively.
One difficulty is that we can determine redshifts and/or identify host galaxies of only a small fraction of long GRBs ( 30% in recent observations), which is likely biased with respect to the distributions of redshifts and host galaxy properties (the -determination/host-identification bias). Furthermore, even when the redshift and the host galaxy of a long GRB are known, the host galaxy is not always studied in detail. The targets of the spectroscopic studies have been selected non-uniformly by numerous independent researchers making the effect of the sampling bias unevaluable (the reporting bias, e.g., [Graham & Fruchter (2013)]).
There have been some previous long GRB host observation campaigns invented to overcome the sampling biases (so called unbiased surveys, [Hjorth et al. (2012), Salvaterra et al. (2012), Perley et al. (2016a)]). In the unbiased surveys, the samples are selected without using informations about redshifts and host galaxies to avoid the -determination/host-identification bias, and hence the samples span a very wide range of redshifts ( 0–-6). In such a wide range of redshift, properties of general galaxies largely evolve making it difficult to reach enough statistics to study the environmental requirements for a long GRB occurrence by comparing the properties of GRB host galaxies to those of general galaxies.
Some recent studies pick out GRB host galaxies in specific ranges of redshifts from the unbiased surveys and compared their properties to those of general galaxies at similar redshifts (Schulze et al., 2015; Vergani et al., 2015; Perley et al., 2016b; Japelj et al., 2016). However, the properties of general galaxies, to which we compare long GRB host galaxies to investigate the environmental requirements for a long GRB occurrence, are still not well understood at high-redshifts. Metallicity measurement of high-redshift galaxies is an especially challenging issue (at , e.g., Kewley et al. (2013); Maier et al. (2015)).
On the other hand, the sample number becomes very small at low-redshifts in the unbiased surveys ( GRBs at ) because the cosmic long GRB rate density is low and the comoving volume element is small, although long GRB host galaxies at low-redshifts are of special importance to understand the relation between metallicity and long GRB occurrence rate as we describe below. Hence, although the unbiased surveys are important to understand what bias we would suffer by selecting long GRBs whose redshifts and host galaxies are known, it is difficult to unveil the environmental requirements for a long GRB occurrence only with the unbiased surveys.
Metallicity measurements of the host galaxies of all long GRBs known at low-redshifts () can dramatically improve our understanding of the relation between metallicity and long GRB occurrence rate. There are advantages of studying GRB host galaxies at low-redshift in some aspects.
-
1.
The success rate of GRB redshift-determinations/host-identifications would be higher at lower redshifts (i.e., the -determination/host-identification bias is weaker), because faint galaxies can be detected without very deep observations and spectroscopies of host galaxies can provide redshift informations even when GRB afterglows are not bright enough for spectroscopies.
-
2.
The reporting bias can be eliminated by finding host galaxies of all GRBs known in the redshift range and measuring metallicities of all host galaxies, which is difficult to do at higher redshifts ().
-
3.
A wealth of spectroscopic studies of general galaxies at low-redshifts, such as the Sloan Digital Sky Survey (SDSS), provides us with control sample of galaxy properties, to which we can compare long GRB host properties to investigate the relation between long GRB rate and metallicity.
The advantages and the disadvantages of a redshift selected study of GRB host galaxies at low-redshifts can be summarized as in table 1, in comparison with the other strategies of GRB host studies.
In this study, we present the overall metallicity distribution of the host galaxies of GRBs known at that occurred before the end of March 2014. For a few of this low-redshift host galaxies, sufficient spectroscopic data to constrain their metallicity were not previously available in the literature, or signal-to-noise ratio (S/N) of important metallicity indicating emission lines was low. We perform spectroscopic metallicity measurements of the host galaxies of three low-redshift GRBs, 060614, 090417B, and 130427A, to obtain better constraints on the metallicity distribution. We compare the metallicity distribution of this low-redshift sample to the predictions of empirical models of galaxies, and constrain the relation between metallicity and GRB occurrence rate.
This paper is organized as follows. We describe our sample selection, observations, and analysis of the obtained spectra in section 2, 3, and 4, respectively. In section 5, we discuss the properties of the low-redshift long GRB host galaxies including metallicities. In section 6, we describe models of galaxy metallicity distributions, to which we compare the low-redshift sample of host galaxies to constrain the relation between metallicity and GRB occurrence rate. The results of the comparison are presented in section 7. In section 8, we discuss uncertainties of our galaxy model, possible subpopulations in the low-redshift GRBs, and sampling biases we may suffer by collecting long GRBs with known redshifts. We summarize our conclusions in section 9.
Throughout this paper, we assume the fiducial cosmology with , , and 70 km s-1 Mpc-1. The magnitudes are given in the AB system.
Strategies of current long GRB host studies sampling bias sample number at incomplete -determination/host-identification reporting unbiased none redshift -determination/host-identification selected† (weaker at lower-redshifts) {tabnote} † This work.
2 Sample selection
We collect low-redshift GRBs from online databases: Swift Gamma-Ray Burst Table111http://swift.gsfc.nasa.gov/archive/grb_table/, Gamma-Ray Burst Online Index (GRBOX)222http://www.astro.caltech.edu/grbox/grbox.php, J. Greiner’s GRB table333http://www.mpe.mpg.de/ jcg/grbgen.html, and GRB Host Studies (GHostS)444http://www.grbhosts.org/. Although there are various classes of gamma-ray burst like events: e.g., long GRBs, short GRBs, ultra-long GRBs, and XRFs, we focus on host galaxies of long GRBs in this study. The classification of burst events are still controversial (e.g., Zhang et al. (2007); Bromberg et al. (2013); Levan et al. (2014a)), and important burst properties for the classification such as burst duration , and spectral peak energy are uncertain in some cases. However, for simplicity, we select long GRBs simply by reported and as follows. The prompt emission properties are taken from Butler et al. (2007)555http://butler.lab.asu.edu/Swift/, Troja et al. (2006), Zhang et al. (2009), and Zhang et al. (2012), in addition to the online databases mentioned above.
First, we collect bursts with 2 sec as long GRBs, considering those with sec as short GRBs and sec as ultra-long GRBs. We also exclude short GRBs with extended emissions, GRB 050709, 050724, 061210, and 071227 from our sample. From the bursts which meet the duration criteria, we remove bursts with very soft spectra (XRFs) which may be a different population from long GRBs. XRFs are often defined according to their hardness ratio which depends on energy bands of X-ray detectors. To take into account burst events discovered by various instruments, we define bursts with keV as XRFs in this study. For some Swift detected bursts, estimation is not available. In that case, we distinguish GRBs and XRFs using photon spectral index in the energy range of Swift-BAT (). We consider bursts with which is typical of long GRBs with keV (Zhang et al., 2007; Sakamoto et al., 2009) as long GRBs, and those with as XRFs.
Within the criteria described above, 15 long GRBs occurred before the end of March 2014 at spectroscopically measured redshifts (Table 2). However, we exclude GRB 050219 from further discussion in this study, leaving 14 low-redshift long GRBs in our sample, because it is unclear whether this burst really has occurred at a low-redshift. GRB 050219 occurred close to (but \timeform2” offset from) an early-galaxy for which the redshift is measured (Rossi et al., 2014). Given that long GRBs result from death of massive stars, the association of GRB 050219 with an early-type galaxy is surprising, although it is not strictly prohibited because early-type galaxies can harbour small amount of star formation (e.g., Morganti et al. (2006)). The significant offset of GRB 050219 from its claimed host galaxy also suggests that the galaxy might be aligned with the GRB by chance without any physical association with the burst. It is possible that the remaining sample is also contaminated by galaxies that coincide with GRBs by chance. We discuss this issue in section 8.3.3.
Among the 14 GRBs, GRB 060614, 090417B, 111225A, and 130427A were without sufficient spectroscopic observations to significantly constrain their host metallicity. We perform spectroscopic observations of the host galaxies of GRB 060614, 090417B, and 130427A in this study. There are also some recently published spectroscopic observations of the host galaxies of GRB 060614 and 130427A. We also discuss those observations in section 3.
The host galaxy of GRB 111225A missed our spectroscopic observation because its redshift had not been measured as of the end of March 2014, and no metallicity information is available for this host galaxy. The redshift of this burst was reported 2.3 years after the burst (Thöne & de Ugarte Postigo, 2014). We take into account this host galaxy as a part of the uncertainty in the metallicity distribution of the GRB host galaxies. We discuss the implications for the sampling bias in the redshift selected sample from the late redshift report of this burst in section 8.3.2. Hereafter, GRB means long GRB unless otherwise stated.
Long GRBs at
GRB
redshift
source of redshift†
980425‡
0.0085
host galaxy [1]
060505
0.089
host galaxy [2]
080517
0.089
host galaxy [3]
031203‡
0.105
host galaxy [4]
060614
0.125
host galaxy [5, 6]
030329‡
0.169
afterglow, host galaxy [7]
050219††
0.211
host galaxy[8]
120422A‡
0.283
afterglow [9], host galaxy [10]
050826
0.296
host galaxy [11]
111225A
0.297
afterglow, host galaxy[12]
130427A‡
0.340
afterglow [13], host galaxy [14]
090417B
0.345
host galaxy [15]
061021
0.346
afterglow [16], host galaxy [17]
011121‡
0.362
host galaxy [18, 19]
120714B‡
0.398
afterglow, host galaxy [20]
{tabnote}
Long GRBs whose redshifts are spectroscopically determined to be .
Short GRBs, XRFs, and ultra-long GRBs are not included.
† If ‘host galaxy’, the redshift
is determined by emission lines of the host galaxy.
If ‘afterglow’, the redshift is determined
by absorption lines in the afterglow.
The numbers in the square brackets are the references as listed below.
References: 1. Tinney et al. (1998), 2. Ofek et al. (2006), 3. Stanway et al. (2015),
4. Prochaska et al. (2003), 5. Price et al. (2006), 6. Fugazza et al. (2006),
7. Greiner et al. (2003), 8. Rossi et al. (2014), 9. Schulze et al. (2012),
10. Tanvir et al. (2012), 11. Halpern & Mirabal (2006), 12. Thöne & de Ugarte Postigo (2014),
13. Levan et al. (2013), 14. Xu et al. (2013a), 15. Berger & Fox (2009),
16. Fynbo et al. (2009), 17. Hjorth et al. (2012), 18. Infante et al. (2001),
19. Garnavich et al. (2003), 20. Fynbo et al. (2012)
‡ bursts with confirmed SN associations (Cano et al., 2016)
†† We do not include GRB 050219 in the analyses in this paper,
because the association of this bust with its host galaxy
for which the redshift is measured is highly uncertain.
3 Observations
We perform optical spectroscopy of the host galaxies of GRB 060614, 090417B, and 130427A with the Gemini Multi-Object Spectrographs (GMOS, Hook et al. (2004)), and use flux ratios of the emission lines: [O\emissiontypeII]3727, H, [O\emissiontypeIII]4959, [O\emissiontypeIII]5007, H, and [N\emissiontypeII]6584, as metallicity indicators (hereafter, [O\emissiontypeII], [O\emissiontypeIII], and [N\emissiontypeII] mean [O\emissiontypeII]3727, [O\emissiontypeIII]5007, and [N\emissiontypeII]6584, respectively, unless otherwise stated). The apparent spatial extent of the three host galaxies are \timeform1”, and major part of their flux is collected in the slit. The spectra obtained with GMOS were calibrated using spectroscopic standard stars observed on different nights from the observations of the host galaxies, and hence the absolute flux scale is not accurate.
Emission line fluxes of the GRB 130427A host galaxy obtained during a target-of-opportunity program (TOO, PI: N. Kawai) using Subaru/FOCAS (Kashikawa et al., 2002) are presented together. We also performed imaging observations of the host galaxy of GRB 111225A. We describe the observations of each target in the following subsections. See table 3.4 for the summary of our observations.
The data were reduced in a standard manner using PyRAF666PyRAF is a product of the Space Telescope Science Institute, which is operated by AURA for NASA/ IRAF777IRAF is distributed by the National Optical Astronomy Observatories, which are operated by the Association of Universities for Research in Astronomy, Inc., under cooperative agreement with the National Science Foundation., together with the Gemini IRAF package and the FOCASRED package.
3.1 Spectroscopy of the GRB 060614 host galaxy
GRB 060614 is known as a GRB unassociated with a bright SN at (Gehrels et al., 2006; Fynbo et al., 2006; Della Valle et al., 2006; Gal-Yam et al., 2006). Although some spectroscopic observations of the GRB 060614 host galaxy were performed soon after the burst (Fynbo et al., 2006; Della Valle et al., 2006; Gal-Yam et al., 2006), the metallicity measurements were uncertain because the fluxes of [N\emissiontypeII] and [O\emissiontypeII] lines were not well constrained. Recently, Japelj et al. (2016) also reported metallicity measurement of the host galaxy of GRB 060614. The metallicity they derived is broadly consistent with ours which we discuss in section 5.1.
We performed spectroscopy of the GRB 060614 host galaxy with GMOS-South using the \timeform1”.0 slit and two different settings of grisms and order-cut filters. One is the B600 grating (no-filter) which covers 3500–6000 Å, and the other is the R400 grating + the OG515 order-cut filter covering 5300–9000 Å. The signals were pixels binned. The B600 spectroscopy was performed on 2015 April 25 (UT). The integration time was 1000 sec , and the slit position angle was set to the parallactic angle to minimize the effect of differential atmospheric refraction. The R400 spectroscopy was performed on 2015 April 28, and May 14 with the integration time of 1200 sec and the position angle set to the parallactic angle.
3.2 Spectroscopy of the GRB 090417B host galaxy
GRB 090417B is an optically dark GRB at with a very long duration of sec (Holland et al., 2010). The spectroscopy was performed with GMOS-North on 2015 March 25. We use the \timeform1”.0 slit, the R831 grating, and the RG610 order-cut filter covering 7300–9200 Å. At this redshift, the H line coincides with a strong night-sky emission line at 8827 Å. To accurately subtract sky emission lines, we utilize the Nod and Shuffle sky subtraction. The signals were 2 pixels binned along the spectral direction. The total integration time was 2640 sec (60 sec 2 positions 11 cycles 2 sequences). The slit position angle was set to the parallactic angle.
3.3 Spectroscopy of the GRB 130427A host galaxy
GRB 130427A is a bright burst at associated with a broad-lined Type Ic SN 2013cq (Xu et al., 2013b; Perley et al., 2014; Levan et al., 2014b). Although detection of the host galaxy emission lines over the afterglow and the SN are reported by Xu et al. (2013b) and \authorciteKruhler:2015a (\yearciteKruhler:2015a, hereafter K15), the detection of the [N\emissiontypeII] line is marginal in either case.
The spectroscopic follow up observation of GRB 130427A with Subaru/FOCAS was performed on 2013 May 17 (i.e., 20 days after the burst), under a weather condition with cirrus clouds (PI: N. Kawai). The \timeform0”.8 slit, the 300B grating, and the Y47 filter covering 4700–9000 Å were used. The slit position angle was set to \timeform130D to put both of the center of the host galaxy and the GRB position into the slit. The signals were 2 pixels binned along the spatial direction. The integration time was 9600 sec. Unfortunately the atmospheric diffraction corrector (ADC) could not be used at the time of the observation, however the spectroscopy was performed with elevation angles \timeform60D, and atmospheric refraction would be \timeform0”.25 throughout the wavelength range.
Although the S/N of the FOCAS spectrum is higher than those previously reported, the significance of the detection of the [N\emissiontypeII] line was still low ( in K15). Furthermore, the strong night-sky emission line at 8827 Å overlaps with the [N\emissiontypeII] line of the host galaxy at this redshift. Hence accurate subtraction of the sky emission is essential for the spectroscopy of this host galaxy.
We performed further spectroscopy of the GRB 130427A host galaxy with GMOS-North on 2015 March 27 to measure the [N\emissiontypeII] line flux more securely with higher significance of the line detection. The total integration time was 2640 sec. The slit position angle was set to the parallactic angle. We used the Nod and Shuffle sky subtraction to subtract the sky emission line accurately. The signals were 2 pixels binned along the spectral direction.
3.4 Imaging of the GRB 111225A host galaxy
Thöne & de Ugarte Postigo (2014) reported the redshift of GRB 111225A, , in April 2014 ( 2.3 years after the burst) by analyzing the archival data with an updated software. Thus GRB 111225A was not included in the target list of our spectroscopic observations which was compiled in March 2014. We perform imaging observations of the host galaxy of GRB 111225A in , and band filters with Subaru/FOCAS on 2015 September 22, under a photometric condition. The integration time is 1800 sec for band, and 600 sec for each of , and band. Signals were pixels binned. Photometric calibration is performed with respect to Landolt (1992) standard stars in the PG0231+051 field observed in the same night.
Observations of the GRB host galaxies
target
instrument
grating
N&S†
PA
slit witdth
Integration
resolution
seeing
host galaxy
+ filter
[deg]
[arcsec]
[sec]
[R]
[arcsec]
GRB 060614
GMOS-S
B600
No
92‡
1.0
1000 6
1300
0.9
GMOS-S
R400 + OG515
No
118‡
1.0
1200 8
1000
0.7
GRB 090417B
GMOS-N
R831 + RG610
Yes
122‡
1.0
1320 2
3000
0.6
GRB 130427A
GMOS-N
R831 + RG610
Yes
160‡
1.0
1320 2
3000
0.4
GRB 130427A‡‡
FOCAS
300B + Y47
No
130
0.8
1200 8
1000
unstable
GRB 111225A
FOCAS
U (imaging)
No
-
-
360 5
-
0.8
FOCAS
B (imaging)
No
-
-
120 5
-
0.8
FOCAS
V (imaging)
No
-
-
120 5
-
0.6
FOCAS
R (imaging)
No
-
-
120 5
-
0.7
FOCAS
I (imaging)
No
-
-
120 5
-
0.7
{tabnote}
The observations of the GRB host galaxies we present in this study.
† Use of Nod & Shuffle sky subtraction.
‡ parallactic angle
†† The integration time of 1 Nod & Shuffle sequence
consists of 60 sec 2 positions 11 cycles.
‡‡ TOO, poor weather condition
4 Emission line measurements
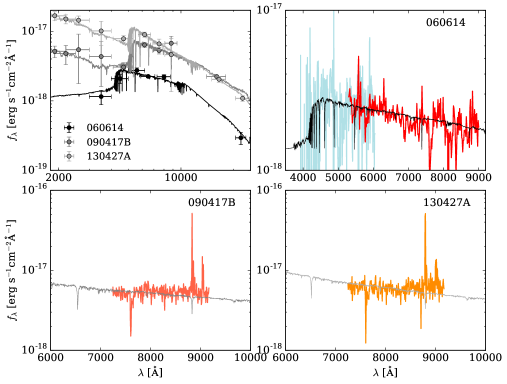
To minimize the effect of stellar absorption features on the line flux measurements, we first subtract stellar spectral energy distribution (SED) models of the host galaxies from the observed spectra. We perform SED fittings to optical/near-infrared (NIR) broad-band photometries in the literature (figure 1) using the SEDfit software package (Sawicki, 2012) which utilizes population synthesis models by Bruzual & Charlot (2003). The extinction law by Calzetti et al. (2000) and the initial mass function (IMF) by Chabrier (2003) are assumed. We examine six cases of stellar metallicity: , and five cases of star formation history: simple stellar population (SSP), constant star formation, and exponentially decaying star formation with and 5 Gyr.
As mentioned in section 3, absolute scale of our spectra is not accurate. Furthermore, it is possible that a fraction light is lost at the slit. In the following discussion, we rescale the observed spectra so that the continuum flux agrees with the best fit SED models. The broad-band photometries, the best fit SED models, and the rescaled spectra are shown in figure 1. The parameters of the best fit stellar SED models are listed in table 4. We derive metallicities of the GRB host galaxies using relative flux ratios between different emission lines as indicators (section 5.1), and hence the derived metallicities are not significantly affected by the error of absolute flux scale.
Results of the host galaxy SED fittings GRB Age [Gyr] star formation history 060614 0.005 SSP 6.84 090417B 0.4 Gyr 4.49 130427A 0.4 SSP 1.82 {tabnote} The parameters of the best fitting stellar SED models (Bruzual & Charlot, 2003) that reproduce the broad-band photometries in the literature (the upper left panel of figure 1). The extinction law by Calzetti et al. (2000) and the IMF by Chabrier (2003) are assumed.
There are some archival spectra of the GRB 060614 host galaxy as mentioned in section 3.1, and those by Fynbo et al. (2006) and Gal-Yam et al. (2006) are obtained with GMOS-South using the \timeform1”.0 slit and the R400 grating as well as our R400 spectrum. Although the GMOS archival data alone are not deep enough to constrain the metallicity of the host galaxy, we stack them with our R400 spectra to maximize the S/N. The GMOS-South detectors were replaced between the archival observations and ours, the pixel scale remained Å/pix with the R400 grating. The integration time of the archival observations is 1800 sec 4 and 1200 sec 4, respectively. We note that the detector replacement improved the efficiency at the wavelength of H and [N\emissiontypeII] at by 35%888http://www.gemini.edu/sciops/instruments/gmos/imaging/detector-array.
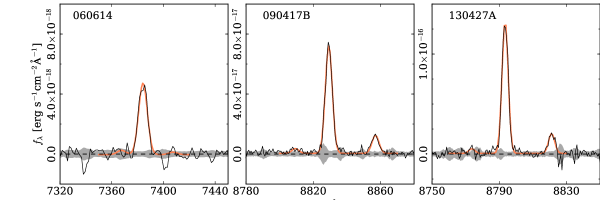
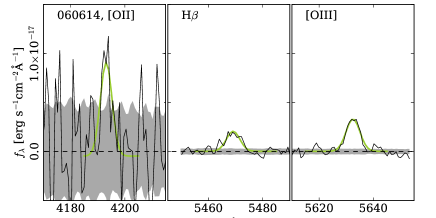
We subtract the best fit SED models from the rescaled spectra, and measure emission line fluxes by fitting the lines with Gaussian plus flat continuum models. The residual spectra after the model subtraction and the Gaussian fits are shown in figure 2 and figure 3. Although [O\emissiontypeII] line is a doublet, we fit it with a single Gaussian as well as the other lines, because the doublet is not resolved in our spectrum. The obtained emission line fluxes are corrected for the foreground extinction in the Milky Way (MW) using the extinction map by Schlafly & Finkbeiner (2011) and the extinction law by Cardelli et al. (1989), and shown in table 5.1.
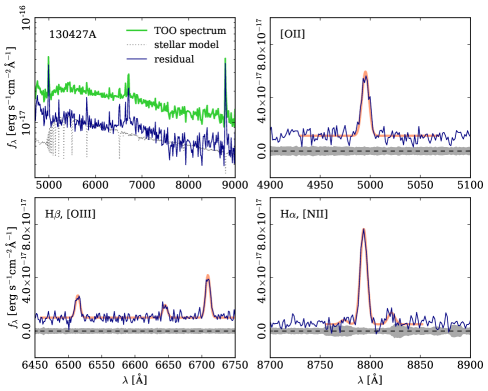
The continuum component in the spectrum obtained by the FOCAS TOO observation of GRB 130427A is contaminated with the afterglow and the SN (figure 4). Hence we cannot calibrate the flux scale comparing the continuum spectrum with the best fit stellar SED model. Instead, we firstly measure H flux without the absorption correction, and rescale the FOCAS spectrum so that the absorption uncorrected H flux agrees with that obtained from the GMOS spectrum.
The emission line fluxes of the other low-redshift GRB host galaxies in the literature are also shown in table 5.1. The host galaxies of GRB 980425, 060505, and 120422A, are spatially resolved in the spectroscopic observations (Christensen et al., 2008; Thöne et al., 2008; Schulze et al., 2014), and emission line fluxes are measured at multiple positions within the galaxies. In that case, we use the integrated flux over the whole galaxy or the flux measured at the peak of the light profile of the host galaxy, for consistency with the spectroscopic data of the other GRB host galaxies which are not spatially resolved.
5 Properties of the low-redshift GRB host galaxies
5.1 Metallicity
The emission line fluxes of the host galaxies in the low-redshift sample (see section 2) are listed in table 5.1. With these emission line measurements, we derive metallicity of ionized gas, 12+log10(O/H), which would be close to the metallicity of young stars in the galaxies. We utilize both N2 index (= [N\emissiontypeII]6584/H) and index [= ([O\emissiontypeII]3727+[O\emissiontypeII]4959+[O\emissiontypeII]5007)/H] as indicators of metallicity.
Various calibrations are proposed for the relation between the indiators and metallicity, and different calibrations are often inconsistent with each other (Kewley & Ellison, 2008). In this study, we utilize the method of \authorciteKobulnicky:2004a (\yearciteKobulnicky:2004a, KK04), in which both N2 and indices are calibrated using the same photoionization model, to obtain consistent results from the two indicators. The solar-metallicity corresponds to 12+log10(O/H) = 8.69 (Allende Prieto et al., 2001).
In the KK04 calibration, the N2 and indices are related to metallicity taking the effect of ionization parameter () into account. The parameter can be estimated from index [= ([O\emissiontypeII]4959+[O\emissiontypeII]5007)/[O\emissiontypeII]3727]. The metallicity calibration by KK04 suffers from the model uncertainties of 0.1 dex, and hence we consider error of a metallicity measurement to be 0.1 dex when the error propagation from the emission line fluxes is smaller than this value or flux error informations are not available.
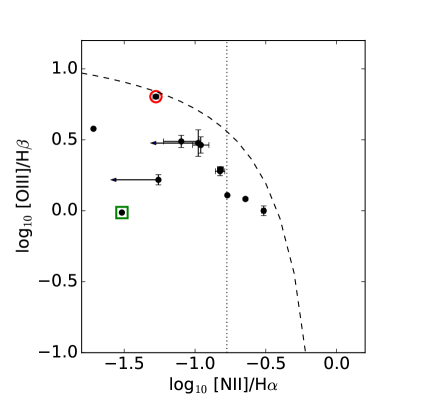
The fluxes in table 5.1 are corrected for the foreground extinction in the MW, but not for the extinction in the host galaxies themselves. To derive metallicity, we correct the line fluxes for the host extinctions, assuming the intrinsic value of the Balmer decrement H/H = 2.86 and the extinction law by Calzetti et al. (2000). The positions of the host galaxies on the Baldwin-Phillips-Terlevich (BPT) diagram (Baldwin et al., 1981) with the extinction correction are shown in figure 5. In the BPT diagram, the GRB host galaxies show emission line ratios that are consistent to result purely from star forming activities. However, Levesque et al. (2010a) showed that the spectrum of the host galaxy of GRB 031203 is possibly affected by an active galactic nucleus (AGN) investigating more numerous emission line fluxes than examined in the BPT diagram. Hence the derived properties of the GRB 031203 host galaxy might be systematically affected by an AGN.
We describe the metallicity determination of each host galaxy in the Appendix. The derived metallicities and the extinctions are listed in table 5.1 & 5.2. When both of the N2 and indices are valid for a galaxy, we use the index, although the two indices agree with each other except for the host galaxies of GRB 031203 and 011121. The emission line ratio of the GRB 031203 host galaxy might be affected by an AGN as mentioned above, and the GRB 011121 host galaxy is a remarkable outlier from the mass-metallicity (-) relation of galaxies (see section 7). The metallicity measurement of these objects should be considered with care.
Emission line fluxes of the GRB host galaxies at
GRB
[O\emissiontypeII]3727
H
[O\emissiontypeIII]4959
[O\emissiontypeIII]5007
H
[N\emissiontypeII]6584
ref.
980425†
2.40
4.45
-
1.29
1.79
1.97
Christensen et al. (2008)
060505
16.80.4
4.270.03
2.190.13
5.170.13
21.90.09
4.970.09
Thöne et al. (2008)
080517
1100110
38022
1306.7
38022
190044
58013
Stanway et al. (2015)
031203
2270230
214040
4520 50
1363070
604030
32010
Prochaska et al. (2004);
Sollerman et al. (2005)
060614
5.601.16
1.350.10
-
2.230.10
4.170.09
0.28
This work
030329‡
64.8
47.3
57.8
179
151
2.9
Levesque et al. (2010a)
120422A
58.06.7
12.80.4
8.30.3
25.10.5
53.60.5
8.10.4
Schulze et al. (2014)
050826‡
70.9
24.5
10.8
31.5
75.7
12.8
Levesque et al. (2010b)
111225A
-
-
-
-
-
-
-
130427A
43.71.8
15.01.0
8.51.0
28.51.0
62.30.9
9.360.74
This work††
(20.22.3
4.80.9
2.2
6.51.0
14.61.3
1.50.6
K15)
090417B
-
-
-
-
38.10.6
6.400.51
This work
061021
1.60.1
0.50.1
0.60.1
1.50.2
1.90.1
0.26
K15
011121‡
57.97
17.13
16.79
16.64
65.61
2.0
Garnavich et al. (2003);
Graham & Fruchter (2013)
120714B
9.80.5
2.50.2
2.90.3
7.70.5
7.50.3
0.60.2
K15
{tabnote}
Fluxes are in units of erg s-1cm-2,
and corrected for the foreground extinction in the MW.
When the estimated flux is consistent with zero within the 2 error,
we show the 95% upper-limits instead.
† The flux errors are 10%.
‡ Flux error informations are not available.
†† The H and [N\emissiontypeII] fluxes are measured from the GMOS spectrum,
and the other line fluxes are measured from the FOCAS spectrum.
Metallicity mesuremetns of the host galaxies
GRB
12+log10(O/H)ab
log
N2
bestc
980425
-
7.3
060505
-
7.2
080517
7.2
031203d
8.3
060614
7.3
030329
7.8
120422A
-
7.3
050826
7.5
111225A
-
-
-
-
130427A
7.4
(
8.70/8.34
-
7.3–7.2)e
090417B
8.6–8.9
-
8.6–8.9
7.2–7.8f
061021
8.51/8.43
8.28–8.66
7.5
011121
7.2
120714B
7.5
{tabnote}
a KK04 calibration method is utilized.
b The estimation errors are 0.1 unless otherwise stated.
c The best estimates as described in the Appendix.
d Possibly contaminated by an AGN.
e Derived from the emission line fluxes by K15.
f assumed value (see the Appendix)
5.2 Stellar mass and SFR
Stellar mass () and SFR of the low-redshift GRB host galaxies are listed in table 5.2. The stellar masses of the host galaxies of GRB 060614, 090417B, and 130427A are derived by the SED fitting assuming the Chabrier IMF as described in section 4, and are broadly consistent with previously reported results (Savaglio et al., 2009; Xu et al., 2013b; Perley et al., 2013). The GRB 111225A host galaxy is detected only in 4 bands (, and , see table 5.2), and it is difficult to derive the properties of this host galaxy from its SED. However, we can naively estimate its stellar mass as assuming typical mass-to-luminosity ratio of galaxies at similar redshifts (Kauffmann et al., 2003a). We collect measurements of the other host galaxies from the literature. When in the literature is derived assuming an IMF other than the Chabrier IMF, we rescale the mass assuming: (Chabrier, 2003; Brinchmann et al., 2004), for consistency.
We derive SFR of the host galaxies from their extinction corrected H fluxes assuming the global Kennicutt-Schmidt law (Kennicutt, 1998) and the same scaling factor between the different IMFs as mentioned above. We note that major part of the errors of SFR is propageted from the error of in most of the cases. The host galaxy of GRB 060505 is spatially extended over a few 10 arcsec, and only a part of the emission line fluxes is collected in the slit, and hence we adopt a SFR measured from ultraviolet photometries without dust correction instead (Castro Cerón et al., 2010). Although the dust-uncorrected SFR is much larger than that suggested from the H flux with the large slit-loss, the actual SFR with dust correction might be further high. The emission lines of the GRB 120714B host galaxy were detected over the optical afterglow (Fynbo et al. (2012); K15), and the fraction of the host galaxy light in the slit is not known. Hence we consider the obtained SFR for the host galaxies of GRB 060505 and 120714B as lower-limits.
Photometries of the host galaxy of GRB 111225A
{tabnote}
Magnitudes are in the AB system, and not corrected
for the foreground extinction in the MW [, Schlafly & Finkbeiner (2011)].
† 2-limit.
Dust extinction, stellar mass and SFR of the host galaxies
GRB
SFR [yr-1]bc
980425
0.290.11
9.220.52 [1]
0.30.1
060505
0.500.01
9.640.02 [2]
1.1 [3]
080517
0.480.05
9.50 [4]
7.2
031203d
0.01
8.260.45 [1]
7.50.2
060614
0.070.06
[5]
030329
0.1
7.91 [1]
0.71
120422A
0.330.03
8.950.04 [6]
1.650.15
050826
0.07
10.10 [1]
1.17
111225A
-
8.6 [5]
-
130427A
0.320.06
[5]
2.82
090417B
-
[5]
1.25
061021
0.240.16
[7]
0.07
011121
0.25
9.670.17 [8]
2.8
120714B
0.040.07
-
0.2
{tabnote}
a estimated from the Balmer decrement
b The Chabrier IMF is assumed. The numbers in the square brackets are references as listed below.
c SFR is derived from the H flux in table 5.1
and in the second column unless otherwise stated.
d Possibly contaminated by an AGN.
e The extinction correction is based on the result of the SED fitting: .
References: 1. Levesque et al. (2010b), 2. Thöne et al. (2008), 3. Castro Cerón et al. (2010), 4. Stanway et al. (2015),
5. This work, 6. Schulze et al. (2014), 7. Vergani et al. (2015), 8. Küpcü Yoldaş et al. (2007)
6 Models of the metallicity distribution
6.1 Global properties of star-forming galaxies
To investigate the relation between metallicity and GRB occurrence, we compare the metallicity distribution of the low-redshift sample presented in section 5 with the metallicity distribution of star forming galaxies at similar redshifts. Following Stanek et al. (2006) and Niino (2011), we compute the metallicity distribution of star forming galaxies using the empirical formulation of stellar mass function [], -SFR relation (so called “galaxy main-sequence”), and - relation of galaxies. In this study, we assume by \authorciteBaldry:2012a (\yearciteBaldry:2012a, blue population), the -SFR relation by \authorciteSalim:2007a (\yearciteSalim:2007a, see their equation 11, scatter dex), and the - relation computed with the KK04 calibration by Kewley & Ellison (2008).
We only consider the mass range log 8.0, below which the properties of galaxies are not well constrained. This mass limit is also comparable to the lowest-mass GRB host galaxies in the low-redshift sample. and SFR in the formulations are rescaled to be consistent with the Chabrier IMF. The scatter of the - relation is largely dependent on in the sense that the scatter is larger at smaller . Here we assume a simple formulation:
| (3) |
which is broadly consistent with the scatter of the - relation discussed in Tremonti et al. (2004).
It should be noted that Kewley & Ellison (2008) derived the - relation using galaxy spectra obtained by the SDSS whose fiber spectrograph covers only the central \timeform3” of each galaxy. Hence it is possible that the systematic loss of light from the outskirts of galaxies affects the derived metallicities, because galaxies often have lower metallicity in their outskirts than at their centers (so called metallicity gradient, e.g., Shields & Searle (1978)). Some of the low-redshift GRB host galaxies might also suffer from similar problems. However, Niino (2012) examined correlation between measured metallicities and fraction of light covered by the spectrograph using a sample of galaxies with similar and SFR in the SDSS, and found that the dependence of derived metallicities on the fiber coviring fraction is small ( dex, see figure 5 of Niino (2012)). Thus we consider that the systematic loss of light from the outskirts of galaxies does not significantly affect our metallicity measurements
Although it is suggested that there is a correlation between SFR and metallicity of galaxies with similar stellar masses (Ellison et al., 2008; Mannucci et al., 2010; Lara-López et al., 2010), the observed correlation between SFR and correlation is not quantitatively understood and possibly affected by sample selections and metallicity calibration methods (e.g. Yates et al. (2012); Niino (2012); Andrews & Martini (2013)). Hence we do not consider the correlation in our baseline model, and discuss the effects of the SFR- correlation on our results in section 8.1.1.
In this study, we consider normalized probability distribution function (PDF) of GRB host galaxy metallicities when we compare the model predictions to the observations. We note that the absolute scale of the stellar mass function (), and also the absolute scale and the scatter of the -SFR relation do not affect the predicted metallicity PDF. Niino (2011) have shown that the choice of the formulations of the stellar mass function and the -SFR relation does not significantly affect the predicted metallicity PDF, as far as the stellar mass function and the -SFR relation that represent field star forming galaxies are selected.
6.2 Internal metallicity variation within a galaxy
Observations of some nearby galaxies (MW, the Magellanic Clouds, and M31) show that inter-stellar medium (ISM) in a galaxy is not chemically homogeneous. Hence the metallicity of a GRB progenitor star might be different from the metallicity of the host galaxy which we can measure by follow up spectroscopies.
To examine metallicity variation of star forming regions within a galaxy, we consider observed metallicity distributions of H\emissiontypeII regions in nearby galaxies. Although recent integral field unit (IFU) spectroscopies provides us with spatially resolved map of metallicity in some star forming galaxies, the spatial resolution of such observations are still limited to 100 pc in most of the cases (e.g., Sánchez et al. (2012)). Hence the spectroscopy of individual H\emissiontypeII regions (except for giant ones) can be performed only in a few nearby galaxies.
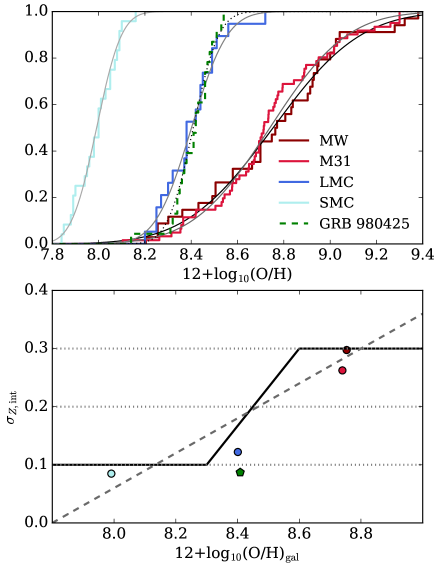
In the upper panel of figure 6, we show the metallicity distributions of H\emissiontypeII regions in the MW (solar-neighborhood, Afflerbach et al. (1997)), the large/small Magellanic clouds (LMC and SMC, Pagel et al. (1978)), and the Andromeda galaxy (M31, Sanders et al. (2012)). It is possible that the metallicity estimates of the faint H\emissiontypeII regions in the M31 sample by Sanders et al. (2012) have systematic errors (Niino et al., 2015), and hence we consider only H\emissiontypeII regions with H luminosity [erg s-1] in the M31 sample. The H luminosities of the H\emissiontypeII regions are taken from Azimlu et al. (2011). See Niino et al. (2015) for the detail of the catalog matching between the samples of Azimlu et al. (2011) and Sanders et al. (2012).
The metallicities of the H\emissiontypeII regions can be represented by log-normal distributions but with different median value and dispersion in different galaxies. The median and the scatter of the H\emissiontypeII region metallicity distributions in the nearby galaxies [12+log10(O/H)gal and ] are shown in the lower panel of figure 6. Although the sample number is small, it is seen that the galaxies with the higher median metallicity have larger scatter of the distribution. As a baseline model, we assume a broken linear relation between 12+log10(O/H)gal and as shown in the lower panel of figure 6:
| (8) |
considering 12+log10(O/H)gal equals to the representative metallicity of a galaxy which we obtain by spectroscopically observing the galaxy without spatially resolving it. We also discuss the results with different formulations in section 8.1.2.
In figure 6, we plot the metallicity distribution of H\emissiontypeII regions in the GRB 980425 host galaxy together with those in the local galaxies. The GRB 980425 host galaxy is the nearest GRB host galaxy known and the only GRB host galaxy for which metallicity is measured with a spatial resolution kpc, although the resolution pc is much larger than that achieved for the local galaxies (e.g., pc for M31, Sanders et al. (2012)). The internal metallicity variation observed within the GRB 980425 host galaxy is naively consistent with those seen in the Magellanic clouds.
Metallicity distribution of young stars which are formed in a galaxy might be significantly different from the metallicity distribution of H\emissiontypeII regions in the galaxy, if metallicity and SFR of H\emissiontypeII regions are correlated with each other. Niino et al. (2015) examined the correlation between H luminosity and metallicity of H\emissiontypeII regions in M31 using the narrow band photometric data by Azimlu et al. (2011) and the spectroscopic data by Sanders et al. (2012). Although it is suggested that metallicity measurements of faint H\emissiontypeII regions with H luminosity [erg s-1] have luminosity dependent systematic error depending on the metallicity calibrator, no correlation was seen for H luminosity [erg s-1]. Hence, we consider that the correlation between metallicity and SFR of H\emissiontypeII regions would not be strong even if it exists, although the existence of the correlation is not robustly ruled out.
The metallicities of the nearby H\emissiontypeII regions discussed in this section are measured using different metallicity calibration methods than the KK04 calibration which we utilize in this study, and it is known that different metallicity calibrations are often inconsistent with each other (Kewley & Ellison, 2008). We consider this possible inconsistency as a part of the uncertainty of which we discuss in section 8.1.2.
It is broadly agreed that the metallicity decreases as the galactocentric radius increases in many galaxies (e.g., Shields & Searle (1978)). However, we note that a scatter around the gradient at each radius is also significant. The scatter of metallicity at each galactocentric radius can be comparable to (or evan larger than) the radial variation (e.g., Sanders et al. (2012)), and lowest-metallicity H\emissiontypeII regions in a galaxy may reside close to the center of the galaxy.
It should be noted that the scatter of the metallicities in each galaxy may in part result from uncertainties of the metallicity measurements. However, similar variation of metallicity is also found in the MW using stars with ages of Gyr as a tracer of metallicity (Schlesinger et al., 2012). Furthermore, in the M31 H\emissiontypeII region sample of Sanders et al. (2012), the weak auroral line [O\emissiontypeIII]4363 is detected for four H\emissiontypeII regions. With the electron temperature () method of metallicity measurement using the auroral line (e.g., Garnett (1992)), which is not affected by uncertainties of the photoionization models, they showed that the four H\emissiontypeII regions have 12+log10(O/H) 8.3–8.4. It is generally difficult to detect an auroral line of a high-metallicity H\emissiontypeII region, and it is not surprising that the four H\emissiontypeII regions with the auroral line detections are biased towards low-metallicities. However, the method measurements provides a confirmation that some H\emissiontypeII regions in M31 have low-metallicity in reality.
6.3 Metallicity of progenitor stars and GRB production efficiency
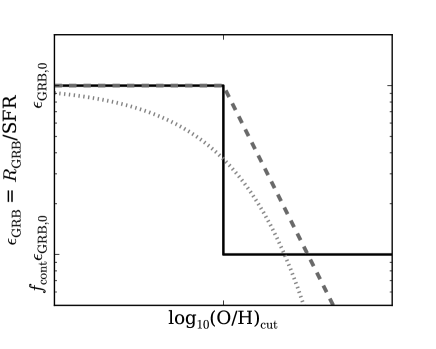
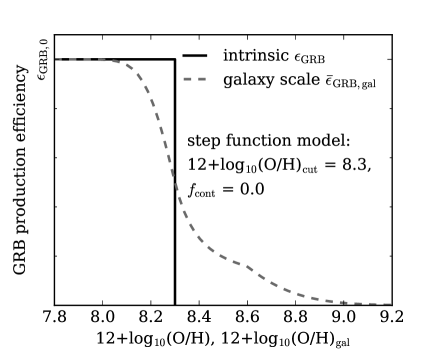
We parameterize the relation between GRB production efficiency (/SFR) and metallicity of a population of young stars. As discussed in section 6.2, the metallicity of the stellar population may be different from that of the host galaxy. Here we consider that is suppressed above a threshold metallicity (O/H)cut by a factor of which is not necessarily zero (step function model):
| (11) |
We note that absolute scale of the efficiency (i.e., ) is marginalized when we consider normalized metallicity PDF of galaxies.
We also consider the cases with the power-law model:
| (14) |
and with the exponential model:
| (15) |
The schematic picture of the models is shown in figure 7
GRB rate of a galaxy with a given set of SFR and 12+log10(O/H)gal (median metallicity of star forming regions in the galaxy) can be obtained by performing the following integration:
| (16) |
where is the metallicity distribution of star forming regions in the galaxy which is represented by a log-normal distribution with a median value that corresponds to 12+log10(O/H)gal and a log scale scatter (see section 6.2).
7 Results
Assuming , the -SFR relation, and the - relation, we compute number density of galaxies in the parameter space of , SFR, : [Mpc-3dex-3]. The expected metallicity distribution of GRB host galaxies can be derived integrating over and SFR weighted with (equation 16).
Each model discussed in section 6.3 has two free parameters: [(O/H)cut, ], [(O/H)cut, ], or [(O/H)cut, ]. The parameter (O/H)cut determines the cutoff metallicity above which the GRB production efficiency is suppressed, and , , or determines the sharpness of the cutoff. We search for parameter sets that reproduces the observed metallicity distribution of the low-redshift sample, through the parameter ranges , , , and with intervals of , and .
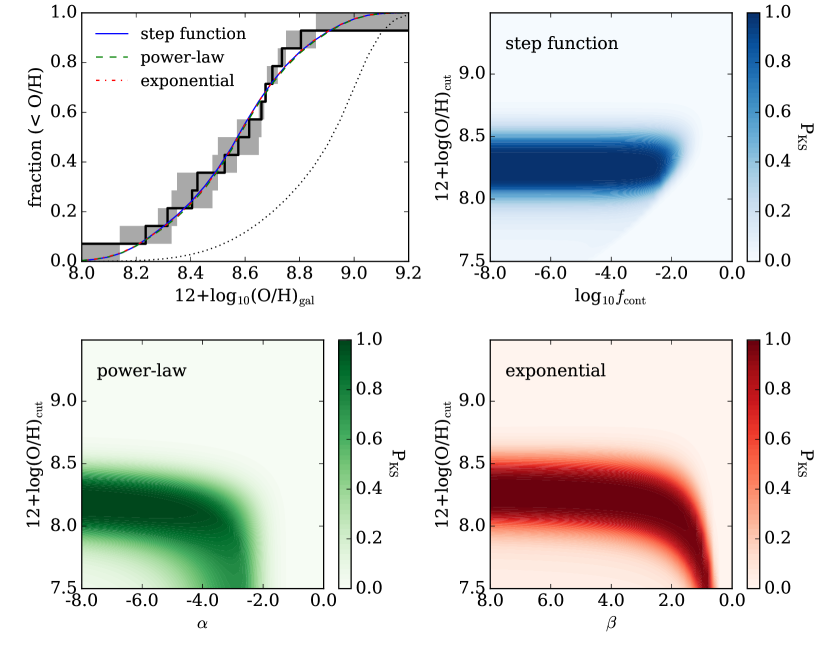
The goodness of fit is determined using the Kolmogorov-Smirnov (KS) test against the “median” distribution shown in the upper left panel of figure 8. Although the metallicity of the GRB 111225A host galaxy is not measured and those of the host galaxies of GRB 061021 and 090417B are not precisely constrained (see section 5.1), the uncertainties of these metallicities do not significantly affect the overall metallicity distribution of GRB host galaxies. The resulting parameters from the fitting are not significantly changed within the range of this uncertainty.
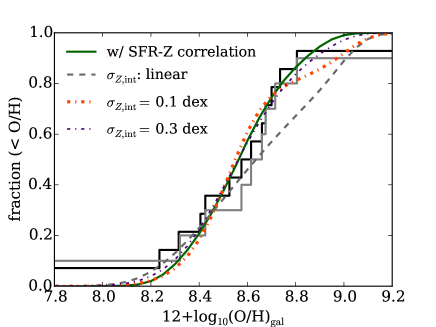
The bestfit model distributions are plotted in the upper left panel of figure 8 together with the metallicity distribution of the low-redshift sample. The best fitting metallicity distributions with the three different models are very similar to each other. The SFR weighted metallicity distribution predicted from the same , the -SFR relation, and the - relation, which the GRB host galaxies would follow if is not dependent on metallicity, is also shown together.
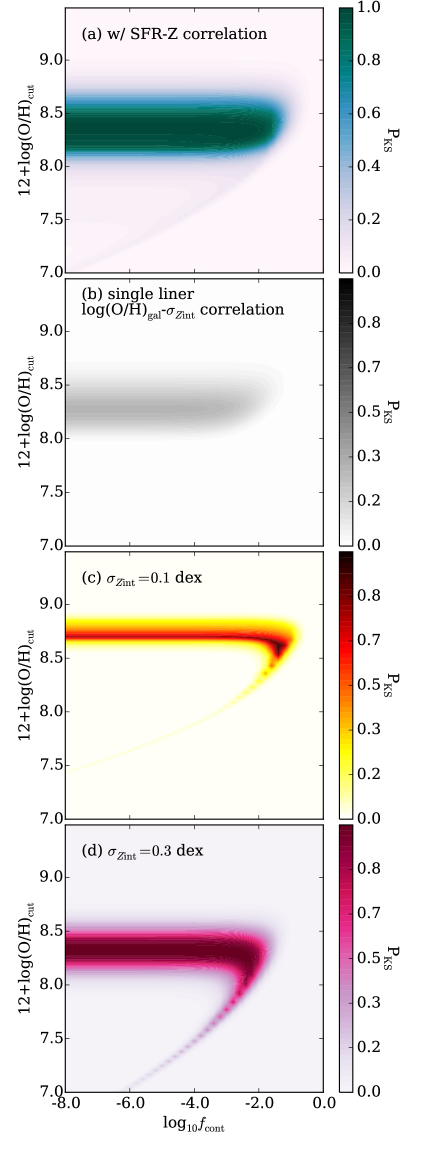
The acceptable range of the parameters are shown as contour maps of the K-S test probability in figure 8. The parameter ranges that the are:
- step function:
-
12+log10(O/H),
- power-law:
-
12+log10(O/H),
- exponential:
-
12+log10(O/H),
The degeneracy between the two parameters is seen in the cases of the power-law and exponential models. The best fit 12+log10(O/H)cut is 8.3, and the sharper cutoff reproduces the observations better in any of the models. This means that majority of low-redshift GRB host galaxies have higher metallicity than 12+log10(O/H)cut above which GRBs cannot be produced. In other words, most low-redshift GRBs take place in star forming regions whose local metallicity is much lower than the representative value of their host galaxies.
The model distribution with the step function model of does not significantly depend on when log, and the distribution with is quite similar to the best fit distribution shown in the upper left panel of figure 8. We also note that, in the limit of (), the power-law (exponential) model of is identical to the step function model with . In the following, we only consider the step function model of with to examine the predicted properties of low-redshift GRB host galaxies with our models.
In figure 9, we compare the step function model of [12+log10(O/H)cut = 8.3, ] with that convolved over galaxy scale () as defined in equation 16. steeply declines with increasing metallicity at around 12+log10(O/H)cut. However, galaxies with 12+log10(O/H) 12+log10(O/H)cut have due to the internal variation of metallicity, and their contribution to the cosmic GRB rate density is significant because they play a dominant role in the cosmic star formation at low-redshifts. The steep decline of at 12+log10(O/H) is also reported by Graham & Fruchter (2015) based on a GRB host galaxy sample collected from a wider range of redshifts where metallicity measurements of GRB host galaxies are incomplete. We note that likely evolve with redshift because it depends on the properties of galaxies (e.g., ), unlike which would be determined by stellar physics.
In some cases, GRB positions are spatially resolved from the center (or brightest part) of the host galaxies (e.g., Modjaz et al. (2008)). Levesque et al. (2011) has shown that the metallicities at the GRB positions are systematically lower than that of their host galaxies by dex, but not necessarily as low as suggested by our results. Niino et al. (2015) pointed out that the actual metallicity of a GRB explosion site cannot be obtained with a spatial resolution kpc which is typical of the observations of GRB positions at , because the length scale of the ISM metallicity variation is kpc in nearby galaxies (e.g., Sanders et al. (2012)). Our results suggest that the actual metallicity of the GRB explosion sites (or the progenitor star itself) which is buried within the spatial resolution is significantly lower than the kpc scale metallicity currently observed, by up to 0.5 dex.
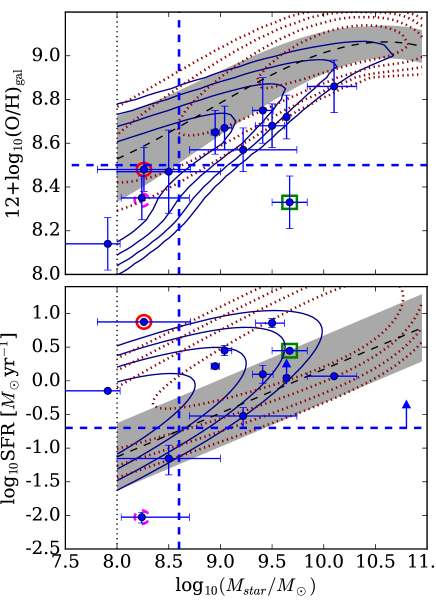
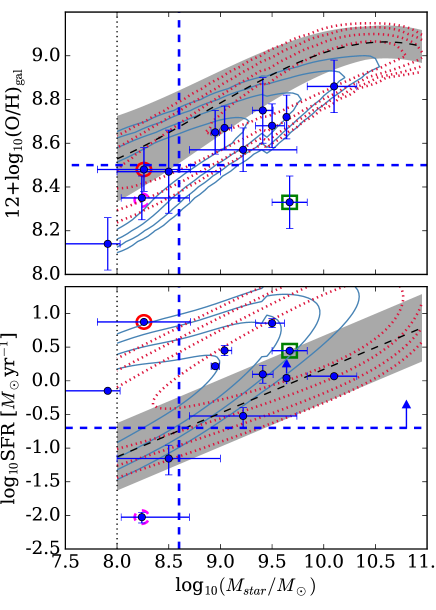
The weighted distribution of galaxies on the - and -SFR parameter planes, predicted using the step function model of with 12+log10(O/H)cut = 8.3 and , is plotted as contours in figure 10. The SFR weighted model distribution, the assumed - relation (Kewley & Ellison, 2008), the -SFR relation (Salim et al., 2007), and the observed properties of the low-redshift sample (table 5.1 & 5.2) are plotted together.
The observed GRB host galaxies construct a sequence which is offset from the - relation by 0.1–0.2 dex towards lower-metallicities, as previously noted by Levesque et al. (2010b) with a smaller incomplete sample, except for one remarkable outlier: the GRB 011121 host galaxy, whose N2 and metallicities do not agree well with each other. The weighted model distribution also shows similar offset on the - plane due to the higher in galaxies with lower 12+log10(O/H)gal. Although the offset of the observed GRB host galaxies may be slightly larger than that of the model distribution, this possible contradiction can be resolved by taking the SFR- correlation into account as we discuss in section 8.1.1.
In the -SFR plane, the predicted galaxy distributions with the SFR and weightings are offset from the -SFR relation by 0.5 dex (, as generally expected when the scatter of a relation is represented by a log-normal distribution). The observed GRB host galaxies are broadly consistent with the predicted offset, although the SFR scatter of the host galaxies with log is large.
The host galaxy of GRB 031203, which might have an AGN, agrees well with the sequence of other GRB host galaxies in the - plane, while it is largely offset towards higher-SFR in the -SFR plane. The outliner in the - plane, the GRB 011121 host galaxy, does not show any peculiarity in the -SFR plane. The host galaxy with the lowest SFR is that of GRB 060614 which is not associated with a SN. The GRB 060614 host galaxy does not show any peculiarity in the - plane.
8 Discussion
8.1 Uncertainties in the models of galaxies
The model predictions of the metallicity distribution depend not only on the model, but also on the underlying assumptions of the properties of galaxies. In this section, we examine how our results are affected by some galaxy properties which is not well understood, namely the SFR- correlation and the variation of metallicity within a galaxy.
8.1.1 The -SFR- relation of galaxies
To investigate the effect of the SFR- correlation, we consider the -SFR- relation by Mannucci et al. (2011), which is an extension of the relation by Mannucci et al. (2010) towards lower-. However, the metallicity calibration method used in Mannucci et al. (2011) is different from that used in this study (KK04). To examine the effect of the SFR- correlation in a consistent metallicity scale, we compute the gradient of the -SFR- relation around the galaxy main-sequence at each . And assume the gradient without changing the - relation (Kewley & Ellison, 2008), which has been used in the previous sections.
It should be noted that the scatter of the - relation at each may partly result from the SFR- correlation. Mannucci et al. (2010) showed that the metallicity scatter around the -SFR- relation is smaller by 50% than that of the - relation. Thus we assume the scatter of the -SFR- relation is 50% of that of the - relation defined in equation 3.
The resulting contour map and the bestfit metallicity distribution using the step function model are shown in figure 11 (top panel) and figure 12, respectively. Both the best fit parameters and the goodness of the fit are not significantly different from the case without the SFR- correlation. This situation is similar with the power-law and exponential models of .
The small effect of the SFR- correlation on the metallicity distribution is not surprising. The SFR- gradient around the galaxy main-sequence is in the low- range (log) and shallower in higher- ranges. Given that the GRB host galaxies have systematically higher-SFR than the main-sequence by 0.5 dex (section 7), the expected effect of the SFR- correlation is , which is smaller than the uncertainties of the metallicity measurements.
The SFR and weighted model distributions of galaxies on the - and -SFR planes, predicted assuming the SFR- gradient are shown in figure 13. The model and the parameters are the same as in figure 10. The SFR weighted galaxy distribution (i.e., no metallicity effect) on the - plane is also shifted towards lower-metallicities due to the SFR- correlation, but the shift is smaller than that of the weighted distribution. Furthermore, the GRB host galaxies have systematically lower- than the typical of the SFR weighted population (log), which cannot be explained solely by the effect of SFR- correlation (e.g., Campisi et al. (2011)).
Although the SFR- correlation does not significantly affect the overall metallicity distribution of the GRB host galaxies as mentioned above, the predicted number of GRB host galaxies above the - relation is reduced (figure 13, top panel). This improves the consistency between the predicted and observed distributions of GRB host galaxies on the - plane compared with the case without the SFR- correlation (figure 10).
8.1.2 The internal of galaxies
As mentioned in section 6.2, the detailed investigation of the internal ISM metallicity variation is performed only for a small number of nearby galaxies. Therefore, of general star forming galaxies and its correlation with other galaxy properties are highly uncertain. Given that the nearby high-metallicity galaxies, namely the MW and M31, have higher than the GRB host galaxies in our sample, it is possible that ISM in the GRB host galaxies have different properties to those in the nearby galaxies.
To investigate how our results depend on the assumed , we perform the parameter fittings assuming other formulations than the baseline model. Here we consider a single linear relation between 12+log10(O/H)gal and , and also constant of 0.1, 0.2, and 0.3 dex (figure 6, bottom panel). However, it should be noted that the constant is disfavored by observations.
The contour maps and the predicted metallicity distributions are shown in figure 11 and figure 12 for the cases with the single linear relation, and the constant of 0.1 and 0.3 dex. The single linear relation between 12+log10(O/H)gal and overpredicts the contribution of high-metallicity galaxies to the GRB production even with the best fit parameters, due to the large of galaxies with 12+log10(O/H). However, the statistical significance of the overprediction is low (). The best fit parameters are similar to the case with the baseline model.
When dex independently of 12+log10(O/H)gal, the preferred cutoff metallicity is 12+log10(O/H). This result is consistent with the previous studies without the internal metallicity variation being explicitly treated in which the cutoff of the GRB efficiency at 0.5–1 is suggested (e.g., Wolf & Podsiadlowski (2007); Kocevski et al. (2009); Perley et al. (2016b); Vergani et al. (2015); Japelj et al. (2016)). Even in this case, high in high-metallicity stellar population is disfavored ().
When dex, the cutoff metallicity is 12+log10(O/H), which is close to the results with the baseline model. The results with the the constant 0.2 dex are similar with those with 0.1, and 0.3 dex, but with 12+log10(O/H).
8.2 Possible subpopulations
Some of the low-redshift GRBs are less energetic than typical GRBs that are observed up to higher-redshifts (hereafter classical GRBs), and possibly are different kind of phenomena. These bursts, so called low-luminosity GRBs, have isotropic equivalent gamma-ray energy [erg] (e.g., Bromberg et al. (2011); Nakar (2015)). Stanek et al. (2006) have shown that of a GRB might be dependent on the metallicity of its host galaxy based on observations of the host galaxies of 5 GRBs/XRFs at redshifts , while later studies (Levesque et al., 2010d; Japelj et al., 2016) have shown that there is no significant correlation between them with a larger sample from wider range of redshifts (up to ).
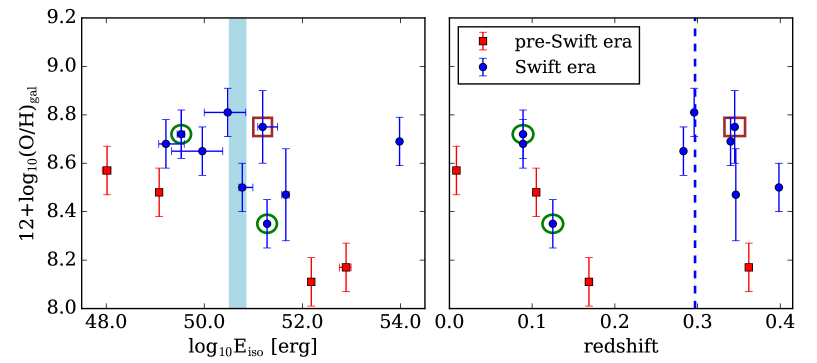
Because low-luminosity GRBs can be detected only at low-redshifts , the comparison of the host galaxies and low-luminosity GRBs and with those of classical GRBs at might be affected by evolution of galaxy populations over the redshits. Thus it is interesting to revisit the correlation between and host metallicity with our sample limited to low-redshifts but much larger than that of Stanek et al. (2006). of the low-redshift GRBs and 12+log10(O/H)gal are shown in the left panel of figure 14.
Although the GRBs in the pre-Swift era (until 2004) shows a trend that GRBs with larger occurr in lower-metallicity galaxies as reported in Stanek et al. (2006), we do not find significant correlation between and 12+log10(O/H)gal when GRBs in the Swift era are included (correlation coefficient is -0.36).
GRB 060505 and 060614 are widely known as GRBs which are not associated with SNe (Gehrels et al., 2006; Fynbo et al., 2006; Della Valle et al., 2006; Gal-Yam et al., 2006), and it is possible that they are actually short GRBs that do not result from core-collapse of massive stars despite their long duration sec (e.g., Zhang et al. (2009)). These bursts are marked with circles in figure 14. The host metallicities and of GRB 060505 and 060614 are typical of low-redshift GRBs in our sample. The metallicity distributions of the GRB host galaxies excluding GRB hosts with possible systematic error in their metallicity measurements or with uncertain burst classifications (GRB 011121, 031203, 060505, and 060614) is shown in figure 12. The metallicity distribution without these peculiar objects does not significantly differ from the distribution of the whole sample.
8.3 Sampling biases
In this study, we have presented the overall metallicity distribution of the host galaxies of all GRBs known at . However, the fraction of GRBs with spectroscopic redshifts are 30% even in recent observations (e.g., Perley et al. (2016a)), and hence we may suffer from the redshift determination bias by collecting GRBs with known redshifts.
8.3.1 Optically “dark” GRBs
One possible source of the redshift determination bias is “dark” GRBs (e.g., Jakobsson et al. (2004); Greiner et al. (2011)). A “dark” GRB is a GRB with a fainter optical afterglow than expected from its X-ray spectrum. Roughly 1/3 of GRBs are “dark”, and most of them (%) result from dust extinction, while some may result from absorption by neutral hydrogen in inter-galactic medium at high-redshifts (Cenko et al., 2009; Zheng et al., 2009; Greiner et al., 2011). Redshift determination of GRBs largely relies on optical spectroscopy of afterglows, and it is difficult to determine redshifts of “dark” GRBs. Thus a sample of GRB host galaxy with known redshifts may be biased against dusty galaxies which may tend to have higher-metallicity.
However, at low-redshifts, detection of a GRB host galaxy is not quite challenging in most of the cases. Assuming the stellar-mass to luminosity ratio derived by Kauffmann et al. (2003a), a galaxy with , which is typical of the low-redshift GRB host galaxies, would be observed with band magnitude at . Once the host galaxy of a GRB is detected, X-ray afterglow localization by Swift/XRT with typical precision of a few arcseconds, which is available for % of the Swift/BAT-detected GRBs, can associate the GRB to the host galaxy with a certain level of confidence (Perley et al., 2013). And the redshift can be determined using emission lines of the host galaxy.
In reality, many redshifts of the low-redshift GRBs are determined by the emission lines of the host galaxies (table 2), including that of a “dark” GRB 090417B (marked with a square in figure 14), while redshift determination by host emission lines is rarely available at higher redshifts. The fraction of the GRBs whose redshifts are determined only by the host emission lines in the low-redshift sample (8/14) is naively comparable to the fraction of GRBs without known redshifts in the Swift/BAT-detected GRBs. Thus the bias against GRBs in dusty environment is not necessarily effective at low-redshifts.
8.3.2 GRBs in faint host galaxies
It is possible that GRBs whose redshifts are determined with the emission lines of their host galaxies are biased against GRBs that occurred in galaxies with weak emission line fluxes. Emission line luminosities of a galaxy is largely dependent on SFR in the galaxy, which correlates with and 12+log10(O/H)gal, in the sense that galaxies with higher and 12+log10(O/H)gal have more luminous emission lines. Hence GRBs that occurred in very low-metallicity host galaxies might be systematically missed in the low-redshift sample, especially at higher-end of the redshift range where detection of weak emission lines are difficult. However, such redshift dependent metallicity bias is not seen in our sample (the right panel of figure 14, correlation coefficient is 0.007).
It is also interesting to compare the expected rate of low-redshift GRBs to the actual finding rate to evaluate the success rate of identifying low-redshift GRBs. Based on the largest unbiased GRB survey to date (SHOALS), Perley et al. (2016a) estimated the event rate density of bright GRBs with [erg] at to be [yr-1Gpc-3]. Considering the field of view of Swift/BAT (1.4 steradian) and the operation time until the end of March 2014 (9.3 years since December 2004), the expected number of bright GRBs detected by Swift/BAT at in this time period is . On the other hand, the number of Swift/BAT-detected GRBs with [erg] in our sample is 4 (figure 14), which suggests that the success rate of redshift determination is higher at low-redshifts compared with that of the overall population of GRBs, although the estimation of the GRB rate density is still uncertain. The faint end of the GRB luminosity function is still controversial affected by sample selections and model assumptions (e.g., Schmidt (2001); Wanderman & Piran (2010); Salvaterra et al. (2012)). Hence it is difficult to estimate the actual rate and evaluate the redshift success rate of low-luminosity GRBs.
On the other hand, it is also true that redshift determination of a GRB has failed (partly) due to the weak emission line of the host galaxy. As mentioned in section 3.4, the redshift of GRB 111225A has not been determined until Thöne & de Ugarte Postigo (2014) reports detections of weak emission lines over the afterglow together with a marginal absorption line using an updated analysis tool. The failure of the redshift determination in the immediate follow up observations after the burst suggests that GRB host galaxies with might be missed in redshift selected samples, given that the stellar mass of the GRB 111225A host galaxy is naively (section 5.2).
8.3.3 Contamination by foreground galaxies
Another interesting case is the identification of the host galaxy of GRB 020819B. GRB 020819B has been considered to be a low-redshift burst at since radio afterglow observations by Jakobsson et al. (2005) localized the burst on a “blob” which resides \timeform3” from a spiral galaxy at , and further observations of the host galaxy by Levesque et al. (2010c) suggested that the “blob” also resides at . However, recent extensive observations of the host galaxy by Perley et al. (2016c) showed that the “blob” is actually a dusty starforming galaxy at , and the low-redshift spiral galaxy is possibly a foreground object unrelated to the GRB.
Hence it is possible that a few of the low-redshift GRBs in our sample whose redshifts are obtained only via their host galaxies actually reside in high-redshift galaxies which are too faint to be observed, and currently claimed host galaxies at low-redshifts are foreground objects. Although most of the low-redshift GRBs are closely located to the center of their host galaxies within \timeform1” unlike GRB 020819B, it is difficult to robustly confirm that a “low-redshift” GRB is actually at a low-redshift when the GRB does not have an afterglow measured redshift or a confirmed SN association (GRB 060505, 080517, 060614, 050826, and 090417B, see table 2). Furthermore, among the low-redshift GRBs without robust redshift confirmations, GRB 060505 and 080517 have offsets \timeform2” from the center of their host, although the large offsets are not surprising given their very low-redshifts .
It should be noted that the originally claimed host galaxy of GRB 020819B at was a massive-spiral galaxy with the highest metallicity in the known GRB host galaxies. When a GRB host galaxy sample is contaminated by unrelated forground galaxies, it is possible that the contaminants tend to be brighter galaxies because they can be found more easily than the actual host galaxies which are likely faint.
Missing redshift informations for GRBs in faint galaxies and contamination by bright foreground galaxies may bias the metallicity distribution of the overall population towards higher-metallicities, in contrast to what is expected in the case of the bias against “dark” GRBs.
9 Conclusions
We have presented the overall metallicity distribution of the host galaxies of all GRBs known at that occurred before the end of March 2014, including the newly obtained emission line fluxes of the host galaxies of GRB 060614, 090417B, and 130427A. The low-redshift sample of GRB host galaxies with complete metallicity measurements is essential to study the nature of GRB progenitor in some aspects: 1) the high success rate of redshift determinations and host identifications, 2) the reporting bias can be eliminated by completing the metallicity measurements, and 3) a wealth of comparison sample is available.
We have compared the metallicity distribution of the low-redshift sample with the predictions from the empirical formulations of the properties of low-redshift galaxies. To predict the metallicity distribution, we adopted models of GRB efficiency () as functions of metallicity. The metallicity of the progenitor stars considered here is not necessarily identical to that of its host galaxy. Instead, we considered the metallicity variation within each galaxy motivated by the observations of H\emissiontypeII regions in nearby galaxies.
The three different formulations of , namely the step function, power-law, and exponential models are examined. Each of the three models has two free parameters that can be used to fit the metallicity distribution of the host galaxies. In either case, function with a sharp cutoff around 12+log10(O/H) 8.3 () reproduces the metallicity distribution of the low-redshift sample best. This cutoff metallicity is naively consistent with those predicted by the stellar evolution models ( 0.1–, Yoon & Langer (2005); Hirschi et al. (2005); Woosley & Heger (2006)). models with moderate or weak metallicity dependence [] are disfavored, although the statistical significance of the current constraints is still low.
This result is in contrast to the results of some previous studies which have suggested the cutoff metallicity 0.5– (e.g., Wolf & Podsiadlowski (2007); Kocevski et al. (2009); Vergani et al. (2015); Perley et al. (2016b); Japelj et al. (2016)). This is because we take the internal variation of metallicity within each galaxy into account. Our galaxy models also indicate the cutoff metallicity around 0.5–1, when the internal metallicity variation is assumed to be smaller (0.2–0.1 dex) in any galaxy. However, the current model of the internal metallicity variation relies on the observed metallicity distributions of H\emissiontypeII regions in a small number of local galaxies, and the actual internal metallicity variation in GRB host galaxies is hardly known. This uncertainty possibly affect our results significantly.
The effect of the correlation beween SFR and metallicity of galaxies on the predicted metallicity distribution is smaller than the uncertainty of metallicity measurement. However, it may improve the agreement of the predicted and observed distribution of the GRB host galaxies on the parameter plane of versus . The relation between the nature of GRB progenitor stars and the observable properties of their host galaxy depends on the internal and global properties of galaxies. Better understanding on the general population of galaxies at each redshift is essential to obtain more robust constraints on the properties of GRB progenitors, in addition to gathering larger less biased sample of GRB host galaxies.
Because we collected GRBs with known redshifts () in this study, it is possible that the sample of the host galaxies is biased for a kind of galaxy population in which GRB redshift determination is easy (e.g., galaxies with smaller dust content), although the GRB redshift determination is generally easier at lower-redshifts. However, the number of low-redshift GRBs in our sample is close to the number expected from the latest unbiased surveys, suggesting a high success rate of redshift determinations at low-redshifts, although the statistical error is still large. Furthermore, the obtained metallicities do not show significant systematic trend with respect to burst energy () and redshift. Thus there is no sign that the low-redshift sample of the GRB host galaxies is biased compared to the actual population of GRB host galaxies, although the tests are not robust yet.
On the other hand, the failure of the redshift determination of GRB 111225A in the immediate follow up observations after the burst suggests that faint (and thus low-metallicity) host galaxies might be systematically missed in the redshift selected sample. It is also possible that a few low-redshift galaxies which are aligned in the foreground of higher-redshift GRBs contaminate the low-redshift sample as in the case of GRB 020819B. The more precise estimation of the GRB rate density and their properties, including those of high-redshift bursts which might contaminate low-redshift samples, will enable us to evaluate sampling biases in the redshift selected sample robustly.
We thank Gemini and Subaru observatory staffs for their kind support for the observations. YN is supported by the Research Fellowship for Young Scientists from the Japan Society for the Promotion of Science (JSPS). This research has made use of the GHostS database (www.grbhosts.org), which is partly funded by Spitzer/NASA grant RSA Agreement No. 1287913. Thanks are also due to Nathaniel R. Butler, Jochen Greiner, and Daniel A. Perley, for producing the useful online databases. We would also like to thank the anonymous referee for helpful comments.
Metallicity determination of each host galaxy
-
•
GRB 980425 host galaxy: the N2 method indicates and log = 7.3, while the method does not have any valid solution. The [O\emissiontypeIII]4959 flux is not measured in Christensen et al. (2008), and we assume theoretically expected line ratio of [O\emissiontypeIII]4959/[O\emissiontypeIII]5007 = 1/3 (e.g., Rosa (1985); Storey & Zeippen (2000)). The lack of solution generally suggests 8.1–8.7, which is consistent with the N2 solution in this case. We adopt the N2 solution as the best estimate of the metallicity of this host galaxy.
-
•
GRB 060505 host galaxy: the N2 method indicates and log = 7.2 (the best estimate). The method does not have valid solution.
-
•
GRB 080517 host galaxy: the emission line strength is presented as equivalent widths in Stanway et al. (2015). We derive the emission line fluxes assuming the continuum flux density to be 0.8, 1.7, and 1.5 erg s-1cm-2Å-1 at the wavelength of [O\emissiontypeII], H–[O\emissiontypeIII], and H–[N\emissiontypeII], respectively. The N2, upper-branch, and lower-branch solutions are , 8.68, and 8.38, with log = 7.2, 7.2, and 7.1, respectively. We adopt the upper-branch solution as the best estimate.
-
•
GRB 031203 host galaxy: the N2 method indicates (log = 8.6), and the method provides two solutions of and 8.32 (so called upper-/lower-branches, with log = 8.3 and 8.2, respectively).
KK04 calibrated the metallicity indicators in a range of ionization parameter , and we need to extrapolate the relation when log is outside of this range. Because the N2 index is sensitive to the ionization parameter, we do not consider the N2 solution for this host galaxy reliable, although the indicated super-solar metallicity suggests the upper-branch solution of the method is more likely than the lower-branch solution. Thus we adopt the upper-branch solution as the best estimate. The upper-branch is less sensitive to the ionization parameter than the lower-branch and the N2.
-
•
GRB 060614 host galaxy: due to the non-detection of [N\emissiontypeII] line, we can put only upper-limit on the N2 index (N2 ). The [O\emissiontypeIII]4959 line coincides with an strong night-sky emission line, and the flux can not be measured from the observed spectra. Hence we assume the theoretically predicted line ratio of [O\emissiontypeIII]4959/[O\emissiontypeIII]5007 = 1/3. The upper- and lower-branch solutions of the method are and 8.35 with log = 7.4 and 7.3, respectively. Assuming log = 7.3–7.4, the N2 upper-limit indicates . Thus we adopt the lower-branch solution as the best estimate.
-
•
GRB 030329 host galaxy: the N2, upper-branch, and lower-branch solutions are , 8.75, and 8.14, with log = 7.8, 8.2, and 7.8, respectively. We adopt the lower-branch solution.
-
•
GRB 120422A host galaxy: the N2 method indicates and log = 7.3 (the best estimate). The method does not have valid solution.
-
•
GRB 050826 host galaxy: the N2, upper-branch, and lower-branch solutions are , 8.86, and 8.14, with log = 7.5, 7.5, and 7.3, respectively. We adopt the upper-branch solution.
-
•
GRB 130427A host galaxy: The N2, upper-branch, and lower-branch solutions are , 8.67, and 8.33, with log = 7.4, 7.4, and 7.3, respectively. We adopt the upper-branch solution as the best estimate. However, we note that the FOCAS TOO spectrum from which we measure the emission line fluxes of [O\emissiontypeII]3727, H, and [O\emissiontypeIII]4959,5007, is obtained without ADC. Hence it is possible that the line fluxes suffer from differential atmospheric refraction.
To evaluate the effect of this systematic uncertainty, we also examine the independently measured emission line fluxes reported in K15 (shown in table 5.1). The K15 line fluxes are systematically weaker than those in the GMOS+FOCAS spectra possibly due to larger loss of light at the slit, however we can compare relative flux ratios between the lines.
With the K15 line fluxes, the N2, upper-branch, and lower-branch solutions are , 8.70, and 8.34. We note that the detection of the [N\emissiontypeII] line is marginal in K15 (S/N = 2.5). Although it is difficult to determine which of the solutions is true only with the K15 spectrum, if we adopt the upper-branch solution as suggested by our GMOS spectrum, it agrees well with the estimate from the GMOS+FOCAS spectra.
-
•
GRB 090417B host galaxy: the [O\emissiontypeII], H, and [O\emissiontypeIII] line fluxes are not known. Assuming log (the parameter range covered by the other GRB host galaxies in the sample excluding that of GRB 031203), the N2 method indicates = 8.6–8.9.
-
•
GRB 061021 host galaxy: the [N\emissiontypeII] line is not detected providing N2 . The upper-branch and lower-branch solutions are and , respectively (log = 7.5 in either case). The N2 upper-limit is not deep enough to reject either of the solutions. Combining the upper-branch and lower-branch solutions, we estimate the metallicity of this host galaxy to be 8.28–8.66.
-
•
GRB 011121 host galaxy: the N2, upper-branch, and lower-branch solutions are , 8.69, and 8.33, with log = 7.2, 7.4, and 7.2, respectively. We adopt the lower-branch solution.
-
•
GRB 120714B host galaxy: the N2 method indicates , although the detection of the [N\emissiontypeII] line is marginal. The method, which is not affected by the low-S/N of the [N\emissiontypeII] line, provides the upper-branch and the lower-branch solutions: and 8.43, respectively (log = 7.5 in either case). We adopt the upper-branch solution, which agrees with the N2 solution.
References
- Afflerbach et al. (1997) Afflerbach, A., Churchwell, E., & Werner, M. W. 1997, ApJ, 478, 190
- Allende Prieto et al. (2001) Allende Prieto, C., Lambert, D. L., & Asplund, M. 2001, ApJ, 556, L63
- Andrews & Martini (2013) Andrews, B. H., & Martini, P. 2013, ApJ, 765, 140
- Azimlu et al. (2011) Azimlu, M., Marciniak, R., & Barmby, P. 2011, AJ, 142, 139
- Baldry et al. (2012) Baldry, I. K., et al. 2012, MNRAS, 421, 621
- Baldwin et al. (1981) Baldwin, J. A., Phillips, M. M., & Terlevich, R. 1981, PASP, 93, 5
- Berger & Fox (2009) Berger, E., & Fox, D. B. 2009, GRB Coordinates Network, 9156
- Brinchmann et al. (2004) Brinchmann, J., Charlot, S., White, S. D. M., Tremonti, C., Kauffmann, G., Heckman, T., & Brinkmann, J. 2004, MNRAS, 351, 1151
- Bromberg et al. (2011) Bromberg, O., Nakar, E., & Piran, T. 2011, ApJ, 739, L55
- Bromberg et al. (2013) Bromberg, O., Nakar, E., Piran, T., & Sari, R. 2013, ApJ, 764, 179
- Bruzual & Charlot (2003) Bruzual, G., & Charlot, S. 2003, MNRAS, 344, 1000
- Butler et al. (2007) Butler, N. R., Kocevski, D., Bloom, J. S., & Curtis, J. L. 2007, ApJ, 671, 656
- Calzetti et al. (2000) Calzetti, D., Armus, L., Bohlin, R. C., Kinney, A. L., Koornneef, J., & Storchi-Bergmann, T. 2000, ApJ, 533, 682
- Campisi et al. (2011) Campisi, M. A., Tapparello, C., Salvaterra, R., Mannucci, F., & Colpi, M. 2011, MNRAS, 417, 1013
- Cano et al. (2016) Cano, Z., Wang, S.-H., Dai, Z.-G., & Wu, X.-F. 2016, arXiv:1604.03549
- Cardelli et al. (1989) Cardelli, J. A., Clayton, G. C., & Mathis, J. S. 1989, ApJ, 345, 245
- Castro Cerón et al. (2010) Castro Cerón, J. M., Michałowski, M. J., Hjorth, J., Malesani, D., Gorosabel, J., Watson, D., Fynbo, J. P. U., & Morales Calderón, M. 2010, ApJ, 721, 1919
- Cenko et al. (2009) Cenko, S. B., et al. 2009, ApJ, 693, 1484
- Chabrier (2003) Chabrier, G. 2003, PASP, 115, 763
- Christensen et al. (2008) Christensen, L., Vreeswijk, P. M., Sollerman, J., Thöne, C. C., Le Floc’h, E., & Wiersema, K. 2008, A&A, 490, 45
- Della Valle et al. (2006) Della Valle, M., et al. 2006, Nature, 444, 1050
- Ellison et al. (2008) Ellison, S. L., Patton, D. R., Simard, L., & McConnachie, A. W. 2008, ApJ, 672, L107
- Fugazza et al. (2006) Fugazza, D., et al. 2006, GRB Coordinates Network, 5276
- Fynbo et al. (2012) Fynbo, J. P. U., de Ugarte Postigo, A., D’Elia, V., Xu, D., & Malesani, D. 2012, GRB Coordinates Network, 13477
- Fynbo et al. (2006) Fynbo, J. P. U., et al. 2006, Nature, 444, 1047
- Fynbo et al. (2009) —. 2009, ApJS, 185, 526
- Gal-Yam et al. (2006) Gal-Yam, A., et al. 2006, Nature, 444, 1053
- Garnavich et al. (2003) Garnavich, P. M., et al. 2003, ApJ, 582, 924
- Garnett (1992) Garnett, D. R. 1992, AJ, 103, 1330
- Gehrels et al. (2006) Gehrels, N., et al. 2006, Nature, 444, 1044
- Graham & Fruchter (2013) Graham, J. F., & Fruchter, A. S. 2013, ApJ, 774, 119
- Graham & Fruchter (2015) —. 2015, ArXiv e-prints
- Greiner et al. (2003) Greiner, J., Peimbert, M., Esteban, C., Kaufer, A., Jaunsen, A., Smoke, J., Klose, S., & Reimer, O. 2003, GRB Coordinates Network, 2020
- Greiner et al. (2011) Greiner, J., et al. 2011, A&A, 526, A30
- Halpern & Mirabal (2006) Halpern, J. P., & Mirabal, N. 2006, GRB Coordinates Network, 5982
- Hirschi et al. (2005) Hirschi, R., Meynet, G., & Maeder, A. 2005, A&A, 443, 581
- Hjorth et al. (2012) Hjorth, J., et al. 2012, ApJ, 756, 187
- Holland et al. (2010) Holland, S. T., et al. 2010, ApJ, 717, 223
- Hook et al. (2004) Hook, I. M., Jørgensen, I., Allington-Smith, J. R., Davies, R. L., Metcalfe, N., Murowinski, R. G., & Crampton, D. 2004, PASP, 116, 425
- Infante et al. (2001) Infante, L., Garnavich, P. M., Stanek, K. Z., & Wyrzykowski, L. 2001, GRB Coordinates Network, 1152
- Jakobsson et al. (2004) Jakobsson, P., Hjorth, J., Fynbo, J. P. U., Watson, D., Pedersen, K., Björnsson, G., & Gorosabel, J. 2004, ApJ, 617, L21
- Jakobsson et al. (2005) Jakobsson, P., et al. 2005, ApJ, 629, 45
- Japelj et al. (2016) Japelj, J., et al. 2016, ArXiv e-prints
- Kashikawa et al. (2002) Kashikawa, N., et al. 2002, PASJ, 54, 819
- Kauffmann et al. (2003a) Kauffmann, G., et al. 2003a, MNRAS, 341, 33
- Kauffmann et al. (2003b) —. 2003b, MNRAS, 346, 1055
- Kennicutt (1998) Kennicutt, Jr., R. C. 1998, ApJ, 498, 541
- Kewley et al. (2013) Kewley, L. J., Dopita, M. A., Leitherer, C., Davé, R., Yuan, T., Allen, M., Groves, B., & Sutherland, R. 2013, ApJ, 774, 100
- Kewley & Ellison (2008) Kewley, L. J., & Ellison, S. L. 2008, ApJ, 681, 1183
- Kobulnicky & Kewley (2004) Kobulnicky, H. A., & Kewley, L. J. 2004, ApJ, 617, 240
- Kocevski et al. (2009) Kocevski, D., West, A. A., & Modjaz, M. 2009, ApJ, 702, 377
- Krühler et al. (2015) Krühler, T., et al. 2015, A&A, 581, A125
- Küpcü Yoldaş et al. (2007) Küpcü Yoldaş, A., Salvato, M., Greiner, J., Pierini, D., Pian, E., & Rau, A. 2007, A&A, 463, 893
- Landolt (1992) Landolt, A. U. 1992, AJ, 104, 340
- Lara-López et al. (2010) Lara-López, M. A., et al. 2010, A&A, 521, L53
- Levan et al. (2013) Levan, A. J., Cenko, S. B., Perley, D. A., & Tanvir, N. R. 2013, GRB Coordinates Network, 14455
- Levan et al. (2014a) Levan, A. J., et al. 2014a, ApJ, 781, 13
- Levan et al. (2014b) —. 2014b, ApJ, 792, 115
- Levesque et al. (2010a) Levesque, E. M., Berger, E., Kewley, L. J., & Bagley, M. M. 2010a, AJ, 139, 694
- Levesque et al. (2011) Levesque, E. M., Berger, E., Soderberg, A. M., & Chornock, R. 2011, ApJ, 739, 23
- Levesque et al. (2010b) Levesque, E. M., Kewley, L. J., Berger, E., & Jabran Zahid, H. 2010b, AJ, 140, 1557
- Levesque et al. (2010c) Levesque, E. M., Kewley, L. J., Graham, J. F., & Fruchter, A. S. 2010c, ApJ, 712, L26
- Levesque et al. (2010d) Levesque, E. M., Soderberg, A. M., Kewley, L. J., & Berger, E. 2010d, ApJ, 725, 1337
- Maier et al. (2015) Maier, C., Ziegler, B. L., Lilly, S. J., Contini, T., Pérez-Montero, E., Lamareille, F., Bolzonella, M., & Le Floc’h, E. 2015, A&A, 577, A14
- Mangano et al. (2007) Mangano, V., et al. 2007, A&A, 470, 105
- Mannucci et al. (2010) Mannucci, F., Cresci, G., Maiolino, R., Marconi, A., & Gnerucci, A. 2010, MNRAS, 408, 2115
- Mannucci et al. (2011) Mannucci, F., Salvaterra, R., & Campisi, M. A. 2011, MNRAS, 439
- Modjaz et al. (2008) Modjaz, M., et al. 2008, AJ, 135, 1136
- Morganti et al. (2006) Morganti, R., et al. 2006, MNRAS, 371, 157
- Nakar (2015) Nakar, E. 2015, ApJ, 807, 172
- Niino (2011) Niino, Y. 2011, MNRAS, 417, 567
- Niino (2012) —. 2012, ApJ, 761, 126
- Niino et al. (2011) Niino, Y., Choi, J., Kobayashi, M. A. R., Nagamine, K., Totani, T., & Zhang, B. 2011, ApJ, 726, 88
- Niino et al. (2015) Niino, Y., Nagamine, K., & Zhang, B. 2015, MNRAS, 449, 2706
- Ofek et al. (2006) Ofek, E. O., Cenko, S. B., Gal-Yam, A., Peterson, B., Schmidt, B. P., Fox, D. B., & Price, P. A. 2006, GRB Coordinates Network, 5123
- Pagel et al. (1978) Pagel, B. E. J., Edmunds, M. G., Fosbury, R. A. E., & Webster, B. L. 1978, MNRAS, 184, 569
- Perley et al. (2013) Perley, D. A., et al. 2013, ApJ, 778, 128
- Perley et al. (2014) —. 2014, ApJ, 781, 37
- Perley et al. (2016a) —. 2016a, ApJ, 817, 7
- Perley et al. (2016b) —. 2016b, ApJ, 817, 8
- Perley et al. (2016c) —. 2016c, arXiv:1609.04016
- Price et al. (2006) Price, P. A., Berger, E., & Fox, D. B. 2006, GRB Coordinates Network, 5275
- Prochaska et al. (2003) Prochaska, J. X., Bloom, J. S., Chen, H. W., Hurley, K., Dressler, A., & Osip, D. 2003, GRB Coordinates Network, 2482
- Prochaska et al. (2004) Prochaska, J. X., et al. 2004, ApJ, 611, 200
- Rosa (1985) Rosa, M. 1985, The Messenger, 39, 15
- Rossi et al. (2014) Rossi, A., et al. 2014, A&A, 572, A47
- Sakamoto et al. (2009) Sakamoto, T., et al. 2009, ApJ, 693, 922
- Salim et al. (2007) Salim, S., et al. 2007, ApJS, 173, 267
- Salvaterra et al. (2012) Salvaterra, R., et al. 2012, ApJ, 749, 68
- Sánchez et al. (2012) Sánchez, S. F., et al. 2012, A&A, 538, A8
- Sanders et al. (2012) Sanders, N. E., Caldwell, N., McDowell, J., & Harding, P. 2012, ApJ, 758, 133
- Savaglio et al. (2009) Savaglio, S., Glazebrook, K., & Le Borgne, D. 2009, ApJ, 691, 182
- Sawicki (2012) Sawicki, M. 2012, PASP, 124, 1208
- Schlafly & Finkbeiner (2011) Schlafly, E. F., & Finkbeiner, D. P. 2011, ApJ, 737, 103
- Schlesinger et al. (2012) Schlesinger, K. J., et al. 2012, ApJ, 761, 160
- Schmidt (2001) Schmidt, M. 2001, ApJ, 552, 36
- Schulze et al. (2012) Schulze, S., et al. 2012, GRB Coordinates Network, 13257
- Schulze et al. (2014) —. 2014, A&A, 566, A102
- Schulze et al. (2015) —. 2015, ApJ, 808, 73
- Shields & Searle (1978) Shields, G. A., & Searle, L. 1978, ApJ, 222, 821
- Sollerman et al. (2005) Sollerman, J., Östlin, G., Fynbo, J. P. U., Hjorth, J., Fruchter, A., & Pedersen, K. 2005, New Astronomy, 11, 103
- Stanek et al. (2006) Stanek, K. Z., et al. 2006, Acta Astronomica, 56, 333
- Stanway et al. (2015) Stanway, E. R., Levan, A. J., Tanvir, N., Wiersema, K., van der Horst, A., Mundell, C. G., & Guidorzi, C. 2015, MNRAS, 446, 3911
- Storey & Zeippen (2000) Storey, P. J., & Zeippen, C. J. 2000, MNRAS, 312, 813
- Tanvir et al. (2012) Tanvir, N. R., Levan, A. J., Cucchiara, A., & Fox, D. B. 2012, GRB Coordinates Network, 13251
- Thöne & de Ugarte Postigo (2014) Thöne, C. C., & de Ugarte Postigo, A. 2014, GRB Coordinates Network, 16079
- Thöne et al. (2008) Thöne, C. C., et al. 2008, ApJ, 676, 1151
- Tinney et al. (1998) Tinney, C., et al. 1998, IAU Circ., 6896
- Tremonti et al. (2004) Tremonti, C. A., et al. 2004, ApJ, 613, 898
- Troja et al. (2006) Troja, E., Cusumano, G., Laparola, V., Mangano, V., & Mineo, T. 2006, Nuovo Cimento B Serie, 121, 1599
- Vergani et al. (2015) Vergani, S. D., et al. 2015, A&A, 581, A102
- Wanderman & Piran (2010) Wanderman, D., & Piran, T. 2010, MNRAS, 406, 1944
- Wolf & Podsiadlowski (2007) Wolf, C., & Podsiadlowski, P. 2007, MNRAS, 375, 1049
- Woosley & Heger (2006) Woosley, S. E., & Heger, A. 2006, ApJ, 637, 914
- Xu et al. (2013a) Xu, D., de Ugarte Postigo, A., Schulze, S., Jessen-Hansen, J., Leloudas, G., Kruehler, T., Fynbo, J. P. U., & Jakobsson, P. 2013a, GRB Coordinates Network, 14478
- Xu et al. (2013b) Xu, D., et al. 2013b, ApJ, 776, 98
- Yates et al. (2012) Yates, R. M., Kauffmann, G., & Guo, Q. 2012, MNRAS, 422, 215
- Yoon & Langer (2005) Yoon, S., & Langer, N. 2005, A&A, 443, 643
- Zhang et al. (2007) Zhang, B., Zhang, B.-B., Liang, E.-W., Gehrels, N., Burrows, D. N., & Mészáros, P. 2007, ApJ, 655, L25
- Zhang et al. (2009) Zhang, B., et al. 2009, ApJ, 703, 1696
- Zhang et al. (2012) Zhang, B.-B., et al. 2012, ApJ, 756, 190
- Zheng et al. (2009) Zheng, W., Deng, J., & Wang, J. 2009, Research in Astronomy and Astrophysics, 9, 1103