First principles study and empirical parametrization of twisted bilayer based on band-unfolding
Abstract
We explore the band structure and ballistic electron transport in twisted bilayer using Density Functional Theory (DFT). The sphagetti like bands are unfolded to generate band structures in the primitive unit cell of the original un-twisted bilayer and projected onto an individual layer. The corresponding twist angle dependent indirect bandedges are extracted from the unfolded band structures. Based on a comparison within the same primitive unit cell, an efficient two band effective mass model for indirect conduction and valence valleys is created and parameterized by fitting the unfolded band structures. With the two band effective mass model, transport properties - specifically, we calculate the ballistic transmission in arbitrarily twisted bilayer .
I Introduction
Two dimensional (2D) materials such as graphene and transition metal dichalcogenides (TMDs)
constitute exciting candidates for a variety of electronic and optoelectronic device applications Radisavljevic et al. (2011); Das et al. (2013).
In particular, there is growing interest
in stacked 2D materials that often occur naturally during the growth process, and
also provide opportunities for added functionalities due to their varying thickness, crystal orientation and composition.
It is critical to understand the electronic properties of stacked 2D materials such as twisted multilayer TMDs and TMD heterostructures. However, the complexity arises because their electronic properties
are highly sensitive to morphology and inter-layer interactions Fang et al. (2014); van der Zande et al. (2014); Wang et al. (2015); Yeh et al. (2016).
The translational symmetry of a twisted multilayer TMD
is compromised because of its twist angle, requiring a
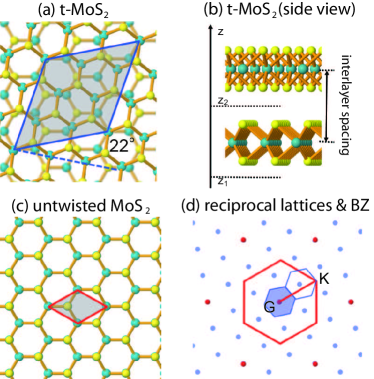
supercell that is considerably larger than the primitive unit cell (e.g. Fig.1 (a)), and a corresponding convoluted spaghetti-like band structure due to the aggressive folding of its Brillouin zone (BZ) Boykin and Klimeck (2005).
In principle, atomistic first principles as well as empirical methodsIlatikhameneh et al. (2015); Tan et al. (2015) can be used to model such twisted bilayer systems. However, as large unit cells of twisted systems increase the computational load dramatically, atomistic simulations are limited to specific twist angles with tractable BZ sizes instead of random orientations. A simpler model that nonetheless captures the essential physics of the bandedge and effective mass dependencies on orientation would be highly desirable.
In this work, the band structures of twisted bilayer ’s () are obtained using first principles calculations. In order to extract meaningful parameters such as bandedge splittings relevant to inter-layer interactions, the technique of band unfolding Boykin and Klimeck (2005); Boykin et al. (2007a, b); Popescu and Zunger (2012); Medeiros et al. (2014) is applied to the twisted bilayer TMDs. Interlayer interactions are extracted from the unfolded band structures, and then phenomenological multi-valley effective mass models are constructed to model the indirect valence bands at the point and the indirect conduction bands along directions.
II Method
In this work, calculations based on Density
Functional Theory (DFT) are performed using the Projector-Augmented Wave
(PAW) technique implemented in the Vienna Ab-initio
Simulation Package (VASP)Kresse and Furthmuller (1996). The
PBE functionalPerdew et al. (1996) is used to model the electron exchange-correlation.
The stacked TMD monolayers are weakly coupled through a Van der Waals force that is modeled using
the VdW functional optB88 functional Klimeš
et al. (2011); Dion et al. (2004). The opt88 functional has been proved to be reliable for binding energies and geometries of Van der Waals structures such as graphite and h-BN contacted with metals Hazrati et al. (2014); Bokdam et al. (2014). In all our calculations, a cut off energy of 400 eV is used. A -centered Monkhorst Pack kspace grid is used to describe the large supercells. For a structure with a smaller unitcell
(with twist angles of and ), a denser k-space grid is used.
To extract information from the massive number of bands of a system, we employ the technique of band unfoldingPopescu and Zunger (2012); Boykin and Klimeck (2005). This technique allows us to unfold the bands in the Brillouin zone of the large supercell back into the Brillouin zone of the primitive unit cell of untwisted MoS2.
Fig. 1 shows the unit cell of a twisted and un-twisted bilayer and their corresponding Brillouin zones. The reciprocal vectors of the supercell and the primitive unit cell are denoted by and respectively, with the ’s forming a subset of .
For a twisted bilayer system, the primitive unit cell of either the upper or the lower layer can be used to unfold the band structures. In the band unfolding process, eigen states of the system in the supercell are decomposed into linear combination of Fourier components of the primitive unit cell
| (1) |
Here the and correspond respectively to wave vectors in the Brillouin zones of the supercell and the primitive unit cell.
Each can be unfolded to a few satisfying . Taking the systems and their corresponding Brillouin zones shown in Fig.1 as an example, the
unfolded correspond to the blue dots enclosed by the Brillouin zone of the supercell. The resulting unfolded structures can now be readily compared to the original un-twisted system as both band structures lie in the Brillouin zone of the same primitive unit cell.
For a bilayer system, the unfolded band structure contains bands contributed by both layers.
To further separate the bands of one monolayer from another, the monolayer projector can be used.
| (2) |
where the is the monolayer projector defined as
| (3) |
where and define the region of one of its layers. For instance, the and in Fig. 1 (b) define the region of the lower layer in the . Half of the interlayer spacing is included in this definition.
III Results
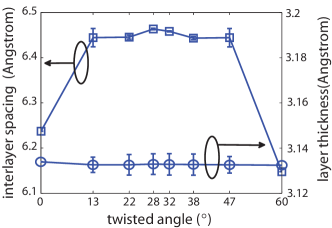
In this work, we consider with special twist angles (, , , , , , and ). Of all these cases, the with the twist angles of and have the largest unit cell with 114 atoms (compared with just 6 atoms in a un-twisted bilayer system). For all the twisted structures, the lattice constant is chosen as according to previous work by ref. Ramasubramaniam, 2012. Fig.2 shows all the inter-layer distances and monolayer thicknesses plotted against the twist angle of . We see that the average thickness of each layer in is weakly dependent on the twist angle. A weak inhomogenous strain is introduced in response to the broken translation symmetry in . The variances of the layer thickness in all the considered systems are less than 0.01, corresponding to a maximum diagonal strain component of . In contrast the inter-layer spacings, defined as the distance between the Mo-planes as it is shown in Fig.1 (b), change more substantially with respect to the twist angle. Compared with un-twisted , the inter-layer spacing increases by 0.2 between twist angles from to .
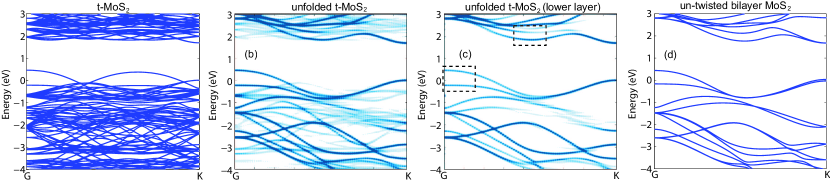
In order to understand the impact of the twist angle and the resulting variation in inter-layer distance on the band structures, we look closer at the band structures of two kinds of structures: 1. with a fixed inter-layer distance (no geometry relaxation is applied in this case); and 2. after geometry relaxation. For un-relaxed structures in case 1, the inter-layer distance of all the s is set equal to that of a relaxed, un-twisted . For these ’s with a fixed inter-layer distance, the DFT band structures of with structures in Fig.1 are shown in Fig. 3. Compared with the band structure of the un-twisted bilayer in 3.(d), the band structure of a in Fig. 3 (a) has little resemblance due to Brillouin zone folding. With band unfolding however, the interfering bands are filtered out. The unfolded band structure in Fig. 3 (b) is comparable with the band structure of un-twisted bilayer in Fig.3.(c). The probability amplitude of each Fourier component given by in equation (1) is represented by the color intensity in 3.(b). In Fig. 3.(c), the bands in Fig. 3.(b) are further projected to the lower layer by applying the monolayer projector given by equation (3). The probability amplitudes are shown in Fig.3.(c). Compared with the band structure in 3.(d), we clearly see how broken bands and broadened bands appear in Fig. 3.(b) due to the inter-layer interactions in the twisted bilayer system.
For other systems, the unfolding process is applied analogously, and figures similar to Fig. 3.(c) are obtained in each case. The bandedges and band splittings of important valleys are also quantitatively evaluated from the unfolded bands of relaxed and un-relaxed , as marked by rectangles in Fig.3.(c). For the relaxed systems, the small thickness variations within the supercell of the twisted bilayer systems are seen to induce only a negligible variation to the band gaps and effective masses. Such a weak variation is expected because the average strain of each layer is negligible in the . For the direct conduction and valence bands at the point, the changes in bandedges due to twist angle are also negligible. However, the indirect conduction and valence valleys are seen to have a stronger dependence on interlayer interactions. The uppermost valence bands (VB) of relaxed ’s are about 0.12eV lower than that of un-relaxed ’s for twist angles running between to , while for a twist angle, it rises above the un-relaxed value. The variation of VB at the point reaches about 0.1eV, which quanlitatively agrees with measurements by Ref Yeh et al., 2016. These deviations suggest that both the twist angle and the change in thickness have considerable impact on the bandedge of the indirect valence band at the point. The indirect conduction bands (CBs) in relaxed are slightly higher than that of the un-relaxed . The maximum discrepancy is about 0.04 eV for a twist angle of about , suggesting that the twist angle also influences the bandedges of indirect CBs. For both relaxed and un-relaxed structures, the indirect conduction valleys reach the highest energy (0.15eV above lowest conduction band) at a twist angle of . For all these cases, the original un-twisted bilayer has the lowest indirect conduction valleys.
| Valley | |||||
|---|---|---|---|---|---|
| CB(relaxed) | 0.131 | 0.067 | 0.041 | 0.172 | 0.215 |
| CB(un-relaxed) | 0.139 | 0.060 | 0.033 | 0.299 | 0.485 |
| VB(relaxed) | 0.199 | 0.082 | 0.140 | 0.122 | 0.113 |
| VB(un-relaxed) | 0.321 | -0.040 | -0.039 | 0.153 | 0.094 |
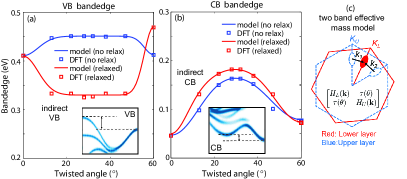
Using the bandedges extracted from the unfolded band structure, we can develop effective mass models to describe the angle dependent indirect CBs and VBs. For a twisted bilayer system with a twist angle , we introduce a two band effective mass model to couple the indirect valleys of different layers. The two band effective mass model has a general expression given by
| (4) |
where and correspond to the valleys of upper and lower layers in a system. The twist angle dependent is parameterized with an analytical expression
| (5) |
where and are fitting parameters. This expression of is valid for , with the relations and beyond that limit. For valence valleys at the point, we have . For indirect CBs, the twist angle corresponds to a change in the bottom of the conduction valleys in the Brillouin zone, as shown in Fig. 4 (c). For uncoupled CBs along the k-direction with an angle , the un-coupled CB valley is given by a generalized effective mass model
| (6) | |||||
Consider one of the valleys from the lower layer, whose Hamiltonian .
Two of the valleys from the upper layer can interact with this .
Based on our simulations we model the upper valleys by
and .
The parameters of indirect valence and conduction valleys are listed in table. 1.
From Fig.4, it can be seen that the two band effective mass models introduced in this work reproduce the DFT bandedges accurately.
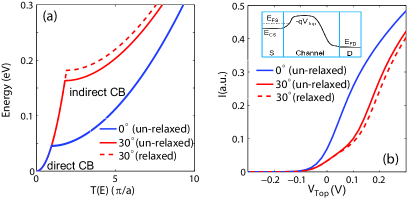
Figure 5.(a) shows the integrated electron transmission across with different twist angles. We see that the indirect conduction bands have higher energy than the direct conduction bands, as shown in Fig.4 (b). However the indirect conduction bands contribute a larger integrated transmission because they have larger effective masses and because there are six valleys. In Fig.5 (b), the ballistic currents in n-type twisted and untwisted bilayer are calculated using a top of barrier modelTopofBarrier. We see a reduction in ON current of up to 50% for the twisted bilayer channel, suggesting that the indirect conduction bands bear significant contribution to the device performance.
IV Conclusion
In summary, a Brillouin zone unfolding technique is employed to explore the electronic band structures and ballistic current flow in twisted bilayer MoS2. A simple, twist angle-dependent two band effective mass model is developed to model the bandedges of the indirect valleys. Such an angle-dependent parametrization can in principle allow a configurational average over the twist angle distribution to properly quantify the role of configurational disorder in 2D layered materials.
Acknowledgements.
This project was supported by the Nano Research Initiative (NRI) through the Institute for Nanoelectronics Discovery and Exploration (INDEX) center.References
- Radisavljevic et al. (2011) B. Radisavljevic, A. Radenovic, J. Brivio, V. Giacometti, and A. Kis, Nature Nanotechnology 6, 147 (2011).
- Das et al. (2013) S. Das, H.-Y. Chen, A. V. Penumatcha, and J. Appenzeller, Nano Letters 13, 100 (2013), pMID: 23240655, eprint http://dx.doi.org/10.1021/nl303583v, URL http://dx.doi.org/10.1021/nl303583v.
- Fang et al. (2014) H. Fang, C. Battaglia, C. Carraro, S. Nemsak, B. Ozdol, J. S. Kang, H. A. Bechtel, S. B. Desai, F. Kronast, A. A. Unal, et al., Proceedings of the National Academy of Sciences 111, 6198 (2014), eprint http://www.pnas.org/content/111/17/6198.full.pdf, URL http://www.pnas.org/content/111/17/6198.abstract.
- van der Zande et al. (2014) A. M. van der Zande, J. Kunstmann, A. Chernikov, D. A. Chenet, Y. You, X. Zhang, P. Y. Huang, T. C. Berkelbach, L. Wang, F. Zhang, et al., Nano Letters 14, 3869 (2014), pMID: 24933687, URL http://dx.doi.org/10.1021/nl501077m.
- Wang et al. (2015) Z. Wang, Q. Chen, and J. Wang, The Journal of Physical Chemistry C 119, 4752 (2015), URL http://dx.doi.org/10.1021/jp507751p.
- Yeh et al. (2016) P.-C. Yeh, W. Jin, N. Zaki, J. Kunstmann, D. Chenet, G. Arefe, J. T. Sadowski, J. I. Dadap, P. Sutter, J. Hone, et al., Nano Letters 16, 953 (2016), pMID: 26760447, URL http://dx.doi.org/10.1021/acs.nanolett.5b03883.
- Boykin and Klimeck (2005) T. B. Boykin and G. Klimeck, Phys. Rev. B 71, 115215 (2005), URL http://link.aps.org/doi/10.1103/PhysRevB.71.115215.
- Ilatikhameneh et al. (2015) H. Ilatikhameneh, Y. Tan, B. Novakovic, G. Klimeck, R. Rahman, and J. Appenzeller, IEEE Journal on Exploratory Solid-State Computational Devices and Circuits 1, 12 (2015), ISSN 2329-9231.
- Tan et al. (2015) Y. P. Tan, M. Povolotskyi, T. Kubis, T. B. Boykin, and G. Klimeck, Phys. Rev. B 92, 085301 (2015), URL http://link.aps.org/doi/10.1103/PhysRevB.92.085301.
- Boykin et al. (2007a) T. B. Boykin, N. Kharche, and G. Klimeck, Phys. Rev. B 76, 035310 (2007a), URL http://link.aps.org/doi/10.1103/PhysRevB.76.035310.
- Boykin et al. (2007b) T. B. Boykin, N. Kharche, G. Klimeck, and M. Korkusinski, Journal of Physics: Condensed Matter 19, 036203 (2007b), URL http://stacks.iop.org/0953-8984/19/i=3/a=036203.
- Popescu and Zunger (2012) V. Popescu and A. Zunger, Phys. Rev. B 85, 085201 (2012), URL http://link.aps.org/doi/10.1103/PhysRevB.85.085201.
- Medeiros et al. (2014) P. V. C. Medeiros, S. Stafström, and J. Björk, Phys. Rev. B 89, 041407 (2014), URL http://link.aps.org/doi/10.1103/PhysRevB.89.041407.
- Kresse and Furthmuller (1996) G. Kresse and J. Furthmuller, Computational Materials Science 6, 15 (1996), ISSN 0927-0256.
- Perdew et al. (1996) J. P. Perdew, K. Burke, and M. Ernzerhof, Phys. Rev. Lett. 77, 3865 (1996).
- Klimeš et al. (2011) J. c. v. Klimeš, D. R. Bowler, and A. Michaelides, Phys. Rev. B 83, 195131 (2011), URL http://link.aps.org/doi/10.1103/PhysRevB.83.195131.
- Dion et al. (2004) M. Dion, H. Rydberg, E. Schröder, D. C. Langreth, and B. I. Lundqvist, Phys. Rev. Lett. 92, 246401 (2004), URL http://link.aps.org/doi/10.1103/PhysRevLett.92.246401.
- Hazrati et al. (2014) E. Hazrati, G. A. de Wijs, and G. Brocks, Phys. Rev. B 90, 155448 (2014), URL http://link.aps.org/doi/10.1103/PhysRevB.90.155448.
- Bokdam et al. (2014) M. Bokdam, G. Brocks, M. I. Katsnelson, and P. J. Kelly, Phys. Rev. B 90, 085415 (2014), URL http://link.aps.org/doi/10.1103/PhysRevB.90.085415.
- Ramasubramaniam (2012) A. Ramasubramaniam, Phys. Rev. B 86, 115409 (2012), URL http://link.aps.org/doi/10.1103/PhysRevB.86.115409.