Sub-femtonewton Force Spectroscopy at the Thermal Limit
in Liquids
Abstract
We demonstrate thermally-limited force spectroscopy using a probe formed by a dielectric microsphere optically trapped in water near a dielectric surface. We achieve force resolution below 1 fN in 100 s, corresponding to a 2 Å RMS displacement of the probe. Our measurement combines a calibrated evanescent wave particle tracking technique and a lock-in detection method. We demonstrate the accuracy of our method by measurement of the height-dependent force exerted on the probe by an evanescent wave, the results of which are in agreement with Mie theory calculations.
Introduction.
Force spectroscopy on the nanoscale is important in studies of fundamental physics Tkachenko and Brasselet (2014); Rugar et al. (2004); Munday et al. (2009); Bliokh et al. (2013), chemistry Hertlein et al. (2008); Bevan and Prieve (1999); Helden et al. (2015); Israelachvili and Wennerström (1996); Helden et al. (2003), and molecular biology Neuman and Nagy (2008); Florin et al. (1994); Kellermayer et al. (1997); Abbondanzieri et al. (2005); Sarkar et al. (2004); Alonso and Goldmann (2003) and in the design of micro- and nano- opto-mechanical systems Maragò et al. (2013); Woolf et al. (2009); Wiederhecker et al. (2009). In such systems, forces are typically measured via the position read-out of a mechanically compliant probe such as a mechanical cantilever or an optically trapped particle Mueller et al. (2008); Cappella and Dietler (1999); Grier (2003). The smallest measurable force is fundamentally limited by the presence of a fluctuating background force exerted on the probe by its thermal environment. For a probe coupled to a fluid at temperature , with a drag coefficient , the fluctuation-dissipation theorem predicts the (single sided) power spectral density (PSD) for fluctuations of the thermal force to be Gittes and Schmidt (1998); Kubo (1966),
| (1) |
where is the Boltzmann constant, and relates the dissipative drag force, , to the velocity of the probe according to . For a continuous force measurement with bandwidth at a frequency , thermal fluctuations add a stochastic contribution, with a standard deviation of
| (2) |
High sensitivity measurements require conditions which minimize . Damping can be reduced by operating in high vacuum and using high-Q (low internal damping) oscillators, while can be minimized by cooling the system to cryogenic levels Geraci et al. (2010); Giessibl (2003). Such measures, however, cannot be implemented for aqueous systems, in which the temperature is restricted to be near room temperature, and the viscosity of water results in damping orders of magnitude greater than in air. Force detection in an aqueous environment, however, is vital for measurement of biological systems, investigation of forces mediated by fluids Munday et al. (2009) or to eliminate capillary effects present during measurements in atmosphere Cappella and Dietler (1999).
Optically trapped microspheres have an advantage over AFM cantilevers for measurements in water due to their small size. A 1 m diameter sphere in water has a damping coefficient below kg/s, corresponding to a thermally-limited sensitivity of 10 fN/, much smaller than that of a typical AFM tip, especially when it is near a surface Gittes and Schmidt (1998). However, attaining thermally limited sensitivity in DC force measurements using trapped microspheres is technically difficult due to the presence of noise sources. Significant effort is necessary to eliminate such noise sources, including the trapping of multiple microspheres and enclosing the experiment in a box filled with helium Abbondanzieri et al. (2005).
Forces as small as 20 fN (with averaging times of at least 10 minutes) have been measured using a method known as photonic force microscopy (PFM) Helden et al. (2015); Florin et al. (1997); Rohrbach (2005), in which the force is determined from the statistics of the thermal motion of the particle. However, PFM involves a trade-off between position resolution and force sensitivity: the thermally-limited force sensitivity of PFM scales with , and approaches Eq. 2 for sup , where is the number of points along which the thermally sampled potential is differentiated.
In this work, we measure height-dependent forces exerted by an evanescent field on an optically trapped probe near a dielectric surface, in water. We achieve thermally limited force measurement, and avoid noise by using a lock-in detection method in which the external force is modulated during the measurement. The position of the particle is read out using a previously described calibrated total internal reflection microscopy (TIRM) Prieve et al. (1990) method, enabled by the addition of an anti-reflection (AR) coating to the surface which eliminates standing-wave modulation of the optical trap Liu et al. (2014). Probe height is scanned by displacing the trapping objective (the trap focus) relative to the chamber. Each force measurement corresponds to a spatial average over the trapping volume, giving a height resolution of about 10 nm.
Force measurement with a compliant probe.
The linear response of a compliant probe to an external force can be described by its mechanical susceptibility , which, for an optically trapped sphere in liquid, can be approximated as: Gittes and Schmidt (1998)
| (3) |
where is the mass of the probe, is the spring constant of the harmonic potential and is the drag coefficient. For a sphere of radius , in a fluid with viscosity , the drag is given by Stokes law, . The presence of a planar boundary near the sphere results in an increased, height-dependent drag coefficient and requires a modification to Stokes law sup . Knowledge of allows one to infer the force on such a probe from a measurement of its displacement, according to the relation . For time scales longer than the momentum relaxation time, Kheifets et al. (2014), the mass term in Eq. 3 is negligible, and the forces are dominated by viscous damping and the restoring force of the harmonic trap. This is the case in our experiment, where is below 1 s.
The magnitude of fluctuations of the thermal force, given by Eq. (1), is determined only by the dissipative component of the mechanical response, and is spectrally flat. A series of repeated time-averaged measurements of duration , of a constant force, with such background noise, will have a variance of sup . In practice, however, measurement noise at low frequencies is typically dominated by additional noise sources, the presence of which causes the variance of repeated measurements to diverge.
The effect of low frequency noise can be reduced by modulation of the driving force at a constant frequency , at which the noise is dominated by thermal noise. In order to extract the signal from the noise, a lock-in algorithm is used. The lock-in signal is generated by time-averaging of the product of the position measurement and a normalized reference signal , proportional to the external force. Repeated measurements using this method will have a variance of sup , allowing the measurement to be shifted to a spectral range where noise is negligible.
Optical force on a sphere in an evanescent field.
The optical force exerted by an evanescent field on matter has attracted significant attention in recent decadesKawata and Sugiura (1992); Sasaki et al. (2000); Nieto-Vesperinas et al. (2004), and though general qualitative agreement has been found between Mie theory and observations, due to instrumental limitations, precise quantitative tests have not been made as of yet.
The force on a dielectric sphere in such an optial environment consists of two terms: a gradient force and a scattering force. The gradient force pulls the particle towards the surface and is proportional to the gradient of the field, whereas both the direction and amplitude of the scattering force depend on the scattering properties of the sphere. In the Rayleigh approximation Okamoto and Kawata (1999), i.e., when the size of the particle is much smaller than the wavelength of light (), this scattering force is directed parallel to the surface. In the Mie regime (), on the other hand, the incident field can be scattered in every direction, so the scattering force contains components both parallel and perpendicular to the surface. In our experiments, . Therefore, we analytically evaluate the scattered fields of the dielectric sphere using Mie Theory and calculate the resulting optical force by means of an algebraic combination of the Mie scattering coefficients, following the formalism derived in Ref. Almaas and Brevik (1995). The details of these calculations are discussed in the Supplemental Materials sup .
Setup.

A simplified schematic of the experimental setup is shown in Fig. 1. The experiment is performed in a 25 m deep microfluidic chamber with one inlet and one outlet with AR coating on the lower surface. Microsphere suspensions are introduced into the chamber by a syringe pump.
The chamber is mounted on a 60∘ BK-7 glass prism with refractive-index matching fluid in the interface, providing optical access to the lower water-glass interface of the chamber for the detection and actuation beams at angles of incidence beyond the critical angle.
Trapping is achieved using a single-beam optical tweezer formed by a 10 mW, 660 nm laser (Newport LQC660-110C) focused inside the chamber, from above, by a water-immersion objective (Leica PL APO 63/1.20 W CORR) with numerical aperture (NA) of 1.2.
The evanescent detection field is formed by a low power ( mW) -polarized 637 nm wavelength beam from a fiber-pigtailed laser (Thorlabs LP637-SF70). This “probe” beam reflects at the glass-water interface below the trapping area at an at an angle above critical (). The spot-size of this detection beam was measured to be about mm2, corresponding to an intensity of 0.75 W/cm2 at the surface sup . Probe light scattered by the particle is collected by the objective and coupled into a 60 m diameter multi-mode fiber, which defines an aperture with an effective diameter of 4 m in the image plane. The fiber output is sent to a high-sensitivity photodetector (New Focus 2151) with a transimpedance gain of 2 V/A. This signal is used to track the particle’s separation from the surface.
Actuation of the microsphere is performed using a second, higher power, 100 mW, 785 nm “pump” laser (Thorlabs LD785-SH300) whose beam enters the other side of the prism. It is focused onto an area of about 0.014 mm2, resulting in typical intensities of several kW/cm2. The pump amplitude is modulated by a chopper upstream of the fiber coupler. A 2% beam splitter is used to deflect a part of the beam into a monitor photodiode, providing the reference signal for lock-in measurement.
A capacitive displacement sensor mounted between the objective mount and sample holder is used to implement an active, low frequency feedback loop to stabilize the lens-sample separation, which is controlled by a piezo-actuated translation stage. In the presence of feedback, fluctuations in focal position of the optical trap were reduced from that of order 100 nm in 10 min to below 5 nm in 60 min.
Data acquisition and analysis.
All data reported in this paper were acquired with optically trapped non-functionalized polystyrene (PS) microbeads suspended in de-ionized water. Typical trap lifetimes were observed to be several hours, limited by eventual diffusion of additional particles into the trapping volume. Stable trapping enabled multiple repeated acquisitions for the same microsphere. A typical data acquisition procedure for a given trapped bead consists of an initial calibration scan followed by lock-in force measurements for different values of trap position and pump beam intensity. Upon completion of the required force measurements, a 0.1M NaCl aqueous solution is introduced into the fluid chamber for a final calibration scan to reduce surface repulsion due to the electrostatic double-layer in water Flicker and Bike (1993); Clapp and Dickinson (2001).
The calibration procedure Liu et al. (2014) determines the parameters used to convert from the probe signal photodiode voltage to the absolute distance between the microsphere and coverslip surface. The trapping objective is lowered in 10 nm steps towards the bottom surface of the coverslip while the average photodiode voltage is recorded for each trap position. The result is fit to the relationship:
| (4) |
where is the photodiode voltage (proportional to intensity of scattered light) when the microsphere is in contact with the surface, and is the decay length of the intensity of the evanescent field produced by the detection beam Prieve and Walz (1993).
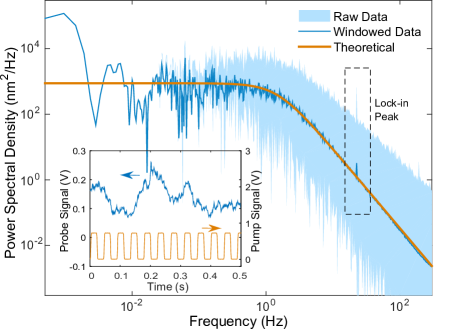
During force measurements, the particle tracking photodiode signal is recorded simultaneously with that of the pump beam monitor photodiode, which forms the reference signal for the lock-in measurement described above. The output of the lock-in algorithm is the phase and amplitude of the driven oscillation of the probe’s position. In order to convert to force, an additional calibration step must be performed to determine the in Eq. (3). The height-dependent susceptibility is found sup using , the PSD of the Brownian motion of the probe acquired at different heights, as exemplified by Figure 2. Additionally, the resulting is used to determine the diameter of each microsphere by fitting to a near-wall hindered diffusion model Brenner (1961), with diameter and point of contact as fitting parameters.
Results.
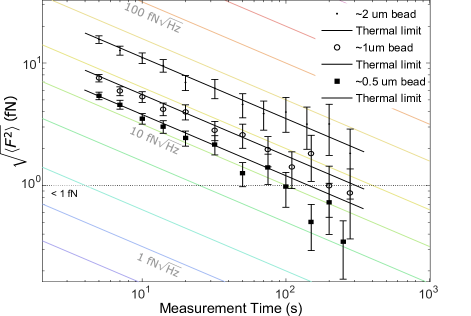
Figure 3 shows the RMS force fluctuations as a function of measurement time () for three microspheres with nominal diameters of 500 nm, 1 m, and 2 m, trapped 700 nm from the surface in the presence of a constant (oscillating), attractive optical force. The solid curves give the prediction of Eq. (2), and demonstrate that the fluctuations observed in our experimental data are primarily thermally limited. The thermal limit for a smaller particle is itself smaller due to the reduced value for , which is, to first order, proportional to the particle diameter. For measurement times near and above 100 s, the RMS error for the smallest particle drops below 1 fN.
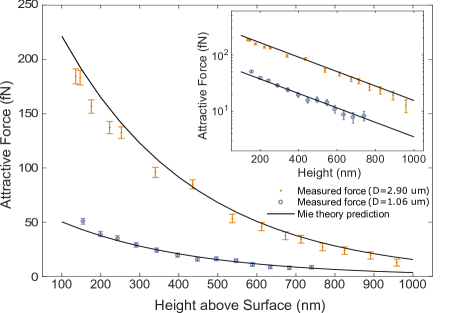
Figure 4 shows results of measured (attractive) optical force exerted by the near-field of the totally internally reflecting pump beam. Each data point was obtained from a 100 s long measurement at fixed bead-surface separation. The error bars show the thermal limit, confirmed to be equivalent to our force resolution. The measured force is shown alongside the results of Mie theory calculations (solid curves) based solely on measured parameters. These parameters are, specifically, the microsphere diameter, the pump laser angle of incidence and field intensity at the surface.
The microsphere diameters, determined by fitting to the hindered diffusion model, were 1.06 0.02 m and 2.90 0.06 m. The pump angle of incidence, , is determined by measurement of the decay length of the evanescent field via confocal detection of the scattered light (blocked by a bandpass filter during normal acquisition). It was determined to be 62.1∘ 0.1∘. The field intensity at the surface was estimated from measurement of the laser power incident on the prism, the beam profile at the lower surface of the chamber, and the reflection and propagation losses through the prism. The resulting peak intensities are (1.49 0.16) and (1.66 0.17) kW/cm2 for the larger and smaller beads, respectively. Uncertainty in the power meter measurement and beam waist determination are the main sources of error. Detailed calculations are in Supplemental Materials sup .
Data for the 1.06 m microsphere are a near exact match with theory and results for the 2.90 m microsphere are close to predicted as well, scaled by a factor of 0.85, which may be attributed to a small pump beam misalignment. Within uncertainties, our experiment confirms Mie theory predictions, and is, to our knowledge, the first such experiment to find precise quantitative agreement between predicted and measured optical forces from an evanescent field.
Discussion.
We have developed a novel technique for conducting thermal-limited force spectroscopy using optically trapped microspheres. We have used it to measure the height dependence of the attractive force of an evanescent wave on a dielectric microsphere, demonstrating quantitative agreement with Mie theory. We have demonstrated resolution of angstrom-scale probe displacements and the detection of sub-femtonewton optical forces in aqueous environments at room temperature, surpassing the sensitivity (in N/) of existing techniques by two orders of magnitude Meiners and Quake (2000).
The improvement makes accessible many optical phenomena of interest, including measurement of lateral spin momentum forces, chiral-sorting forces Bliokh et al. (2013); Hayat et al. (2015); Wang and Chan (2014) and attractive surface plasmon forces Volpe et al. (2006). Though our demonstrations were limited to optical forces at visible wavelengths, the technique is broadly applicable to near-IR wavelengths suitable for biological samples and to any force which can be externally modulated, that is, turned on and off. This modulation can be achieved, for example, by optical, mechanical, or electrical activation of biological or chemical systems. That the method is also minimally invasive, contact-free, and can be performed in fluid at room temperature is of particular interest to the biological community. It may enable exploration of the potentially important role played by femtonewton forces in DNA structure formation and cellular function and motility Chen et al. (2010); Herling et al. (2015); Evans et al. (1995).
Acknowledgements.
We acknowledge the support of NSF GFRP grant number DGE1144152 and the Research Foundation Flanders grant number 12O9115N. All fabrication was done in the Harvard Center for Nanoscale Sciences (CNS) clean room facility. We kindly thank the groups of Evelyn Hu and David Weitz at Harvard University for shared equipment and lab access, and Alexander Woolf for his contributions.References
- Tkachenko and Brasselet (2014) G. Tkachenko and E. Brasselet, Nature Communications 5, 3577 (2014), ISSN 2041-1723, URL http://www.ncbi.nlm.nih.gov/pubmed/24717633.
- Rugar et al. (2004) D. Rugar, R. Budakian, H. Mamin, and B. Chui, Nature 430, 329 (2004).
- Munday et al. (2009) J. N. Munday, F. Capasso, and V. A. Parsegian, Nature 457, 170 (2009), ISSN 0028-0836, URL http://www.nature.com/doifinder/10.1038/nature07610.
- Bliokh et al. (2013) K. Y. Bliokh, A. Y. Bekshaev, and F. Nori, Nature Communications 5, 14 (2013), ISSN 2041-1723, eprint 1308.0547, URL http://www.ncbi.nlm.nih.gov/pubmed/24598730$\$nhttp://arxiv.org/abs/1308.0547.
- Hertlein et al. (2008) C. Hertlein, L. Helden, A. Gambassi, S. Dietrich, and C. Bechinger, Nature 451, 172 (2008).
- Bevan and Prieve (1999) M. A. Bevan and D. C. Prieve, Langmuir 15, 7925 (1999).
- Helden et al. (2015) L. Helden, R. Eichhorn, and C. Bechinger, Soft Matter 11, 2379 (2015), ISSN 1744-683X, URL http://xlink.rsc.org/?DOI=C4SM02833C.
- Israelachvili and Wennerström (1996) J. Israelachvili and H. Wennerström, Nature 379, 219 (1996).
- Helden et al. (2003) L. Helden, R. Roth, G. H. Koenderink, P. Leiderer, and C. Bechinger, Physical Review Letters 90, 048301 (2003), ISSN 0031-9007.
- Neuman and Nagy (2008) K. K. C. Neuman and A. Nagy, Nature Methods 5, 491 (2008), URL http://www.ncbi.nlm.nih.gov/pmc/articles/PMC3397402/.
- Florin et al. (1994) E. Florin, V. Moy, and H. Gaub, Science 264, 415 (1994), eprint http://www.sciencemag.org/content/264/5157/415.full.pdf, URL http://www.sciencemag.org/content/264/5157/415.abstract.
- Kellermayer et al. (1997) M. S. Kellermayer, S. B. Smith, H. L. Granzier, and C. Bustamante, Science 276, 1112 (1997).
- Abbondanzieri et al. (2005) E. A. Abbondanzieri, W. J. Greenleaf, J. W. Shaevitz, R. Landick, and S. M. Block, Nature 438, 460 (2005), ISSN 1476-4687, URL http://www.pubmedcentral.nih.gov/articlerender.fcgi?artid=1356566{&}tool=pmcentrez{&}rendertype=abstract.
- Sarkar et al. (2004) A. Sarkar, R. B. Robertson, and J. M. Fernandez, Proceedings of the National Academy of Sciences 101, 12882 (2004).
- Alonso and Goldmann (2003) J. L. Alonso and W. H. Goldmann, Life Sciences 72, 2553 (2003), ISSN 00243205, URL http://linkinghub.elsevier.com/retrieve/pii/S0024320503001656.
- Maragò et al. (2013) O. M. Maragò, P. H. Jones, P. G. Gucciardi, G. Volpe, and A. C. Ferrari, Nature Nanotechnology 8, 807 (2013).
- Woolf et al. (2009) D. Woolf, M. Loncar, and F. Capasso, Optics Express 17, 19996 (2009), ISSN 1094-4087.
- Wiederhecker et al. (2009) G. S. Wiederhecker, L. Chen, A. Gondarenko, and M. Lipson, Nature 462, 633 (2009), ISSN 0028-0836, URL http://www.nature.com/doifinder/10.1038/nature08584.
- Mueller et al. (2008) F. Mueller, S. Heugel, and L. Wang, Optics Letters 33, 539 (2008).
- Cappella and Dietler (1999) B. Cappella and G. Dietler, Surface Science Reports 34, 1 (1999), ISSN 01675729.
- Grier (2003) D. G. Grier, Nature 424, 810 (2003), ISSN 1476-4687, URL http://www.ncbi.nlm.nih.gov/pubmed/12917694.
- Gittes and Schmidt (1998) F. Gittes and C. F. Schmidt, European Biophysics Journal 27, 75 (1998), ISSN 01757571.
- Kubo (1966) R. Kubo, Reports on Progress in Physics 29, 255 (1966), ISSN 00344885, URL http://stacks.iop.org/0034-4885/29/i=1/a=306?key=crossref.d8453ffc416cd2064d6ccd38e7c06a41.
- Geraci et al. (2010) A. Geraci, S. Papp, and J. Kitching, Physical Review Letters 105, 101101 (2010), ISSN 0031-9007, URL http://link.aps.org/doi/10.1103/PhysRevLett.105.101101.
- Giessibl (2003) F. J. Giessibl, Reviews of Modern Physics 75, 949 (2003), ISSN 0034-6861, URL http://link.aps.org/doi/10.1103/RevModPhys.75.949.
- Florin et al. (1997) E.-L. Florin, A. Pralle, J. H. Hörber, and E. H. Stelzer, Journal of Structural Biology 119, 202 (1997).
- Rohrbach (2005) A. Rohrbach, Optics Express 13, 9695 (2005), ISSN 1094-4087.
- (28) See Supplemental Material at http://link.aps.org/supplemental/xx/PhysRevLett.xx for a detailed discussion of the experimental setup, the measurement algorithm, the Mie theory algorithm, and the data analysis.
- Prieve et al. (1990) D. C. Prieve, S. G. Bike, and N. A. Frej, Faraday Discussions of the Chemical Society 90, 209 (1990).
- Liu et al. (2014) L. Liu, A. Woolf, A. W. Rodriguez, and F. Capasso, Proceedings of the National Academy of Sciences 111, E5609 (2014), ISSN 0027-8424, URL http://www.pnas.org/lookup/doi/10.1073/pnas.1422178112.
- Kheifets et al. (2014) S. Kheifets, A. Simha, K. Melin, T. Li, and M. G. Raizen, science 343, 1493 (2014).
- Kawata and Sugiura (1992) S. Kawata and T. Sugiura, Optics Letters 17, 772 (1992).
- Sasaki et al. (2000) K. Sasaki, J. Hotta, K. Wada, and H. Masuhara, Optics Letters 25, 1385 (2000), ISSN 0146-9592.
- Nieto-Vesperinas et al. (2004) M. Nieto-Vesperinas, P. Chaumet, and A. Rahmani, Philosophical Transactions of the Royal Society A 362, 719 (2004).
- Okamoto and Kawata (1999) K. Okamoto and S. Kawata, Physical Review Letters 83, 4534 (1999).
- Almaas and Brevik (1995) E. Almaas and I. Brevik, Journal of the Optical Society of America B 12, 2429 (1995).
- Flicker and Bike (1993) S. G. Flicker and S. G. Bike, Langmuir 9, 257 (1993).
- Clapp and Dickinson (2001) A. R. Clapp and R. B. Dickinson, Langmuir 17, 2182 (2001).
- Prieve and Walz (1993) D. C. Prieve and J. Y. Walz, Applied Optics 32, 1629 (1993).
- Brenner (1961) H. Brenner, Chemical Engineering Science 16, 242 (1961).
- Meiners and Quake (2000) J.-C. Meiners and S. R. Quake, Physical Review Letters 84, 5014 (2000).
- Hayat et al. (2015) A. Hayat, J. P. B. Mueller, and F. Capasso, Proceedings of the National Academy of Sciences 2015, 201516704 (2015), ISSN 0027-8424, URL http://www.pnas.org/lookup/doi/10.1073/pnas.1516704112.
- Wang and Chan (2014) S. B. Wang and C. T. Chan, Nature Communications 5, 1 (2014), ISSN 2041-1723, URL http://www.nature.com/doifinder/10.1038/ncomms4307.
- Volpe et al. (2006) G. Volpe, R. Quidant, G. Badenes, and D. Petrov, Physical Review Letters 96, 238101 (2006).
- Chen et al. (2010) Y. F. Chen, J. N. Milstein, and J. C. Meiners, Physical Review Letters 104, 1 (2010), ISSN 00319007.
- Herling et al. (2015) T. W. Herling, G. A. Garcia, T. C. T. Michaels, W. Grentz, J. Dean, U. Shimanovich, H. Gang, T. Müller, B. Kav, E. M. Terentjev, et al., Proceedings of the National Academy of Sciences 112, 1417326112 (2015), ISSN 1091-6490, URL http://www.pnas.org/content/early/2015/07/16/1417326112.abstract?sid=5c24a61b-5bba-45a7-bca1-30102a5175dd.
- Evans et al. (1995) E. Evans, K. Ritchie, and R. Merkel, Biophysical journal 68, 2580 (1995), ISSN 0006-3495, URL http://www.pubmedcentral.nih.gov/articlerender.fcgi?artid=1282168{&}tool=pmcentrez{&}rendertype=abstract.