Imaging and spectroscopic observations of a strange elliptical bubble in the northern arm of the spiral galaxy NGC 6946
Abstract
NGC 6946, known as the Fireworks galaxy because of its high supernova rate and high star formation, is embedded in a very extended HI halo. Its northern spiral arm is well detached from the galactic main body. We found that this arm contains a large ( pc in size) Red Ellipse, named according to a strong contamination of the H emission line on its optical images. The ellipse is accompanied by a short parallel arc and a few others still smaller and less regular; a bright star cluster is seen inside these features. The complicated combination of arcs seems to be unique, it is only a bit similar to some SNRs. However, the long-slit spectral data obtained with the Russian 6-m telescope did not confirm the origin of the nebula as a result of a single SN outburst. The emission-line spectrum corresponds to the photoionization by young hot stars with a small contribution of shock ionization. The most likely explanation of the Red Ellipse is a superbbuble created by a collective feedback of massive stars in the star cluster located in the NE side of the Red Ellipse. However, the very regular elliptical shape of the nebulae seems strange.
keywords:
HII Regions – galaxies: spiral – galaxies: individual: NGC 6946 – ISM: supernova remnants – galaxies: star formation1 INTRODUCTION
NGC 6946, a nearby starburst spiral galaxy, also known as the “Fireworks galaxy” because of its prolific supernova production, is embedded in an enormous HI halo (Pisano 2014). The galaxy has a high star formation rate and a number of unusual star-forming regions, such as enigmatic Hodge complex which contains a young super star cluster (Larsen et al., 2002; Efremov et al., 2004, 2007). NGC 6946 is famous also for hosting the record number of observed SNe.
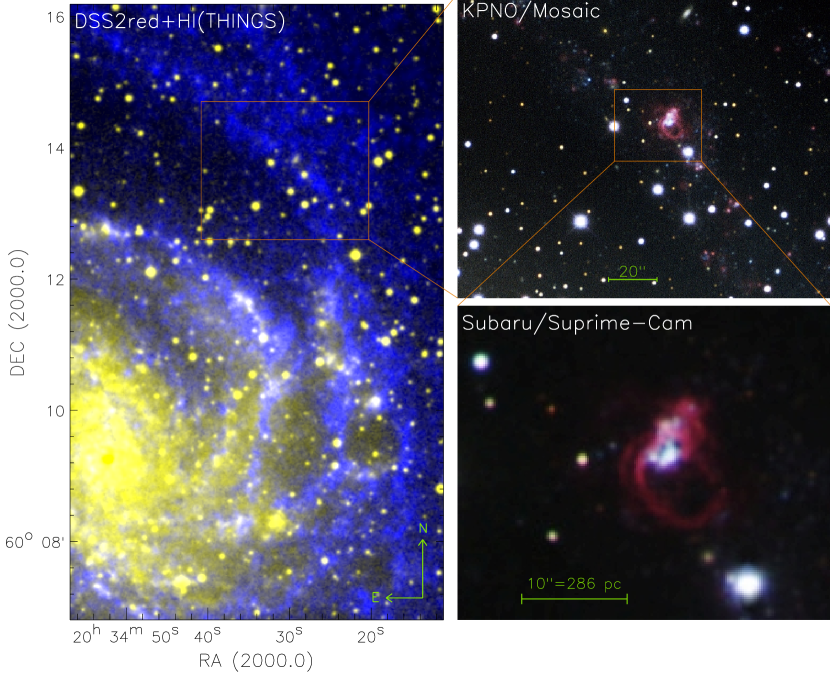
We found that apart from the above mentioned peculiarities, this galaxy hosts one more strange object, which in common images is seen as just one of its many HII regions. However, in deep high-resolution images this object is really wonderful. One of the best existing optical picture of NGC 6946 is the data, obtained with the Suprime-Cam on the Subaru 8.2-m telescope. Using this beautiful image from the Subaru telescope press-release, one of us (Yu.E.) has found an unusual red ellipse inside the isolated northern spiral arm; this color might be caused by H emission, what we do establish in this paper.
The ellipse is assumed to be within NGC 6946, because it is within the chain of HI clouds, H II regions, and luminous stars comprising the isolated Northern arm of this galaxy (Fig. 1). At a distance to NGC 6946 of 5.9 Mpc (according the updated nearby galaxy catalog by Karachentsev et al., 2013), the ellipse has a very large size of approximately pc. The accepted distance is close to the mean value of a few dozen measurements of the NGC 6946 distance in the literature, while the most recent values are Mpc (Bose & Kumar, 2014) and Mpc (Tikhonov, 2014). In this paper, we present the results of spectroscopic study of this elliptical nebulae on the 6-m telescope of the Special Astrophysical Observatory of the Russian Academy of Sciences (SAO RAS).
2 OBSERVATIONS AND DATA REDUCTION
2.1 Archival direct imaging
The Red Ellipse was found at the color image presented in the Subaru 8.2-m telescope press-release111http://www.subarutelescope.org/Pressrelease/2009/09/08/index.html. The data were obtained by the Subaru Observation Experience Program Team in the period of Aug 28 - Sep 3, 2008 with the Suprime-Cam imaging camera and have not been published in peer-review journals yet. The image presents an excellent combination of a large field ( arcmin) and high spatial resolution (pixel size arcsec). Figure 1 (bottom right) shows the fragment of the Subaru press-release composite color image: blue channel is image in the broad -band filter (centered on 0.45 ), the green channel is the filter (centered on 0.55 ) image, and the red channel presents data in the IA651 narrow-band filter centered on 0.651 (H+[NII]+continuum). The seeing value estimated as FWHM of single stars in the band was arcsec.
Later on, we found that the enigmatic ellipse is also well seen in the color image obtained at the Kitt Peak National Observatory (KPNO) 4-m Mayall telescope with the Mosaic Camera on Sep 5, 2008. 222The NOAO image galleryhttps://www.noao.edu/image_gallery/html/im1092.html (Fig. 1, top right). The composite color image presents the band (blue channel), band (green channel), and H+[NII] continuum (red channel) images. The pixel size was similar with the Subaru data ( arcsec), while the seeing was arcsec in the band.
We use the Subaru and KPNO press-release images to consider the morphological structure of the nebulae without photometric estimations. The astrometry grid was created using the Astrometry.net project web-interface 333http://nova.astrometry.net/.
The NE part of the Red Ellipse has a short parallel arc, as well as many other red and white details (Fig. 1). The ellipse slightly resembles a large supernova remnant somewhat similar to the ultraluminous supernova remnant complex (MF 16) in the NE arm of NGC 6946, studied by Blair, Fesen & Schlegel (2011) with HST WFPC2 images. That ellipse, however, is only about pc (in spite of being the largest SNR in NGC 6946 known until now) and has strong X-ray emission associated with it.
In any case, the elliptical ring is not a young supernova remnant, because there is no [Fe II] or X-ray emission, as follows from the data shown by Bruursema et al. (2014). The Red Ellipse is ten times larger and much brighter than the MF 16, and this fact alone casts strong doubt on the identification of the Red Ellipse as a SNR.

2.2 Spectroscopy
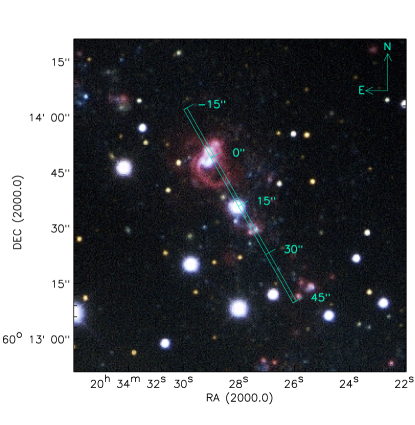
Long-slit spectral observations were carried out at the prime focus of the SAO RAS 6-m Big Telescope Alt-azimuthal (BTA) with the SCORPIO-2 multimode focal reducer (Afanasiev & Moiseev, 2011) in the night of 6/7 November 2015. The slit was 6.1 arcmin in length and 1 arcsec in width, the grism VPHG1200@540 provided a spectral resolution of about 4.5-5Å in the spectral range of 3650–7250Å with a mean reciprocal dispersion of 0.8Å per pixel, and with a spatial sampling of 0.36 arcsec per pixel along the slit. The total integration time was 2400 sec under seeing . We put the slit across the nebula major axis (), see Fig. 2. The object data and spectrum of the spectrophotometric standard star observed at the same night were reduced and calibrated using the IDL-based software developed at the SAO RAS, (see, for instance, Egorov, Lozinskaya & Moiseev, 2013)
The parameters of the emission lines (integrated flux, line-of-sight velocity, FWHM) were calculated from a single-gaussian fitting using a similar technique described in (Egorov et al., 2013). The doublets ([NII], [OIII], and [SII]) were fitted by a pair of Gaussians with the same velocities and FWHM. We estimated the errors of the measured parameters by analyzing the synthetic spectra degraded by noise with the same signal-to-noise ratio as in the corresponding observational spectrum. To increase the signal-to-noise ratio for weak emission regions, we binned spectrograms into 2 pixels bins along the slit prior to emission line analysis. The final spatial scale was 0.7 arcsec per pixel in a good accordance with the atmospheric seeing value. A multicomponent structure of the emission-line profiles was not detected. Also, the FWHM of the main emission lines is in a good agreement with the width of the nearest airglow emission lines, we can only conclude that the actual (free from instrumental contour broadening) FWHM of the lines is smaller than 50–70.
3 RESULTS
3.1 The nebulae integrated spectrum.
Figure 3 shows the integrated spectrum around () of the star cluster. The spectrum appears to be typical of an HII region; however, weak helium lines are also detected including the low-contrast broad bump around HeII. Therefore, some emission-line hot stars like Of or even WR could belong to the cluster. Noise on the spectrum shown on Fig. 3 grows up significantly at the short wavelength, because the quantum efficiency of CCD E2V42-90 detector decreases sharply in the blue part of the spectrum..
Table 1 lists the observed intensity of emission lines () in the integrated spectrum shown in Fig. 3 derived from the Gaussian fitting, as was described in previous section. The intensities are given in a standard scale where , here and bellow the errors correspond to level. We determined the color excess from the Balmer decrement using the theoretical intensity ratios of the hydrogen lines from the electron temperature K (Case B recombination, see Osterbrock, 1989) and the Fitzpatrick (1999) parametrization of the Cardelli, Clayton& Mathis (1989) extinction law. We obtained the following values for the color excess:
from H/ flux ratio,
from ratio, and
from ratio.
For dereddening of observed line intensity we used the first value because it has the significantly smaller uncertainty. The reddening-corrected intensities are also shown in Tab. 1. The accepted value corresponds to the visual extinction () in a nice agreement with the value presented in NASA/IPAC Extragalactic Database for coordinates of NGC6946 according Galactic extinction data from Schlafly & Finkbeiner (2011). It evidens that the extinction observed in direction of the Red Ellipse is caused by our Galaxy.
We calculated the nebular electron temperature from the [OIII](+)/[OIII] lines intensity ratio according the improved calibration relation of Pilyugin et al. (2010): K. The relative high uncertainty in is produced by large errors in [OIII] flux estimation. The average electron density derived from the [SII] line ratio according Osterbrock (1989) for K is .
| Lines | ||
|---|---|---|
| [OII] | ||
| H | ||
| H | ||
| [OIII] | ||
| HeI | ||
| HeII | ||
| H | ||
| [OIII] | ||
| [OIII] | ||
| HeI | ||
| [OI] | ||
| [NII] | ||
| H | ||
| [NII] | ||
| HeI | ||
| [SII] | ||
| [SII] | ||
| HeI | ||
| [ArIII] |
3.2 Emission-lines kinematics
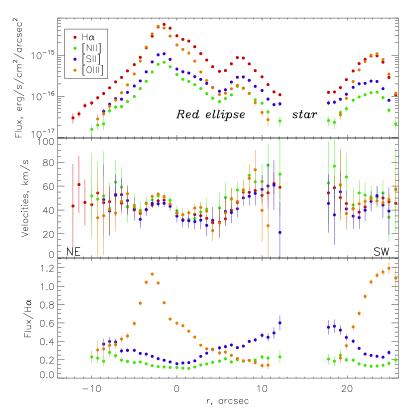
Only a few of the brightest emission lines are detected in the nebula outside the star cluster regions including the Balmer (H, H) and forbidden ([SII], [NII], [OIII]) lines. Changes of their parameters across the slit are shown in Fig. 4. The coordinates along the slit () are positive in WS directions with the coordinate origin in the star cluster photometric centre according to the ruler denoted in Fig. 2. Hereafter, we use a term “the main part” of the nebulae/Red Ellipse for points in the coordinate range corresponding to the bright borders of the objects in H-images, see Figs. 1 and 2. Also, our spectrograms allow us to study weak extended diffuse gas around the Red Ellipse. Note a significant light pollution from the Galaxy foreground star at near the SW border of the Red Ellipse. We can make the following conclusions based on the changes of emission-line parameters along the slit:
-
(i)
The velocities of the forbidden and Balmer lines are in a good agreement; their values across the Red Ellipse nebula lie in the range of 30–60 that is in a good agreement with the HI observations (45–55 , see below Sec. 4). If velocity variations in the main part of the Red Ellipse () are caused by nebula expansion, the corresponding expansion velocity should be less than 15–20.
-
(ii)
Behaviors of the forbidden-to-recombination lines ratio are different in the different lines. The relative flux in [OIII] increases in the NE side of the Red Ellipse (around the star cluster), while it decreases to the SW arcs, where the [SII]/H and [NII]/H ratios grow (hereafter, we use [N II]/H and [S II]/H to denote the [N II]/H and [S II]()/H line flux ratios respectively). Obviously, the growth of a temperature-sensitive [O III] emission line is related to the ionization radiation of hot massive stars in the cluster.
3.3 Gas ionization properties
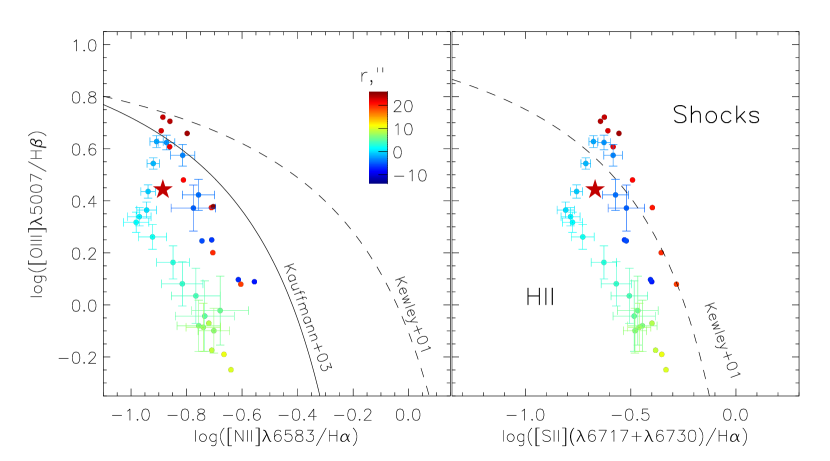
We used the ratios of neighboring emission lines independent of interstellar extinction to probe the gas ionization state. All points in the main part of the nebulae satisfy the case of photoionization by young stars according to the popular criteria H and H (Stasińska, 2006). However these ratios exceed 0.4–0.5 in diffuse gas outside the bright nebulae (, see Fig. 4). Similar behaviors of gas excitation inside/outside the Red Ellipse are also seen in the classical BPT diagram (Baldwin, Phillips & Terlevich, 1981) present H and H versus ratio (Fig. 5, top panels). Indeed, most points which belong to the Red Ellipse are located below the conventional lines (Kewley et al., 2001; Kauffmann et al., 2003) separated gas photoionized in the HII-regions and the regions, where gas is ionized by shocks or by hard UV photos from active galactic nuclei (AGN). While the points corresponding to the diffuse gas surrounding the main nebulae are located on the border dividing the different excitation mechanisms or even above the line, i.e., in the shock/AGN region. This fact indicates that shocks contribute to the gas ionization, which is not surprising for warm diffuse gas surrounding sites of current star formation. Also, the border line is occupied by points with from the vicinity of the star cluster, where the densest cloud of neutral gas is located according to the HI column density map (see below Sec. 4 and Fig. 6). As it was mentioned above, this region is characterized by relatively bright [O III] emissions, indicating high temperature of gas ionized by hot massive stars including shocks generated by stellar winds from WR and Of emission-line stars.
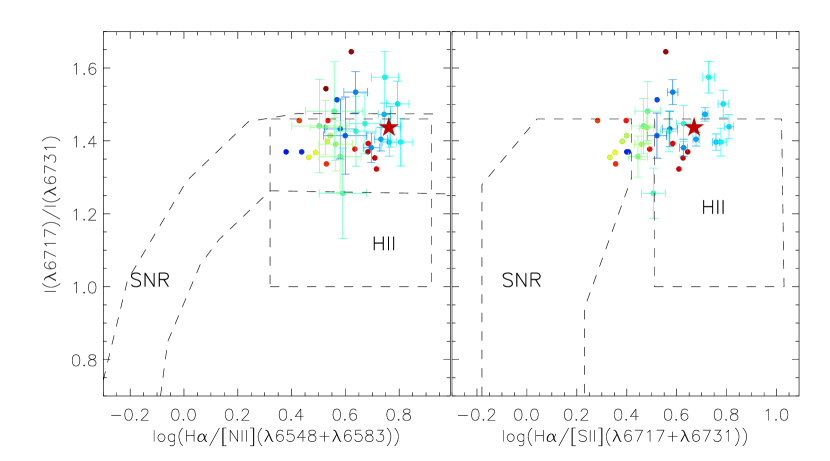
Also, we considered diagnostic diagrams separating different types of nebulas (SNR, HII-regions, and PN) using electron density-depended ratio of sulfur dublet components [SII] versus H/[NII] and H/[SII] lines ratio (Sabbadin, Minello, & Bianchini, 1997; Leonidaki, Boumis & Zezas, 2013). Bottom panels in Fig. 5 show that the points from the main part of the Red Ellipse avoid the region of Galactic and extragalactic SNR. These points are within the range of the lines ratios which is corresponded to HII-regions and the border SNR/HII. The observed data are distributed along vertical axis in the directions of high ratio corresponding to the electron densities (for K according Osterbrock, 1989). Some points are located even above the line ratio 1.44 that is formally forbidden by this ‘standard’ – relation. It implies that the mean in the Red Ellipse is smaller then in the typical HII regions, in agreement with our estimation for the integrated spectrum of the Red Ellipse (, see Sec. 3.1). This fact together with the ionization by hot stars and small contribution of shock points to superbubble created by collective actions of massive stars in the NE star cluster, as the most likely explanation of the Red Ellipse origin.
As it follows from Figs.4 and 5, the [SII]/H lines ratio exceeds the conventional value 0.4 (which separated shocks and photoionization) in the faint arc at the SW border of the nebula (). Therefore, the shock-heated gas make some contribution to the observed optical spectrum. The shocks might be generated by explosions of SN related with the central star cluster. However, their possible contribution to the total ionization seems to be negligible, because the lines ratios for the integrated nebular spectrum corresponds to massive stars photoionization (see the red stars in Fig. 5). Also, the value of electron temperature estimated for the Red Ellipse ( K, sec. 3.1) is significantly low comparing with observed in SNR in local galaxies (see, for example, Galarza, Walterbos & Braun, 1999). Therefore the Red Ellipse can not be considered as a ‘giant SNR’ created by a single SN explosion.
4 DISCUSSION
Ferguson et al. (1998) were among the first to study star formation in the extreme outer regions of disc galaxies including NGC 6946. Their H-image shows the region of the Red Ellipse as an unresolved bright H source. They infer that the star formation rate is fairly constant from the inner to the outer disc in NGC 6946, although, the covering factor of star formation in the outer disc is quite low, so the overall azimuthally averaged star formation rate abruptly drops in the outer regions.
Nevertheless, the outer northern spiral arm containing the Red Ellipse has the highest HI column density of any region in the outer galaxy, with a value of (Haan & Braun, 2014). It also has an unusual inward bulk motion of 30, which led Haan & Braun (2014) to suggest that this arm was compressed and moved by ram pressure from an intergalactic cloud. This cloud appears in the HI map of Pisano (2014).
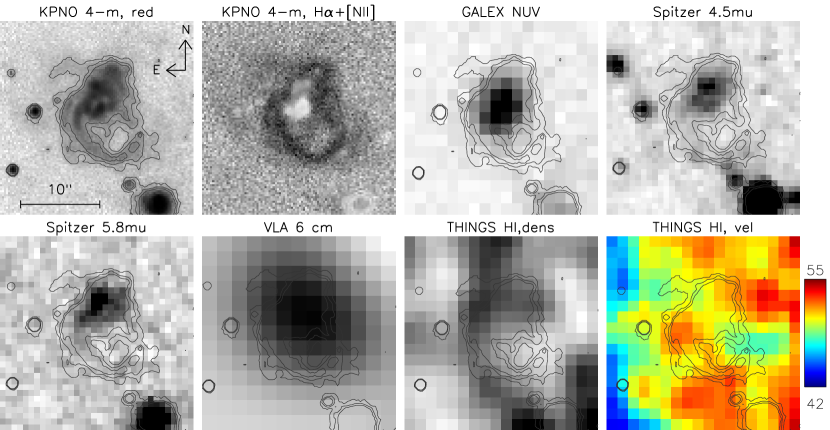
We might infer that this ram pressure has triggered the super star cluster, which resulted in supernovae leading to formation of a giant (even supergiant for a SNR) elliptical ring; anyway, we know that SNe may arise in a poor cluster as well (such as SN 1987a, the probable member of a small open cluster in the LMC (Efremov, 1991). The most intriguing feature of the nebula is its very regular elliptical shape similar to some SNR or Galactic ring nebulae around WR or Of stars. However, the size of the Red Ellipse ( pc along major axis) is comparable to wind blown structures related to giant HII-regions. Other arguments against SNR origin of the Red Ellipse are the following: (i) the lack of the X-ray and synchrotron radio emission; (ii) the contribution of shocks in gas ionization is very modest, as follows from our diagnostic diagrams. The multi-wavelength archive images of the nebula (Fig. 6) clearly demonstrate that GALEX UV, Spitzer MIR, and 6-cm radio emission are directly related to the star cluster in the base of the Red Ellipse. The HI line-of-sight velocities are in a good agreement with our estimation in the ionized gas if the difference of spatial resolutions will be taken into account. The HI velocity variations through the nebulae are modest and do not exceed a few . The extended diffuse regions of the nebulae are not detected in the present multi-wavelength data set with exception of Spitzer data. Indeed, Spitzer 4.5 and 5.8 images reveal weak counterparts in SW side of the Red Ellipse, where the cavern of low-density gas appears on the HI density map. We suggest that this feature could be related with warp dust emission, including Polycyclic Aromatic Hydrocarbons contributions which are usually observed in HII regions of active star formation.
5 CONCLUSIONS
The Red Ellipse seems to be a nebula created by collective actions of SN explosions and winds of massive stars in the NE stellar cluster—the presence of WR or Of stars is evident on the star cluster spectrum. However, even in this case, the regular and closed morphology of the Red Ellipse is unusual. It is possible that we observe a rare interplay between pre-existed distribution of cold and dense interstellar medium and hot gas ejected from young stellar group. Indeed, the cavern in the HI distribution according to the THING data matches the emission-line bubble (Fig. 6). A “wall” with the HI surface density observed near the SW border of the Red Ellipse can prevent its further expansion. A similar (but not the same) example is the well-known S3 giant bipolar nebula (two bubbles about 100 and 200 pc in diameter) created by a single WO star in the dwarf galaxy IC 1613. Lozinskaya et al. (2001) have shown that the unique structure of S3 is caused by stellar wind of the WO star embedded in a dense layer at the boundary of HI supercavity. Does the similar scenario work also in the case of the Red Ellipse? New observations, first of all integral-field data in the optical or/and NIR ranges together with the detailed simulations of feedback processes on the outskirts of NGC 6946 are crucial for the final conclusion. The strange regular shape of this nebula remains enigmatic.
ACKNOWLEDGMENTS
The observations at the 6-meter BTA telescope were carried out with the financial support of the Ministry of Education and Science of the Russian Federation (agreement No. 14.619.21.0004, project ID RFMEFI61914X0004). In this research, we used the NASA/IPAC Extragalactic Database (NED) which is operated by the Jet Propulsion Laboratory, California Institute of Technology under contract with the National Aeronautics and Space Administration. The GALEX image presented in this paper was obtained from the Mikulski Archive for Space Telescopes (MAST). STScI is operated by the Association of Universities for Research in Astronomy, Inc., under NASA contract NAS5-26555. The support for MAST for non-HST data is provided by the NASA Office of Space Science via grant NNX09AF08G and by other grants and contracts. We also note very useful collection of the NGC 6946 images obtained at the KPNO on the Mayall 4-m telescope with the Mosaic camera. This study has been carried out under the financial support of the Russian Science Foundation (project No. 14-22-00041). We are very grateful to Debra Elmegreen and Bruce Elmegreen for useful discussions and also to the anonymous referee for the constructive comments and suggestions that helped us to improve and clarify our result. We thank Roman Uklein and Dmitri Oparin for assisting in the 6-m telescope observations.
References
- Afanasiev & Moiseev (2011) Afanasiev V. L., Moiseev A. V., 2011, Baltic Astronomy, 20, 486
- Baldwin et al. (1981) Baldwin J. A., Phillips M. M., Terlevich R., 1981, PASP, 93, 5
- Bose & Kumar (2014) Bose S., Kumar B., 2014, ApJ, 782, 98
- Beck (1991) Beck R., 1991, A&A, 251, 15
- Blair et al. (2011) Blair W., Fesen R., Schlegel E., 2001, AJ, 121, 1497
- Boomsma et al. (2008) Boomsma R., Oosterloo T., Fraternali F., van der Hulst J., Sancisi R., 2008, A&A, 490, 555
- Bruursema et al. (2014) Bruursema J., Meixner M., Long K., Otskua M., 2014, AJ, 148, 41
- Calzetti et al. (2004) Calzetti, D., Harris, J., Gallagher J. et al. 2004, AJ, 127, 1405
- Calzetti et al. (2015) Calzetti D., Lee J., Sabbi E. et al. 2015, AJ, 149, 51
- Cardelli et al. (1989) Cardelli J. A., Clayton G. C., Mathis J. S., 1989, ApJ, 345, 245
- Efremov (1991) Efremov Yu., 1991, Sov. Astron. Lett., 17, 173
- Efremov et al. (2004) Efremov Yu., Alfaro E., Hodge P., Larsen S., Muñoz-Tuñón C., 2004, A&AT, 23, 95
- Efremov et al. (2007) Efremov Yu., Afanasiev V., Alfaro E. et al., 2007, MNRAS, 382, 481
- Egorov et al. (2013) Egorov O. V., Lozinskaya T. A., Moiseev A. V., 2013, MNRAS, 429, 1450
- Fitzpatrick (1999) Fitzpatrick E. L., 1999, PASP, 111, 63
- Ferguson et al. (1998) Ferguson A., Wyse R., Gallagher J., Hunter D. 1998, ApJ, 506, L19
- Galarza et al. (1999) Galarza V., Walterbos R.A.M., Braun R., 1999, AJ, 188, 2775
- Haan & Braun (2014) Haan S., Braun R. 2014, MNRAS, 443, 186
- Karachentsev et al. (2013) Karachentsev I. D., Makarov, D. I., Kaisina E. I., 2013, AJ, 145, 101K
- Kauffmann et al. (2003) Kauffmann G., Heckman T.M., Tremonti C. et al., 2003, MNRAS, 346, 1055
- Kewley et al. (2001) Kewley L., Dopita M., Sutherland R. et al., 2001, ApJ, 556, 121
- Larsen et al. (2002) Larsen S., Efremov Yu., Elmegreen B. et al., 2002, ApJ, 567, 896
- Leitherer et al. (1999) Leitherer C., Schaerer D., Goldader J. et al., 1999, ApJS, 123, 3
- Leonidaki et al. (2013) Leonidaki I., Boumis P., Zezas A., 2013, MNRAS, 429, 189
- Lozinskaya et al. (2001) Lozinskaya T., Moiseev A., Afanas’ev V., Wilcots E., Goss W., 2001, ARep, 45, 417
- Osterbrock (1989) Osterbrock D. E., 1989, Astrophysics of Gaseous Nebulae and Active Galactic Nuclei. University Science Books, Mill Valley, CA
- Pilyugin et al. (2010) Pilyugin, L. S., Vílchez, J. M., Thuan, T. X., 2010, ApJ, 720, 1738
- Pisano (2014) Pisano D., 2014, AJ, 147, 48
- Sabbadin et al. (1997) Sabbadin F., Minello S., Bianchini A., 1977, A&A, 60, 147
- Schlafly & Finkbeiner (2011) Schlafly E. F., Finkbeiner D. P., 2011, ApJ, 737, 103
- Stasińska (2006) Stasińska G., Cid Fernandes R., Mateus A., Sodré L., Asari N. V., 2006, MNRAS, 371, 972
- Tikhonov (2014) Tikhonov N. A., 2014, AstL, 40, 537
- Walter et al. (2008) Walter F., Brinks E., de Blok W. J. G., et al., 2008, AJ, 136, 2563