Analysis of the multiple system with CP component Draconis
Abstract
The star Dra comprises a spectroscopic binary and a third star that together form a visual triple system. It is one of the brightest chemically peculiar (CP) stars of the upper main sequence. Despite these facts, no comprehensive study of its multiplicity has been performed yet. In this work, we present a detailed analysis of the triple system based on available measurements. We use radial velocities taken from four sources in the literature in a re-analysis of the inner spectroscopic binary (Aab). An incorrect value of the orbital period of the inner system Aab about 27 days was accepted in literature more than forty years. A new solution of orbit with the 128-day period was determined. Relative position measurements of the outer visual binary system (AB) from Washington Double Star Catalog were compared with known orbital models. Furthermore, it was shown that astrometric motion in system AB is well described by the model of Andrade (2005) with a 308-year orbital period. Parameters of A and B components were utilized to estimate individual brightness for all components and their masses from evolutionary tracks. Although we found several facts which support the gravitational bond between them, unbound solution cannot be fully excluded yet.
keywords:
stars: chemically peculiar – stars: variables: general – binaries: spectroscopic – binaries: visual – stars: individual: Dra1 Introduction
Chemically peculiar (CP) stars play a key role as a test of evolutionary models due to their anomalous atmospheric composition. Many of them are periodic variable stars with periods corresponding to rotational periods (Adelman 2002). Therefore, CP stars are very helpful for a study of rotational periods and their stability among main-sequence stars. Preferably, stellar parameters would be known with high precision for such studies, especially the stellar mass. Mass of the star is one of the most important parameters for establishing of the evolutionary status and can be determined with high accuracy when the star belongs to a binary system. Information about binarity is also necessary for a study of brightness variations (even if it is not an eclipsing system). An additional light source in the system influences the observed amplitude of variability (decrease in observed amplitude) and observed spectra (depths and shapes of spectral lines, appearance of additional lines). Another component also affects radial velocities (hereafter RVs) of the studied star.
Our target Dra (HD 170000 = HIP 89908 = HR 6920) is one of the brightest CP stars ( mag). For a long time, it has been known as a variable star (Winzer 1974; Schöneich & Hildebrandt 1976; Kukarkin et al. 1977) with relatively low amplitude in optical bands (0.02 – 0.03 mag) and rotational period about 1.7 d e.g. 1.7164 (Winzer 1974), 1.71646(6) d (Musielok et al. 1980). We selected this star for calculation of model of its atmosphere, which was subsequently used for light curve reconstruction (Prvák et al. 2014, 2015). The availability of abundance maps from Doppler imaging in Kuschnig (1998), which were used for calculation of atmospheric models, was the main criterion for the selection of this star. The opportunity to compare our light curve models with high-accurate 10-colour photometry obtained by Musielok et al. (1980) belongs to the great advantages. The preliminary results from this effort, in which the main chemical elements known from spectra are included in the model of the synthetic atmosphere, are very promising (Prvák et al. 2014). A similar approach was used e.g. for star HD 37776 (Krtička et al. 2007) and HR 7224 (Krtička et al. 2009).
Nevertheless, Dra is a multiple stellar system and several basic parameters, such as the period of the inner binary system, are highly uncertain (see below). In this paper, we performed a detailed analysis of the multiple system to adequately estimate the influence of the multiplicity on our light curve modelling, which is presented in Prvák et al. (2015).
The object Dra is probably a triple system with components Aa, Ab and B (Tokovinin 2008) but a fourth component C (optical) is also present in the Washington Double Star Catalog (WDS, Mason et al. 2001). Outer binary system AB creates a visual binary with known brightness for both components from Hipparcos satellite mag and mag (ESA 1997). Their orbit with very long period was calculated several times and the last published orbital parameters from Andrade (2005) include orbital period years, angular projection of semi-major axis , and high eccentricity . Main A component is an SB1-type spectroscopic binary (Aa, Ab) with contradictory orbital period of 26.768(7) days (Abt & Snowden 1973) or 127.85 days (Beardsley 1969).
The star Dra is a frequently studied, but no comprehensive study of the multiple system exists. Furthermore, several catalogues adopted the orbital period of Abt & Snowden (1973) despite the fact that it was determined only from 10 measurements and the authors themselves doubted its correctness because this period is not compatible with any of older datasets.
We re-analysed the available RV measurements to obtain correct orbital parameters of the inner binary system Aab (Sect. 2). Thereafter, we used relative position measurements of B component from WDS and verified results from Andrade (2005), Sect. 3. Evidence for the gravitational bond of the binary is presented in Sect. 3.2. In addition, we consider an unbound explanation (Sect. 3.3). We briefly discuss component C and whether it is bound to components A and B in Sect. 4. We also analyse the whole triple system together (Sect. 5). Our final results are summarized and discussed in Sect. 6.
2 Inner spectroscopic binary system Dra Aab
2.1 Available RV measurements
The first spectroscopic observations of Dra (Maury & Pickering 1897) revealed a peculiar spectrum with lines of hydrogen (Balmer series), He I (4026.4 Å), and Si II (4128.5, 4131.4 Å). RVs of Dra were measured with low-resolution spectrographs (from composed spectra with fainter B component111B component is fainter about 1.5 mag than A component (Sect. 5.2) and angular distance between both components was under 0.5 ′′ during 20th century (Sect. 3).) several times during the 20th century (see Table 1, Frost & Lee 1909; Hnatek 1914; Campbell & Moore 1928; Frost, Barrett & Struve 1929; Harper 1937; Beardsley 1969; Abt & Snowden 1973). Unfortunately, modern high-quality spectra are almost absent. Exceptions are spectra from Kuschnig (1998) used for Doppler imaging (no RV) and one spectrum obtained by Takeda et al. (1999) with one RV value.
| Author | Year of obs. | |
|---|---|---|
| Frost & Lee (1909)∗ | 4 | 1906 – 1909 |
| Frost, Barrett & Struve (1929) | 28 + 4∗∗ | 1920 – 1922 |
| Beardsley (1969) | 39 | 1911 – 1914 |
| Abt & Snowden (1973) | 10 | 1965 – 1966 |
| Hnatek (1914)∗ | 3 | 1913 |
| Campbell & Moore (1928) | 4 | 1896 – 1905 |
| Harper (1937) | 2 | 1927 |
| Takeda et al. (1999) | 1 | 1992 |
Notes: (∗) Double lines were detected, (∗∗) four RV values were obtained by re-analysing of spectra from Frost & Lee (1909).
Variations in RV were detected by Frost & Lee (1909), they also found doubling of lines on 3 plates from which they deduced binarity of the A component. The same plates were re-analysed by Kohl (values were published in Frost, Barrett & Struve 1929), he measured RVs only from centres of spectral lines. The occurrence of double lines in 2 spectra was also published by Hnatek (1914). However, all photographic double line measurements of Dra are probably only artefacts not related to the binarity as discussed Frost, Barrett & Struve (1929). Nevertheless, variations in the shape of lines are known, but only from high-resolution spectroscopy and are caused by CP variability (Kuschnig 1998). Frost, Barrett & Struve (1929) also obtained new RV measurements with high scatter around mean value km s-1 but they did not mention any explanation.
Beardsley (1969) published 39 RV measurements from spectra obtained on Allegheny observatory in 1911 – 1914. He confirmed the variability in RVs with semi-amplitude of km s-1 and he explained it as an orbit of unseen component with period of 127.85 d (SB1-type binary). Beardsley also determined other orbital parameters of this inner binary system Aab from RV modelling (see Table 2). In addition, he mentioned that residuals after subtraction of RV binary model are highly scattered and he attributed it to an unspecified short-period variation.
Abt & Snowden (1973) obtained 10 RV measurements with higher accuracy on Kitt Peak observatory in 1965 – 1966. They established shorter orbital period of 26.768(7) days based only on their values. They noted that their orbital parameters (Table 2) are not usable for extrapolation of older measurements and thus the real period could be different. Despite the fact, their period is frequently adopted in literature (Pourbaix et al. 2004; Tokovinin 2008; Ducati, Penteado & Turcati 2011).
2.2 Analysis of RV measurements
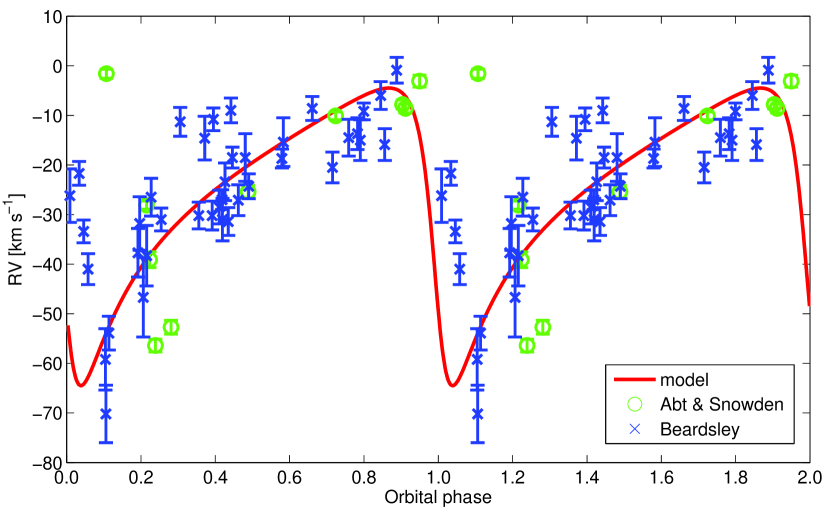
Difference between orbital periods 26.768(7) d (Abt & Snowden 1973) and 127.85 d (Beardsley 1969) is remarkable. It is necessary to determine the correct value. In the beginning, we used datasets from Beardsley (1969) and Abt & Snowden (1973) and compared them with the models of RV curves for both sets of orbital elements. Model calculated with elements from Abt & Snowden (1973) is not consistent with data from Beardsley (1969), but fits well their own measurements (Fig. 1, upper panel). On the other hand, model based on parameters from Beardsley (1969) describes variations in both datasets much better (Fig. 1, bottom panel), nevertheless, model is slightly shifted in phase for both measured RV curves. It is evident from Fig. 1 and also from sum of squares of the residuals between both datasets and models ( and for parameters from Beardsley (1969) and Abt & Snowden (1973), respectively), that period of Beardsley (1969) is much closer to the correct value than the Abt & Snowden (1973) one.

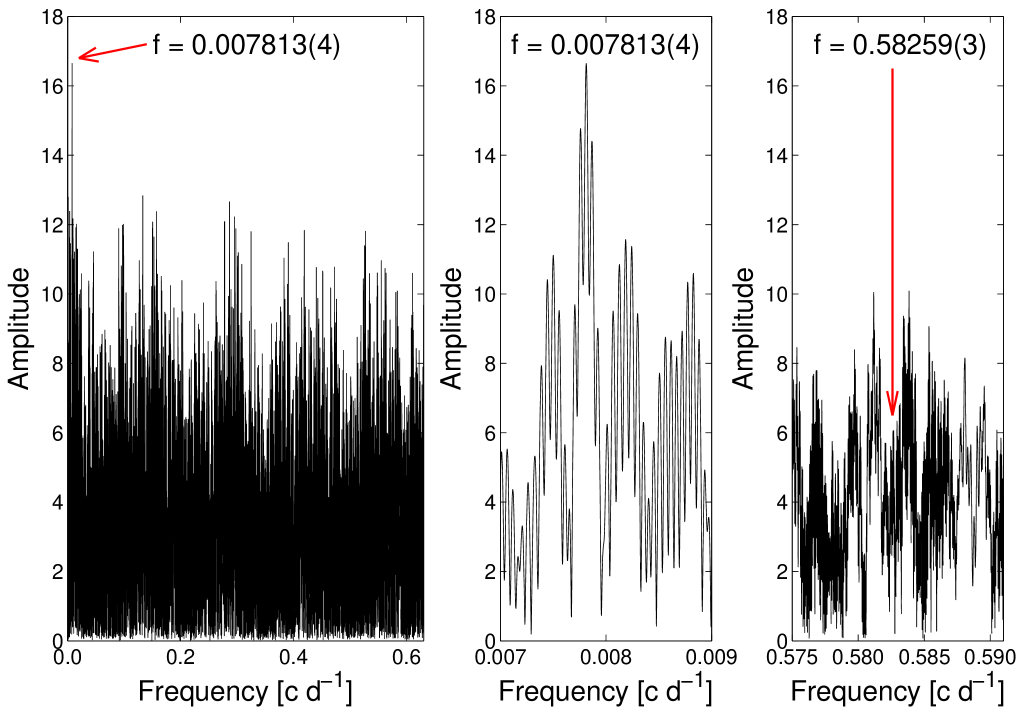
Subsequently, we performed a frequency analysis of RV measurements from the most extensive datasets222We ignored the low numerous datasets from Table 1, because are not statistically significant. (Frost, Barrett & Struve 1929; Beardsley 1969; Abt & Snowden 1973) using Period04 software (Lenz & Breger 2005). We found the strongest frequency 0.007813(4) c d-1 (period 127.99(7) d) which is very close to Beardsley’s value 127.85 d (see Fig. 2). We also tested the value of the period of 1.71646(6) d, which could indicate a connection with the period of CP variability (rotation of the CP star). This value was not found in these RVs (right panel of Fig. 2).
Therefore, we adopted the binary explanation and used non-linear least-squares fitting (Mikulášek 2007; Mikulášek & Zejda 2013; Mikulášek 2015) for determination of the orbital parameters based on equations from Irwin (1952). Kepler’s equation was solved iteratively by Newton’s method. All derivatives were calculated analytically. We used an approach similar to that of, e.g., Van Hamme & Wilson (2007).
Dataset from Frost, Barrett & Struve (1929) was published without measurement uncertainties (data contains also the re-analysed RVs from spectra obtained by Frost & Lee 1909). The other used datasets have underestimated uncertainties, as we found from scatter of residuals after subtraction of the best model (scatter was higher than the mean value of uncertainties). Therefore, we used different uncertainties. Their values were iteratively calculated during the fitting process according to the root-mean-square scatter of residuals between model and each dataset. We found mean RV uncertainty of 11.9 km s-1 for Frost, Barrett & Struve (1929), 7.3 km s-1 for Beardsley (1969)333It is 2.04 times higher than mean uncertainty of original RVs., and 1.6 km s-1 for Abt & Snowden (1973)444It is 1.44 times higher than mean uncertainty of original RVs., respectively.
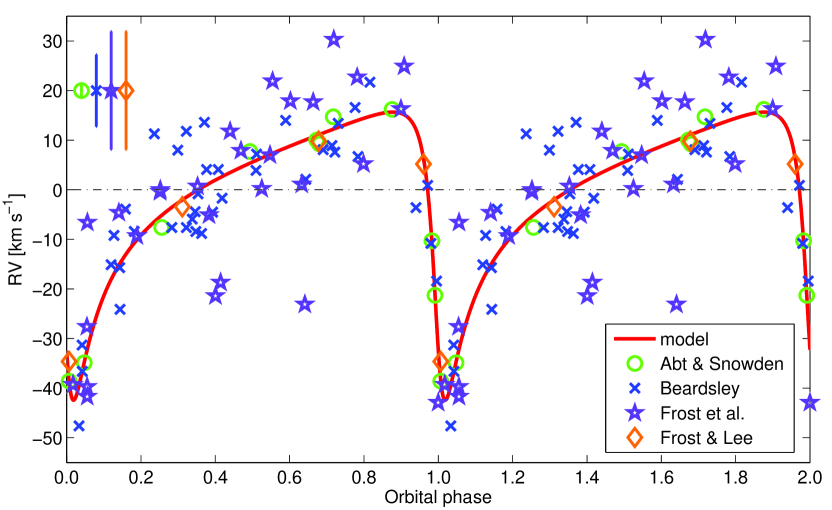
The best found solution with the lowest sum of squares of the residuals has weighted value with normalised value . The number of measurements is 81 and the number of fitted parameters is 9. The final parameters were used to determine their uncertainties by bootstrap-resampling method. Errors given in Table 2 correspond to . The observed variations in RVs are well described by our model (Fig. 3), which is in good agreement with (distribution of residual values is similar to normal distribution).
Our modelling of the system Aab orbit allowed to find more accurate value of orbital period d with high eccentricity . Observed variation in RV can be described by semi-amplitude of RV km s-1, and -velocities determined for each datasets555RVs from Frost, Barrett & Struve (1929) were divided into two groups according to the time of observations – old values from Frost & Lee (1909) and later ones – to study variations in -velocity. Their uncertainties were adopted the same.. In addition we established the mass function M⊙ and the lowest mass of Ab component M⊙. This mass limit was computed for inclination angle of and adopted mass of CP star M⊙ according to values 3.29(17) M⊙ (Allende Prieto & Lambert 1999) and 3.30(8) M⊙ (Kochukhov & Bagnulo 2006). The projection of semi-major axis of the Aa component is au. The orbital parameters allowed us to predict semi-amplitude of Light Time Effect (LiTE) day which influences rotational period of CP component (see Sect. 5.1). Our determined orbital parameters are quite similar as values found by Beardsley (1969).
| Author | Beardsley | Abt & Snowden | This paper |
|---|---|---|---|
| Pub. year | (1969) | (1973) | – |
| [d] | 127.85 | 26.768(7) | 127.9902 |
| [HJD] | 2413823.7 | 2438853.6(1.6) | 2413825.79 |
| 0.60 | 0.39(4) | 0.707 | |
| 120 | 171(17) | 130.8 | |
| [km s-1] | 30 | 26.6(2.1) | 29.0 |
| [km s-1] | – | ||
| [km s-1] | – | ||
| [km s-1] | – | – | |
| [km s-1] | – | – | |
| – | – | 6420.7 | |
| – | – | 78 | |
| – | – | 1.08(17) | |
| 39 | 10 | 81 | |
| [au] | 0.282∗ | 0.0603 | 0.2421 |
| [d] | 0.00155∗ | 0.00032∗ | 0.001241 |
| [M⊙] | 0.183∗ | 0.0408 | 0.116 |
| [M⊙] | 1.65∗ | 0.90∗ | 1.359 |
Notes: (∗) – parameters were calculated by us using values from original study.
Parameters: – orbital period, – time of periastron passage, – numerical eccentricity, – argument of periastron, – semi-amplitude of RV variation, – systemic RV of mass-centre of binary, lower indices mark used source of observations – Be (Beardsley 1969), AbSn (Abt & Snowden 1973), FrLe (Frost & Lee 1909), and FrBaSt (Frost, Barrett & Struve 1929), – sum of squares of the residuals (non-weighted), – quality indicator of the fit (value of normalised by uncertainties), – value of normalised by numbers of RVs and free parameters, – number of used RV measurements, – projection of semi-major axis of the Aa component, – semi-amplitude of variations in diagram cause by LiTE, – mass function, – the lowest mass of Ab component (inclination , mass M⊙).
3 Outer visual binary system Dra AB
3.1 Analysis of available data
The visual binary system Dra AB also named WDS J18208+7120AB = CCDM J18208+7120AB = STT 353AB is known since the 19th century. The first position measurement of B relative to A component was performed in 1843 (WDS, Mason et al. 2001). Up to now, under 100 averaged relative measurements of position for the B component exist. The orbit of the visual binary AB was computed several times (Olevic 1975; Olevic & Catovic 1990; Andrade 2005) and parameters from these studies are summarized for comparison in Table 3. We added values of the absolute semi-major axis of the orbit which were calculated from their angular projections and the parallax of Dra adopted from Hipparcos measurements mas (van Leeuwen 2007). It allows us to determine the mass of the whole visual binary system .
| Author | Olevic∗ | Olevic & Catovic | Andrade |
|---|---|---|---|
| Pub. year | (1975) | (1990) | (2005) |
| [yr] | 271.7 | 401.85 | 307.8 |
| [yr] | 1720.750 | 1767.69 | 2116.6 |
| 0.440 | 0.236 | 0.752 | |
| 72.25 | 66.9 | 70.3 | |
| 0.392 | 0.614 | 0.965 | |
| 118.96 | 103.6 | 95.6 | |
| 201.25 | 282.7 | 275.0 | |
| Last Obs. [yr] | 1968 | 1986.405 | 1998.679 |
| [au]∗∗ | 36.40 | 57.01 | 89.60 |
| [M⊙]∗∗ | 0.65 | 1.15 | 7.59 |
| ∗∗ | 15.51 | 5.90 | 5.04 |
Notes: (∗) – parameters were used from the Fourth Catalog of Orbits of Visual Binary Stars (Worley & Heintz 1983),
(∗∗) – parameters were calculated by us using values from original study.
Parameters: – orbital period, – time of periastron passage, – numerical eccentricity, – position angle of node, – angular value of total semi-major axis, – inclination angle of the orbit, – argument of periastron, Last. Obs. – date of the last position measurements, – absolute value of total semi-major axis – parallax was adopted mas (van Leeuwen 2007), – total mass of AB system, – sum of squares of the residuals from model of relative orbit and 92 available positions.
The orbital parameters given in the literature differ significantly (Table 3), and so do the calculated parameters and . We have not found any comparison of the consistency of the three orbital models with the observational data. Furthermore, the last model of the orbit was published in 2005, and the last observation used in the mentioned work was obtained in 1998. We decided to verify all three models to select the model which successfully describes all available data.
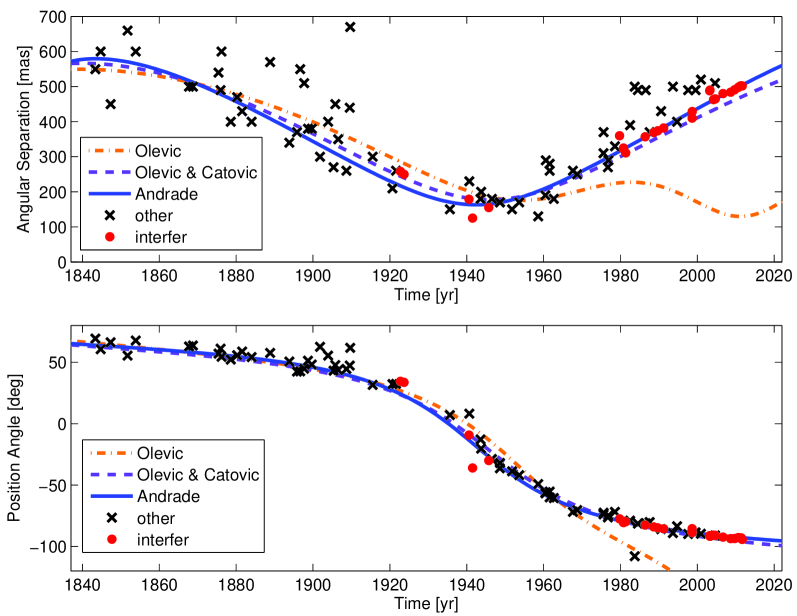
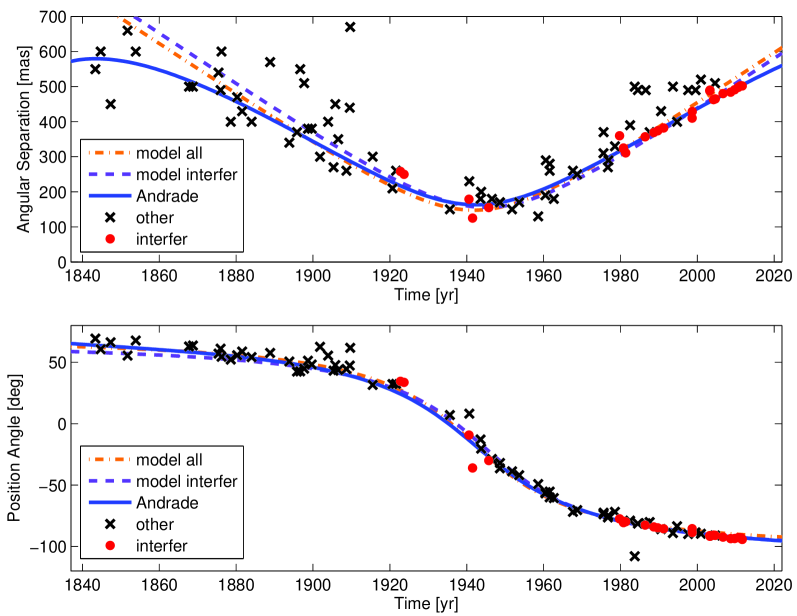
We used data from WDS (version from 2014, April, 30); 92 pairs of relative position parameters (angular separation and position angle ) were obtained in the time interval from 1843.38 to 2011.69. The three values of position angle from Comstock (1896) are probably shifted by 180 ∘ (the corrected values were used in our calculation). We displayed the time dependences of the parameters , together with known models (Fig. 4) and reconstructed the relative orbit (Fig. 5). Interferometric values, which should have the highest accuracy from all measurements, are listed in the Fourth Catalog of Interferometric Measurements of Binary Stars666http://www.usno.navy.mil/USNO/astrometry/optical-IR-prod/wds/int4 (INT4, Hartkopf et al. 2001) and are marked in figures as “interfer”. With respect to these figures, models based on parameters from Olevic (1975) and Olevic & Catovic (1990)777Model from Olevic & Catovic (1990) does not describe the latest variations in and relative orbit (Fig. 5). can be ruled out because models disagree with the latest observations. Calculated sum of squares of the residuals888Non-weighted, the uncertainties of most measurements were not known. for models of relative orbits and all available measurements (Table 3) are also worse than for the latest study (Andrade 2005). Models based on parameters from Andrade (2005) well describe all dependencies and we adopted his parameters for our subsequent analysis. Despite the fact, these parameters are still very uncertain because the whole orbit was not observed yet due to the long period of about 300 years. Moreover, unbound explanation discussed below is also possible.

3.2 Binary System Dra AB – evidence for a gravitationally bound system
The shape of changes in the relative position between A and B component (Fig. 5) is “almost rectilinear relative motion” (WDS). Therefore, we propose that the system AB might not be bound and the fainter star only passes around the Dra. Our theory is supported through the high eccentricity found by Andrade (2005) and fast-growing angular and absolute semi-major axis in different studies (36.40 au in 1975, 57.01 au in 1990, 89.60 au in 2005, see Table 3)999In case of unbound system, the eccentricity and semi-major axis can grow continually with longer time base to describe observed changes.. Therefore, we were looking for other evidence that could confirm or disprove the gravitational binding.
Proper motions were mostly measured for the whole system Dra AB (dominant A component) (e.g., Roeser et al. 2010; Zacharias et al. 2012, 2013). Probably only Hipparcos observations have yielded independent values for the A and B components (ESA 1997). The similarity of the values supports the hypothesis that the two components are bound (see Table 4).
The parallaxes for both components in catalogue Double and Multiples: Component solutions (ESA 1997) are the same mas and were measured only for the brighter A component. The corrected value of parallax mas (van Leeuwen 2007) is given only for the whole system. Therefore, the both components may or may not be in the same distance from the Sun.
The position of A and B components in HR diagram is promising. When we estimate that both stars have roughly the same age, the observed brightness difference between them is caused only through different luminosity. Therefore, the stars should lie on the one isochrone. We found that positions of A and B components in HR diagram (for the same distance from Sun) correspond to different isochrones, but the distance between the lines is small (details in Sect. 5.3).
We did not find in literature any information about spectroscopic measurements of the B component or its RV.
3.3 Binary system Dra AB – test of gravitationally unbound solution
As was mentioned, the shape of the visual relative motion of the A and B stars indicates the possibility that the two components are not bound. We applied the least-squares method (only non-weighted, because uncertainties for most of measurements are not known) to find the model of the relative proper motion between both stars which could explain the observed changes in position. We used values of and from WDS and we fitted values of velocity B star relative to A star in both directions , , time of minimal distance between both stars , and corresponding position B star relative to A star , . Mentioned parameters were determined on the whole dataset and on the high-accurate measurements (all interferometric measurements from INT4). The best found model for all measurements (parameters are in Table 5) well describe the observed variations in angular separation and position angle (Fig. 6) as same as relative motion (Fig. 7). Although, we cannot fully exclude gravitationally unbound explanation, model of binary orbit from Andrade (2005) describes variations better (sum of squares of the residuals = 5.04) than does the unbound model ( = 5.72). It is visible, especially in the latest interferometric observations. Therefore, we accepted bound solution as correct.
| Data set | All measurements | Interferometric |
|---|---|---|
| [yr] | 1941.8(1.3) | 1945(2) |
| [mas] | 142(4) | 146(5) |
| [mas] | ||
| [mas yr-1] | ||
| [mas yr-1] | ||
| Interval [yr] | 1843.38 – 2011.69 | 1922.746 – 2011.69 |
| 92 | 26 | |
| 5.72 | 0.55 |


4 Optical binary system Dra ABC
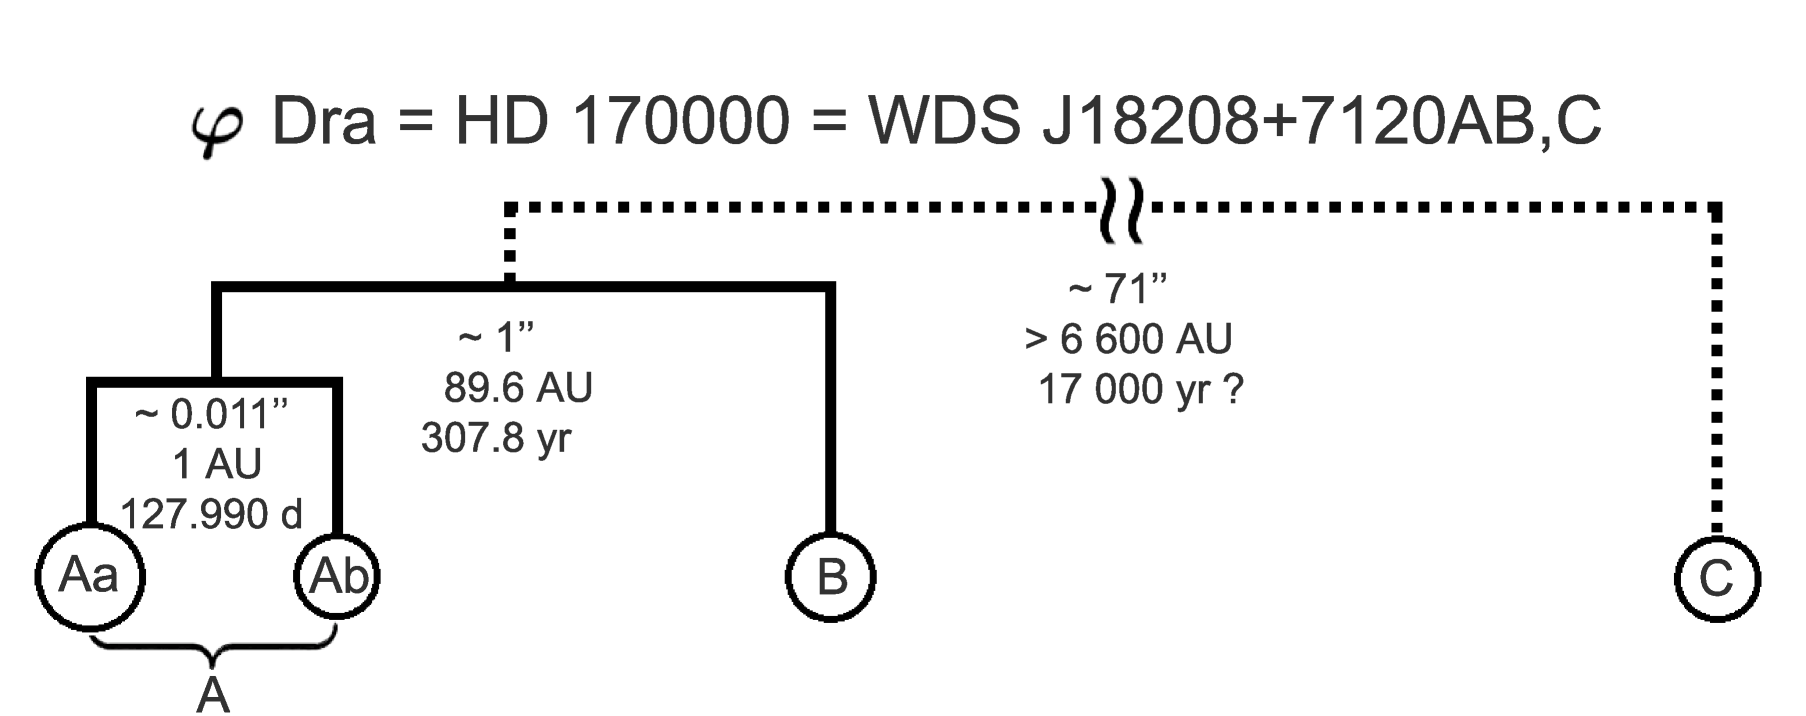
WDS (Mason et al. 2001) contains also the third visual component in Dra, WDS J18208+7120C = CCDM J18208+7120C = STT 353AB,C = 2MASS J18205889+7119437. This C component with visual brightness about 12.70 mag () has only 5 pairs of relative position measurements from 1912.32 to 2007.72 in the used version of WDS. Its position is changed only slightly as seen in Fig. 8 and on values of angular separation C from AB () and position angle () for the first and the last observation given in WDS.
We did not find the distance of the C component from the Sun in literature. If we adopted the same parallax as for Dra, mas (van Leeuwen 2007) and circular orbit, then actual minimal distance from system AB is about 6572 au (for angular separation ). When we assume the total mass of AB component 7.59 M⊙ and neglecting mass of C component, the orbital period calculated using Kepler’s third law is extremely long of 193000 yr. We also estimate the orbital period from angular changes ( per 95.4 years), which give us 17100 years (one order lower value) for completing one orbit. These roughly-estimated values almost exclude gravitational bond between AB system and C component. This opinion is supported via proper motions. The values for C star differ significantly in declination compare to system AB (see Sect. 3.2, Table 4).
The field around Dra belongs among sparse areas of Galaxy (, ) with a quite low number of stars. We tried to estimate probability that a star similar as C component (12.7 mag in ) accidentally occurs in area with radius 71 ′′, therefore total numbers of stars with the same or higher brightness in this area with radius 20, 30, 40, 50, and 60 ′ were computed and compared. We found approximately 6% probability for it using the SIMBAD astronomical database (Wenger et al. 2000) and given magnitudes, but our previous experiences with SIMBAD show that this sample is not probably complete. We obtained more realistic estimation from the USNO-B1.0 catalog (Monet et al. 2003, missing -band), where probability for the same minimal brightness is two times (-band) or even three times higher (-band)101010For B component, the probability of random occurrence is almost equal zero – no other star brighter than 6 mag up to 60 ′ is listed in both sources..
The star C is listed as an optical (not bound) component of Dra in WDS and our findings also weakly support the hypothesis. In any case, its influence on the main triple system is negligible for our study (low flux contributions in optical band, extremely long-term changes in RV) and we ignore it during other analysis. Our scheme of the multiple system Dra known also as “mobile diagram” is in Fig. 9.
5 Analysis of the whole system
5.1 Mass of components
At first we determined masses of the individual stars. If we adopted the bound visual system AB and parallax mas (van Leeuwen 2007), then we obtain the total mass of the triple system M⊙ from visual orbit and parameters determined by Andrade (2005). Mass of the brightest component was adopted M⊙ (see Sect. 2.2). The rest of mass is divided into components Ab and B, unfortunately we can say nothing about mass of B component. However, we have determined lower mass-limit for Ab star M⊙ from RV fitting of the inner pair. The exact value of Ab mass depends on the inclination of the orbit Aab. Inclination is not known but may be lower than because the system is not known as an eclipsing one, nevertheless only Hipparcos dataset (106 measurements) covers the whole 128-day period and does not confirm the eclipses. The B component has maximal mass M⊙ from mentioned reasons.
From this, we predict about three-centuries long cyclic variations in systemic RV of A component caused by B component with maximal semi-amplitude km s-1 (for ). Individual values of -velocities for the inner system determined from different RV datasets (Table 2) undergo random time-independent changes and are probably related to systematic errors (especially the maximum deviated value from Beardsley 1969) and do not correspond expected long-term behaviour. In addition, the mean uncertainties of individual measurements are comparable with this scatter. Orbit of B component also influences observation of periodic effects, such as orbit of the inner binary system or CP variation, through the LiTE. It should be detectable in OC diagram with maximal semi-amplitude days. It was tested by analysis of CP variability, unfortunately only three available photometric datasets covering forty-year long interval are insufficient to show significant variations in OC (Prvák et al. 2015). The LiTE caused by Aab component ( d, d) is also not apparent in diagram.
Evolutionary models of stars allow to find mass of the components based on photometry. Construction of HR diagram for visual pair A and B (see Sect. 5.3) and best found isochrones enable to estimate mass M⊙ and M⊙ for Aa and B component, respectively. In addition, accepting the total mass of the system M⊙ from the visual orbit, we obtain mass of Ab component M⊙, as the rest of mass. Using mass function known from spectroscopic orbit we calculated inclination angle for Aab system .
5.2 Brightness and spectral types of components
Determination of brightness for the individual components and their contribution to the total flux of Dra is very difficult due to the lack of precise measurements. The vast majority of the photometric measurements in different passbands (e.g., in Musielok et al. 1980) correspond to the total brightness of the whole triple system.
The magnitude difference between the components A and B varies from 1.0 mag to 2.1 mag according to available literature (see Table 6)111111Most of them are only visual estimated values; angular distance of visual components was under in 20th century and under limit of angular resolution of most classical photometers.. The values for A and B components from the Hipparcos mag, mag (ESA 1997) and difference between both stars mag, bring more precise information about A and B components. Data from Hipparcos and Tycho instrument was also used for two-colour photometry of visual components by Fabricius & Makarov (2000). They found mag, mag and mag, mag that give us = 1.50(1) mag and = 1.42(1) mag. We estimate that the B component is probably redder than the A component from the decreasing relative brightness in direction to the longer wavelengths. We found only one other work with original precise measurements of relative brightness in red and infrared passbands mag, mag (Rutkowski & Waniak 2005). These values were obtained using speckle interferometry technique and well confirm our assumption.
| Passband | Author, Pub. year | |||
|---|---|---|---|---|
| 4.4 | 6.5 | 2.1∗ | – | Campbell & Moore (1928) |
| 4.5 | 6.2 | 1.7∗ | – | Moore (1932) |
| – | – | 1.0 | vis | Kuiper (1961) |
| – | – | vis | Worley (1962) | |
| avg 1.6(3) | ||||
| 4.4 | 6.1 | 1.7∗ | – | van Biesbroeck (1974) |
| 4.8 | 6.5 | 1.7∗ | – | Muller (1978) |
| 4.40 | 6.10 | 1.70∗ | or vis | Worley & Heintz (1983) |
| 4.455(3) | 5.900(10) | 1.445(10)∗ | ESA (1997) | |
| 4.39(1) | 5.89(1) | 1.50(1)∗ | Fabricius & Makarov (2000) | |
| 4.48(1) | 5.90(1) | 1.42(1)∗ | Fabricius & Makarov (2000) | |
| 4.2 | 5.7 | 1.5∗ | or vis | Douglass et al. (2000) |
| – | – | 1.42(2) | Rutkowski & Waniak (2005) | |
| – | – | 1.33(3) | Rutkowski & Waniak (2005) |
Notes: (∗) Parameters were calculated by us as difference between and adopted from the original study.
Spectroscopic and most of photometric measurements of Dra provide information about the whole object. Its spectral type was recently estimated as B8V C (Gray & Corbally 2014). According to the colour indices corrected for extinction (see Table 7) mag and mag for A and B component, respectively, we estimated the spectral types B7V for A component and B9V for the B component based on Tsvetkov et al. (2008) or Mamajek’s list121212http://www.pas.rochester.edu/emamajek/
EEM_dwarf_UBVIJHK_colors_Teff.txt (updated July 2015). Determined spectral types from brightnesses are in good accordance with types based on our found masses M⊙ (B8V) and M⊙ (B9V). The A component is more luminous than B component.
Information about brightness of the Ab component was not found in literature131313High brightness of Ab can influence significantly also Aa itself., the presence of Ab is considered only from the RV variations (SB1 binary) and thus, it can be only roughly estimated based on our findings. The CP star Aa is on the main sequence (hereafter MS) with deduced age yr (Kochukhov & Bagnulo 2006) or a bit more ( 2.45 – 3.3 yr, Sect. 5.3). The other components with lower mass should be also on the MS. Using its mass-limit M⊙ the star would be of spectral type F4V – F5V or earlier. It should be maximally about 3.5 mag fainter than Aa component (Mamajek web page).
Masses based on HR diagram bring the same spectral types M⊙ (B8V), M⊙ (B9V – A0V), with difference only for Ab component M⊙ (A4V) and its lower difference in brightness mag. Instruments with high angular resolution (angular projection of corresponding to 2.6 mas141414Maximal distance between Aa and Ab components should be about 11 mas.) can separate the Ab component from the Aa component and confirm our estimations.
5.3 HR diagram
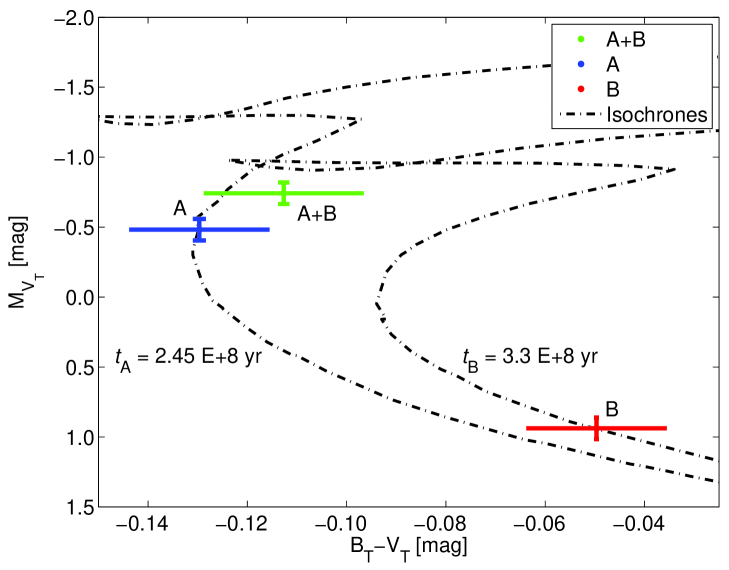
Measurements from Hipparcos satellite (parallax, and two-colour photometry from Tycho instrument) were utilized for construction of HR diagram. We adopted information about brightnesses of A and B components of Dra from Fabricius & Makarov (2000), and corrected Hipparcos value of parallax from van Leeuwen (2007). The absolute magnitudes and colour indexes were corrected for interstellar extinction mag (Malkov et al. 2012) using approach described in Kallrath & Milone (2009). Location of both components of Dra in HR diagram is based on Table 7. They belong among high luminous stars on the MS and only small detail of HR diagram in their vicinity is displayed in Fig. 10. Brighter A component is dominant and thus, it is close to the position, where is the object with total luminosity, as a whole system Dra. Fainter B component is cooler and probably less evolved star. HR diagram contains synthetic PARSEC isochrones (Bressan et al. 2012) which were generated according to the positions of A and B components in the diagram and with the assumption of solar metallicity. Both components lie on the different isochrones with time difference only yr ( yr, yr). Nevertheless, the selection of correct isochrone is high-dependent on the uncertainty in the colour of fainter component and the recorded distance between isochrones is low (B component is distant only about from A isochrone in ). Probability that two angularly close stars have almost the same age is too low, thus, we consider it as the possible evidence for the gravitational bond between A and B components.
| Component | A | B | A+B∗ |
|---|---|---|---|
| [mag] | |||
| [mag] | 0.94(8) | ||
| Parallax [mas] | 10.77(38) | ||
| Distance [pc] | 92.9(33) | ||
| [mag] | 0.123 | ||
Notes: (∗) Values for the whole system A+B were calculated from parameters for A and B components and from Pogson equation.
6 Summary and conclusions
We performed a complete analysis of the multiple stellar system Dra (expected hierarchy of the system is in Fig. 9) with focus on the inner binary system Aab. We disproved orbital elements from Abt & Snowden (1973), and utilizing 4 sources of RV measurements we found 128-day period and other orbital parameters which are close to results determined by Beardsley (1969).
The orbit of the outer visual binary system AB was solved three-times during history. We showed that orbital elements from Olevic (1975) and Olevic & Catovic (1990) do not describe new measurements. The latest solution from Andrade (2005) fits well all available relative position measurements and relative orbit of the binary. Nevertheless, these variations could be well explained using unbound binary star motion as was shown in Sect. 3.3. The current difference between bound and unbound models of motion B star relative to A is still small and thus unbound explanation cannot be completely ruled out. We attempted to find proofs for the bound binary hypothesis. The similarities in proper motions and the HR diagram, where A and B components lie on the almost same isochrone, we present as the most promising evidences.
We also discussed the last possible component C, but we present clear evidence that its gravitational bond is not real (e.g. different proper motions). In each case, its influence on the whole system is almost undetectable.
Visual orbit of the outer binary AB allowed us to determine the total mass of the triple system about 7.6 M⊙, nevertheless with respect to the older models of visual system and with the fact that only about half of the orbit have been finished from its discovery, the value must be accepted circumspectly. We adopted mass of Aa component M⊙ from literature and we obtained minimal Ab mass M⊙ from spectroscopic orbit. The rest of total mass remains on the B component with maximal mass M⊙.
The most probable isochrones in HR diagram predict the same mass of Aa component M⊙ and little different values for masses of other stars M⊙, and M⊙, which can be possible. These masses, together with the mass function obtained from the spectroscopic orbit, allow us to estimate the inclination of the Aab system orbital plane, .
Preliminary values of masses for individual components have been already determined. Unfortunately, authors used unreliable value of inner orbital period from Abt & Snowden (1973), thus their values are not actual: M⊙, M⊙, M⊙ (Docobo & Andrade 2006), or M⊙, M⊙, M⊙ (Tokovinin 2008)151515Tokovinin (2008) used older value of parallax 11.28(48) mas (ESA 1997). Therefore the total mass is only 6.12 M⊙..
Acknowledgements
This research has made use of NASA’s Astrophysics Data System, the Washington Double Star Catalog maintained at the U.S. Naval Observatory, the VizieR catalogue access tool and the SIMBAD database, operated at CDS, Strasbourg, France. I thank very much my colleagues, namely E. Paunzen, M. Prvák, J. Krtička, M. Zejda, Z. Mikulášek, and also the anonymous referee, who helped me to improve the manuscript. This work was supported by grants GA ČR 13-10589S, MUNI/A/1110/2014 and MUNI/A/1494/2014.
References
- Abt & Snowden (1973) Abt, H. A., & Snowden, M. S. 1973, ApJS, 25, 137
- Adelman (2002) Adelman, S. J. 2002, Baltic Astronomy, 11, 475
- Allende Prieto & Lambert (1999) Allende Prieto, A. C., & Lambert, D. L., 1999, A&A, 352, 555
- Andrade (2005) Andrade, M. 2005, IAUDS, 157, 1
- Beardsley (1969) Beardsley, W. R. 1969, PAllO, 8, 91
- Bressan et al. (2012) Bressan, A., Marigo, P., Girardi, L., et al. 2012, MNRAS, 427, 127
- Campbell & Moore (1928) Campbell, W. W., & Moore, J. H. 1928, PLicO, 16, 1
- Comstock (1896) Comstock, G. C. 1896, Publications of the Washburn Observatory, 10, A1
- Docobo & Andrade (2006) Docobo, J. A., & Andrade, M. 2006, ApJ, 652, 681
- Douglass et al. (2000) Douglass, G. G., Mason, B. D., Rafferty, T. J., et al. 2000, AJ, 119, 3071
- Ducati, Penteado & Turcati (2011) Ducati, J. R., Penteado, E. M., & Turcati, R. 2011, A&A, 525, 26
- ESA (1997) ESA 1997, The Hipparcos and Tycho Catalogs, SP–1200
- Fabricius & Makarov (2000) Fabricius, C., & Makarov, V. V. 2000, A&A, 356, 141
- Frost & Lee (1909) Frost, E. B., & Lee, O. J. 1909, ApJ, 30, 62
- Frost, Barrett & Struve (1929) Frost, E. B., Barrett, S. B., & Struve, O. 1929, PYerO, 7, 1
- Gray & Corbally (2014) Gray, R. O., & Corbally, C. J. 2014, AJ, 147, 80
- Harper (1937) Harper, W. E. 1937, PDAO, 7, 1
- Hartkopf et al. (2001) Hartkopf, W. I., McAlister, H. A., & Mason, B. D. 2001, AJ, 122, 3480
- Hnatek (1914) Hnatek, A. 1914, AN, 197, 185
- Irwin (1952) Irwin, J. B. 1952, ApJ, 116, 218
- Kallrath & Milone (2009) Kallrath, J., & Milone, E. F. 2009, Eclipsing Binary Stars: Modeling and Analysis: Astronomy and Astrophysics Library. ISBN 978-1-4419-0698-4. Springer-Verlag New York, 2009
- Kochukhov & Bagnulo (2006) Kochukhov, O., & Bagnulo, S. 2006, A&A, 450, 763
- Krtička et al. (2007) Krtička, J., Mikulášek, Z., Zverko, J., & Žižňovský, J. 2007, A&A, 470, 1089
- Krtička et al. (2009) Krtička, J., Mikulášek, Z., Henry, G. W., et al. 2009, A&A, 499, 567
- Kuiper (1961) Kuiper., G. P. 1961, ApJS, 6, 1
- Kukarkin et al. (1977) Kukarkin, B. V., Kholopov, P. N., Fedorovich, V. P., et al. 1977, Information Bulletin on Variable Stars, 1248, 1
- Kuschnig (1998) Kuschnig R., 1998, Surface Abundance Structures of Ap Stars, Ph.D. Thesis, Univ. of Vienna, Vienna, Austria
- Lenz & Breger (2005) Lenz, P., & Breger, M. 2005, Communications in Asteroseismology, 146, 53
- Malkov et al. (2012) Malkov, O. Y., Tamazian, V. S., Docobo, J. A., & Chulkov, D. A. 2012, A&A, 546, A69
- Mason et al. (2001) Mason, B. D., Wycoff, G. L., Hartkopf, W. I., Douglass, G. G., Worley, C. E. 2001, AJ, 122, 3466
- Maury & Pickering (1897) Maury, A. C., & Pickering, E. C. 1897, Annals of Harvard College Observatory, 28, 1
- Mikulášek (2007) Mikulášek, Z. 2007, Odessa Astronomical Publications, 20, 138
- Mikulášek & Zejda (2013) Mikulášek, Z., & Zejda, M. 2013, in Úvod do studia proměnných hvězd (Brno: Masaryk University)
- Mikulášek (2015) Mikulášek, Z. 2015, A&A, 584, A8
- Monet et al. (2003) Monet, D. G., Levine, S. E., Canzian, B., et al. 2003, AJ, 125, 984
- Moore (1932) Moore, J. H. 1932, Publications of Lick Observatory, 18, 1
- Muller (1978) Muller, P. 1978, A&AS, 33, 275
- Musielok et al. (1980) Musielok B., Lange, D., Schoenich, W., et al.1980, AN, 301, 71
- Olevic (1975) Olevic, D. 1975, BOBeo, 126, 49
- Olevic & Catovic (1990) Olevic, D., & Catovic, Z. 1990, IAUDS, 112, 1
- Pourbaix et al. (2004) Pourbaix, D., Tokovinin, A. A., Batten, A. H., et al. 2004, A&A, 424, 727
- Prvák et al. (2014) Prvák, M., Krtička, J., Mikulášek, Z., Lüftinger, T., & Liška, J. 2014, Putting A Stars into Context: Evolution, Environment, and Related Stars, 214
- Prvák et al. (2015) Prvák, M., Liška, J., Krtička, J., Mikulášek, Z., & Lüftinger, T. 2015, A&A, 584, A17
- Roeser et al. (2010) Roeser, S., Demleitner, M., & Schilbach, E. 2010, AJ, 139, 2440
- Rutkowski & Waniak (2005) Rutkowski, A., & Waniak, W. 2005, PASP, 117, 1362
- Schöneich & Hildebrandt (1976) Schöneich, W., & Hildebrandt G. 1976, Astron.Nachr., 297, 39
- Takeda et al. (1999) Takeda, Y., Takada-Hidai, M., Jugaku, J. et al. 1999, PASJ, 51, 961
- Tokovinin (2008) Tokovinin, A. 2008, MNRAS, 389, 925
- Tsvetkov et al. (2008) Tsvetkov, A. S., Popov, A. V., & Smirnov, A. A. 2008, Astronomy Letters, 34, 17
- van Biesbroeck (1974) van Biesbroeck, G. 1974, ApJS, 28, 413
- Van Hamme & Wilson (2007) Van Hamme, W., & Wilson, R. E. 2007, ApJ, 661, 1129
- van Leeuwen (2007) van Leeuwen, F. 2007, A&A, 474, 653
- Wenger et al. (2000) Wenger, M., Ochsenbein, F., Egret, D., et al. 2000, A&AS, 143, 9
- Winzer (1974) Winzer, J. E. 1974, The Photometric Variability of the Peculiar A Stars, Ph.D. Thesis, Univ. of Toronto, Toronto, Canada
- Worley (1962) Worley, C. E. 1962, AJ, 67, 403
- Worley & Heintz (1983) Worley, C. E., & Heintz, W. D. 1983, Publications of the U.S. Naval Observatory Second Series, 24, 1
- Zacharias et al. (2012) Zacharias, N., Finch, C. T., Girard, T. M., et al. 2012, VizieR Online Data Catalog, 1322, 0
- Zacharias et al. (2013) Zacharias, N., Finch, C. T., Girard, T. M., et al. 2013, AJ, 145, 44