Ly and CIII] Emission in Galaxies: Accelerated Reionization Around Luminous Star Forming Systems?
Abstract
We discuss new Keck/MOSFIRE spectroscopic observations of four luminous galaxies at selected to have intense rest-frame optical line emission by Roberts-Borsani et al. (2016). Previous spectroscopic follow-up has revealed Ly emission in two of the four galaxies. Our new MOSFIRE observations confirm that Ly is present in the entire sample. We detect Ly emission in the galaxy COS-zs7-1, confirming its redshift as , and we detect Ly in EGS-zs8-2 at , verifying a tentative detection presented in an earlier study. The ubiquity of Ly emission in this unique photometric sample is puzzling given that the IGM is expected to be significantly neutral over . To investigate this surprising result in more detail, we have initiated a campaign to target UV metal line emission in the four Ly emitters as a probe of both the ionizing radiation field and the velocity offset of Ly at early times. Here we present the detection of very large equivalent width [CIII], CIII] 1907,1909 Å emission in EGS-zs8-1 (W Å), a galaxy from this sample previously shown to have Ly emission at . Photoionization models indicate that an intense radiation field (log10 [erg-1 Hz]) and moderately low metallicity (0.11 Z⊙) are required to reproduce the CIII] line emission and intense optical line emission implied by the broadband SED. We argue that this extreme radiation field is likely to affect the local environment, increasing the transmission of Ly through the galaxy. Moreover, the centroid of CIII] emission indicates that Ly is redshifted from the systemic value by 340 km sec-1. This velocity offset is larger than that seen in less luminous systems and provides an additional explanation for the transmission of Ly emission through the intergalactic medium. Since the transmission is further enhanced by the likelihood that such systems are also situated in the densest regions with accelerated evolution and the largest ionized bubbles, the visibility of Ly at is expected to be strongly luminosity-dependent, with the most effective transmission occurring in systems with intense star formation.
keywords:
cosmology: observations - galaxies: evolution - galaxies: formation - galaxies: high-redshift1 Introduction
The reionization of intergalactic hydrogen is an important milestone in early cosmic history, marking the point at which nearly every baryon in the universe was affected by the growth of structure. How and when reionization occurs encodes unique insight into the nature of the first luminous objects, motivating a number of dedicated observational efforts aimed at studying the process. Significant progress has been made in the last decade. Measurement of the optical depth to electron scattering faced by the CMB reveals that the process is underway by (Planck Collaboration et al., 2015, 2016), while quasar absorption spectra indicate that reionization is largely complete by (e.g., Fan et al. 2006; McGreer et al. 2015). The large abundance of faint galaxies identified photometrically with the WFC3/IR camera on the Hubble Space Telescope (e.g., McLure et al. 2013; Bouwens et al. 2015b; Finkelstein et al. 2015) suggests that the ionizing output of star forming systems may be sufficient to complete reionization by while also supplying the IGM with enough free electrons at to reproduce the measured Thomson scattering optical depth of the CMB (Robertson et al., 2015; Bouwens et al., 2015a; Stanway et al., 2016).
New insight is now being provided by spectroscopic surveys targeting Ly emission from star forming galaxies at . Since Ly is resonantly scattered by neutral hydrogen, the fraction of galaxies that exhibit prominent Ly emission should fall abruptly during the reionization era (Fontana et al., 2010; Stark et al., 2010). Throughout the past five years, a large investment has been devoted to searches for Ly emission in the reionization era, resulting in only nine robust detections of Ly at (Vanzella et al., 2011; Ono et al., 2012; Schenker et al., 2012; Shibuya et al., 2012; Finkelstein et al., 2013; Oesch et al., 2015; Zitrin et al., 2015; Song et al., 2016). These surveys clearly reveal a rapidly declining Ly emitter fraction over (e.g., Stark et al. 2010; Fontana et al. 2010; Ono et al. 2012; Pentericci et al. 2014; Tilvi et al. 2014; Schenker et al. 2014), similar to the drop in the abundance of narrowband-selected Ly emitters over (e.g. Konno et al. 2014). The decline in the volume density of Ly emitters at is consistent with strong attenuation from intergalactic hydrogen, possibly requiring neutral fractions of x at (Mesinger et al., 2015; Choudhury et al., 2015). In this framework, the small sample of known systems with detectable Ly emission is thought to be galaxies that are situated in the largest ionized regions of the IGM, allowing Ly to redshift well into the damping wing before encountering intergalactic hydrogen.
The first clues that this physical picture may be incomplete have recently begun to emerge. The detection of nebular CIV emission in a low luminosity Ly emitter (A1703-zd6) led Stark et al. (2015b) to speculate that this galaxy’s hard ionizing spectrum may enhance its Ly transmission by efficiently ionizing surrounding hydrogen. If true, this would suggest that observed counts of Ly emitters may also depend on the prevalence of galaxies with extreme radiation fields, adding uncertainty to the modeling of the evolving Ly transmission at . Observational efforts are now underway to establish how common such hard ionizing spectra are among reionization-era galaxies and to constrain the powering mechanism (AGN or metal poor stars) of the nebular CIV emission (e.g., Feltre et al. 2016).
Perhaps even more puzzling is the discovery of Ly in the first two galaxies observed from a recent selection of the most luminous galaxies in the CANDELS fields (Roberts-Borsani et al., 2016), including record-breaking detections at (Oesch et al., 2015) and (Zitrin et al., 2015). The Roberts-Borsani et al. (2016) (hereafter RB16) photometric sample includes a total of four galaxies, each very bright in WFC3/IR imaging (H) with very red Spitzer/IRAC [3.6]-[4.5] colors, indicating extremely large equivalent width [OIII]+H emission. How Ly emission is able to escape efficiently from these systems while being so strongly attenuated from most other early galaxies is unclear. One possibility is that the most luminous galaxies trace overdense regions which produce the largest ionized bubbles at any given redshift (e.g., Barkana & Loeb 2004; Furlanetto et al. 2004). Zitrin et al. (2015) speculated that the selection of galaxies with red IRAC colors may pick out systems with hard ionizing spectra which are able to create early ionized bubbles, enhancing the transmission of Ly through the IGM.
With the aim of improving our understanding of the factors which are most important in regulating the escape of Ly at , we have recently initiated a comprehensive spectroscopic survey of Ly and UV metal emission lines in the full photometric sample of galaxies identified in Roberts-Borsani et al. (2016). Our goals are twofold. Firstly, we seek a complete census of the Ly emission equivalent widths. Thus far, only two of the four RB16 galaxies have been spectroscopically confirmed. A third system (EGS-zs8-2) was found to have a tentative Ly emission feature at in Roberts-Borsani et al. (2016), and the fourth system (COSY-0237620370, hereafter COS-zs7-1) has yet to be observed. Second, we aim to use knowledge of the UV metal emission line properties to understand the evolving visibility of Ly emission at . In particular, we wish to characterize the hardness of the ionizing spectrum, determining if the RB16 galaxies are similar to the nebular CIV emitting galaxy reported in Stark et al. (2015b). Using the systemic redshift provided by the [CIII], CIII]1907,1909 doublet, we will investigate the velocity offset of Ly in the RB16 sample, one of the most important parameters governing the IGM attenuation provided to Ly in the reionization era.
We adopt a -dominated, flat Universe with , and . All magnitudes in this paper are quoted in the AB system (Oke & Gunn, 1983).
2 Keck/MOSFIRE Observations and Analysis
We present new observations of three of the four galaxies identified in Roberts-Borsani et al. (2016). Data were obtained over three separate observing runs using the near-infrared multi-object spectrograph MOSFIRE (McLean et al., 2012) on the Keck I telescope. Details of the MOSFIRE observations are summarized in Table 1. The first observing run was 12-15 April 2015. We observed EGS-zs8-2 in the Y-band, targeting the tentative Ly detection reported in Roberts-Borsani et al. (2016). The seeing was between 05 and 08 and skies were clear in 4.0 hours of integration. The integration time of individual Y-band exposures was 180 seconds. Both EGS-zs8-1 and EGS-zs8-2 were then observed in the H-band to constrain the strength of the [CIII],CIII]1907,1909 doublet. Conditions were mostly clear and seeing was 05 during the 2.5 hours of on-source integration. On 11 June 2015, we obtained an additional 1.0 hr of H-band observations on EGS-zs8-1 and EGS-zs8-2 in clear conditions with average seeing of 06, bringing the total H-band integration time to 3.5 hrs. The individual H-band exposures are 120 seconds. Finally, on 30 November 2015, we obtained a Y-band spectrum of COS-zs7-1. Conditions were clear and the average seeing was 07. We obtained 48 exposures of 180 seconds, totaling 2.4 hours of on-source Y-band integration on COS-zs7-1. Each mask contained 1-2 isolated stars for absolute flux calibration and numerous lower redshift galaxies. We used slit widths of 07 on all three observing runs.
The publicly-available MOSFIRE Data Reduction Pipeline (DRP)***https://keck-datareductionpipelines.github.io/MosfireDRP/ was used to reduce the spectra. The DRP performs flat-fielding, wavelength calibration, sky-subtraction, and cosmic ray removal, outputting reduced two dimensional spectra. For our chosen slit width, MOSFIRE provides a resolving power of (Y-band) and (H-band), delivering a resolution of 2.82 Å and 2.74 Å in Y and H-band, respectively, for slit widths of 07. Using the output from the DRP, we calculated two-dimensional signal to noise maps for each object. One-dimensional spectra were then obtained using a boxcar extraction with apertures matched to the object profile, typically in the range 6-8 pixels (108 - 144). The flux calibration was performed in two stages. We determined the telluric correction spectrum via longslit observations of a spectrophotometric standard star conducted prior to the observations. The resulting correction spectrum accounts for the effects of the atmosphere and the instrumental response. The absolute flux scale is calculated using the spectra of stars that were placed on the mask. Using the HST flux measurments of the stars, we calculate the average scaling factor necessary to convert the observed count rate into flux density. The absolute scaling factor is applied to the telluric correction spectrum, resulting in a wavelength-dependent flux calibration which we apply to the 1D-extracted spectra. If the sources are more extended than the stars used for the flux calibration, a small aperture correction will be required to account for slit losses. We calculate the aperture correction individually for each source by convolving the HST images with the ground-based seeing. Given the very small sizes of the galaxies, these corrections are found to be negligible for the sources considered in this paper.
| Source | zLyα | zphot | RA | DEC | Date of Observations | H160 | Filters | UV lines targeted | Ref |
|---|---|---|---|---|---|---|---|---|---|
| EGS-zs8-1 | 7.730 | 7.92 | 14:20:34.89 | +53:00:15.4 | 12-15 Apr 2015 | 25.0 | H | CIII] | [1], [2] |
| … | … | … | … | … | 11 June 2015 | … | H | CIII] | [1], [2] |
| EGS-zs8-2 | 7.477 | 7.61 | 14:20:12.09 | +53:00:27.0 | 12-15 Apr 2015 | 25.1 | Y, H | Ly, CIII] | [1] |
| … | … | … | … | … | 11 June 2015 | … | H | CIII] | [1] |
| COS-zs7-1 | 7.154 | 7.14 | 10:00:23.76 | +02:20:37.0 | 30 Nov 2015 | 25.1 | Y | Ly | [1] |
3 Results
3.1 EGS-zs8-1
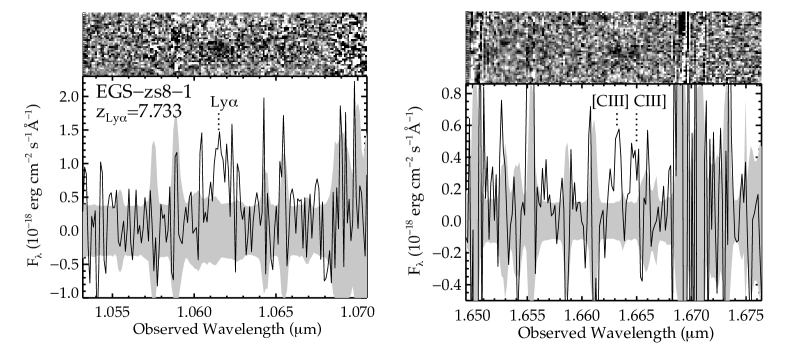
EGS-zs8-1 is a bright (H160=25.0) galaxy with a red IRAC color ([3.6]-[4.5]=). As described in Roberts-Borsani et al. (2016), the 4.5m flux excess suggests very large rest-frame equivalent width (Å) [OIII]+H emission. The optical line equivalent widths quoted here and below are inferred through computation of the line flux required to produce the measured IRAC flux excess, in the same manner as earlier studies (Shim et al., 2011; Stark et al., 2013; Smit et al., 2014, 2015a; Roberts-Borsani et al., 2016), The spectroscopic redshift was confirmed by Oesch et al. (2015) through detection of a strong Ly emission line using MOSFIRE (see Figure 1a). The line reaches peak flux at 10616 Å corresponding to . Oesch et al. (2015) fit a truncated Gaussian profile to the data and calculate a redshift of . Since the true line profile is very uncertain, we will adopt the redshift set by the peak line flux for our analysis. As we detail below, the result does not strongly impact our conclusions. The Ly line flux (1.710-17 erg cm-2 s-1) is one of the largest among galaxies and suggests a rest-frame equivalent width of W Å. The absolute magnitude (M indicates an unusually luminous galaxy, roughly 3 brighter than the value of L derived from the Schechter parameter fitting functions presented in Bouwens et al. (2015b).
The MOSFIRE H-band spectrum of EGS-zs8-1 covers the wavelength range between 1.5154 m and 1.8223 m. In Figure 1b, the narrow spectral window between 1.650 and 1.675m is shown, revealing a clean detection of both components of the [CIII], CIII] doublet. We measure line fluxes of erg cm-2 s-1 and erg cm-2 s-1 for the 1907 and 1909 Å components, respectively. The total flux in the resolved CIII] doublet is close to 50% that of Ly, nearly 10 greater than is seen in the most extreme CIII] emitting galaxies at lower redshift (e.g., Erb et al. 2010; Christensen et al. 2012; Stark et al. 2014). Since the continuum is undetected in the spectrum, we calculate the rest-frame equivalent widths using continuum flux derived from the broadband SED. The measurements indicate a total [CIII], CIII] rest-frame equivalent width of Å ( Å for [CIII]1907 and Å for CIII]1909), similar to the value recently derived in a gravitationally-lensed galaxy at (Stark et al., 2015a).
The flux ratio of the [CIII],CIII] doublet provides a measurement of the electron density of the ionized gas. The ratio of [CIII]1907/CIII]1909 varies from for ne=3104 cm-3 to 1.5 for ne=102 cm-3. The measured [CIII]1907/CIII]1909 flux ratio of EGS-zs8-1 () suggests that CIII] traces reasonably high density gas. The electron density of the system is determined by using IRAF’s NEBULAR package (Shaw & Dufour 1995). Assuming an electron temperature of 15,000 K, consistent with metal poor CIII] emitting galaxies at lower redshifts (e.g., Erb et al. 2010; Christensen et al. 2012, Mainali et al. 2016 in prep), we infer an electron density of 9100 cm-3 for EGS-zs8-1. The error bars on the measurement are calculated by including 1 error in the flux ratio as well as varying the electron temperature between 12,600 K and 20,000 K. While uncertainties are clearly still significant, the CIII] density is noticeably larger than the average density (250 cm-3) traced by [OII] or [SII] at (Sanders et al., 2016). The tendency for CIII] to imply larger densities than [OII] and [SII] is well known (e.g., James et al. 2014, Mainali et al. 2016, in prep) and may indicate that the higher ionization line tends to be produced in denser regions within the galaxy. Larger samples with multiple density diagnostics are required at lower redshift to assess whether the CIII] density offset is actually physical.
The detection of CIII] also constrains the systemic redshift (e.g., Erb et al. 2010; Stark et al. 2014), providing a valuable measure of the velocity offset of Ly, . The Ly velocity offset is a key input parameter for models which seek to map the evolving number counts of Ly emitters to IGM ionization state (e.g., Choudhury et al. 2015). Yet owing to the lack of strong nebular lines in reionization-era galaxies, there are currently only a handful of measurements at (Willott et al., 2015; Stark et al., 2015a). The wavelength centroids of the [CIII], CIII] doublet in EGS-zs8-1 reveal a systemic redshift of 7.723. The peak of the emergent Ly emission line occurs at 10616 Å, implying a velocity offset of =340 km s-1. The FWHM of the Ly line (360 km s-1; Oesch et al. 2015) thus indicates that a substantial fraction of the Ly flux leaves the galaxy between 340 km s-1 and 520 km s-1. We note that if we were to adopt the truncated gaussian redshift for Ly, the inferred velocity offset would be somewhat smaller (260 km s-1), but more importantly, the line profile still would imply a significant amount of flux emerging at yet larger velocities. The mean velocity offset of EGS-zs8-1 is comparable to the two measurements presented in Willott et al. (2015) but is considerably larger than that inferred in a robustly-detected CIII] emitter at (Stark et al., 2015a) and well in excess of the parameterization adopted in the reionization models of Choudhury et al. (2015). We discuss the implications of these findings for reionization in §5.2.
| Source | zLyα | Line | Line Flux | W0 | H160 | W[OIII]+Hβ | Ref | ||
| (Å) | (Å) | (10-18 erg cm-2 s-1) | (Å) | (Å) | |||||
| EGS-zs8-1 | 7.730 | Ly | 1215.67 | 10616 | 25.0 | [1] | |||
| 1906.68 | 16630 | … | … | This work | |||||
| 1908.73 | 16645 | … | … | This work | |||||
| EGS-zs8-2 | 7.477 | Ly | 1215.67 | 10305 | 25.1 | [2], This work | |||
| 1906.68 | — | 2.3(3) | 7.1(3) | … | … | This work | |||
| 1908.73 | — | 2.3 (3) | 7.1(3) | … | … | This work | |||
| COS-zs7-1 | 7.154 | Ly | 1215.67 | 9913 | 25.1 | This work | |||
| EGS8p7 | 8.683 | Ly | 1215.67 | 11774 | 17 | 28 | 25.3 | [3] | |
| z7_GSD_3811 | 7.664 | Ly | 1215.67 | 10532 | 15.6 | 25.9 | — | [4] | |
| z8_GND_5296 | 7.508 | Ly | 1215.67 | 10343 | 25.6 | [5] | |||
| … | 7.508 | Ly | 1215.67 | 10347 | … | … | [6] | ||
| SXDF-NB1006-2 | 7.215 | Ly | 1215.67 | 9988 | 19 | 15.4 | — | — | [7] |
| GN-108036 | 7.213 | Ly | 1215.67 | 9980 | 25 | 33 | 25.2 (F140W) | [8] | |
| A1703_zd6 | 7.045 | Ly | 1215.67 | 9780 | 25.9 | — | [9] | ||
| CIV | 1548.19 | 12458 | … | — | [10] | ||||
| BDF-3299 | 7.109 | Ly | 1215.67 | 9858 | 50 | 26.2 | — | [11] | |
| BDF-521 | 7.008 | Ly | 1215.67 | 9735 | 64 | 25.9 | — | [11] |
3.2 EGS-zs8-2
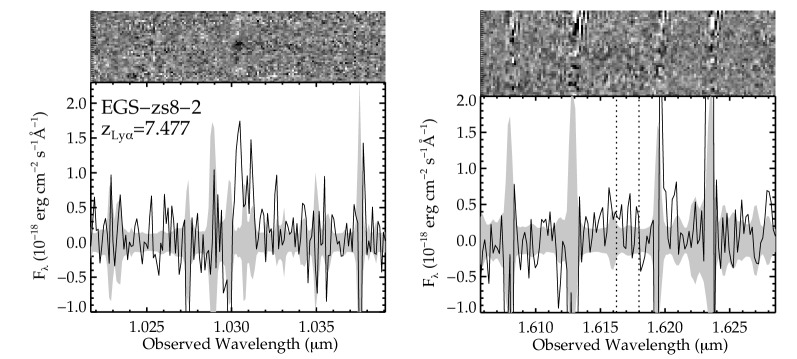
EGS-zs8-2 is another bright (H160=25.1) galaxy identified in CANDELS imaging by RB16. The IRAC color of EGS-zs8-2 ([3.6]-[4.5]=) is redder than EGS-zs8-1, likely reflecting yet more extreme optical line emission. We estimate a rest-frame [OIII]+H equivalent width of Å is required to reproduce the flux excess in the [4.5] filter. A 4.7 emission feature was identified by Roberts-Borsani et al. (2016) at a wavelength of 1.031m. RB16 tentatively interpret this feature as Ly.
We obtained a Y-band spectrum of EGS-zs8-2 with the goal of verifying the putative Ly detection. The spectrum we obtained shows a 7.4 emission line at 1.0305 m (Figure 2a), confirming that EGS-zs8-2 is indeed a Ly emitter at z. The measured line flux ( erg cm-2 s-1) is less than half that of EGS-zs8-1. We calculate the Ly equivalent width using the broadband SED to estimate the underlying continuum flux. The resulting value (WLyα= Å) is the smallest of the RB16 galaxies.
The MOSFIRE H-band spectrum covers 14587 to 17914 Å, corresponding to rest-frame wavelengths between 1720 and 2113 Å for EGS-zs8-2. In Figure 2b, we show the spectral window centered on the [CIII], CIII] doublet. No emission lines are visible. There are two weak sky lines in the wavelength range over which the doublet is situated. However the separation of the individual components of the doublet is such that at least one of the two lines must be located in a clean region of the spectrum. We estimate 3 upper limits of 2.310-18 erg cm-2 s-1 for individual components. The non-detection suggests that the total flux in the CIII] doublet must be less than 62% of the observed Ly flux, fully consistent with the ratio observed in EGS-zs8-1 and in extreme CIII] emitters at lower redshift. We place a 3 upper limit on the doublet rest-frame equivalent width of 14 Å. Deeper data may yet detect CIII] in EGS-zs8-2.
3.3 COS-zs7-1
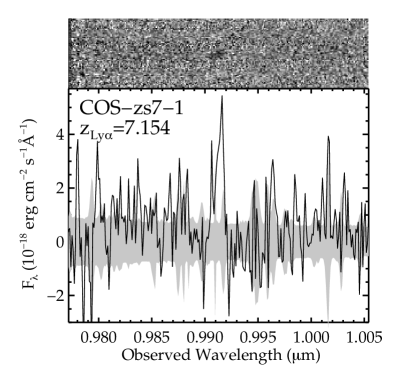
Prior to this paper, COS-zs7-1 was the only source from Roberts-Borsani et al. (2016) lacking a near-infrared spectrum. Similar to the other galaxies from RB16, COS-zs7-1 is bright in the near-infrared (H160=25.1) and has IRAC color ([3.6]-[4.5]=) that indicates intense optical line emission. In addition to RB16, the galaxy has been reported elsehwere (e.g., Tilvi et al. 2013; Bowler et al. 2014). We estimate an [OIII]+H rest-frame equivalent width of Å based on the [4.5] flux excess, making COS-zs7-1 the most extreme optical line emitter in the RB16 sample. RB16 derive a reasonably well-constrained photometric redshift (zphot=7.14) that places Ly in a narrow 290 Å window between 9750 and 10041 Å.
The Keck/MOSFIRE Y-band spectrum spans between 9750 Å and 11238 Å, covering the full range over which Ly is predicted to lie. We identify a 6.25 emission line at 9913 Å that is coincident with the expected spatial position of COS-zs7-1 (Figure 3). The emission line is seen to have the standard negative - positive - negative pattern, indicating that it is present in both dither positions. If the feature is Ly, it would correspond to , in excellent agreement with the photometric redshift derived by RB16. No other emission lines are visible at the spatial position of COS-zs7-1 in the Y-band spectrum. We conclude that Ly is the most likely interpretation of the line given the pronounced dropout in the -band and the evidence for strong [OIII]+H emission in the [4.5] filter. The emission line is clearly distinct from sky lines with emission spanning 9905-9915 Å; however the red side of the line coincides with positive residuals from a weak OH line at 9917 Å, complicating the line flux measurement. Integrating the emission line blueward of the OH line, we find a total flux of 10-17 erg cm-2 s-1 and a rest-frame Ly equivalent width of Å.
Table 2 summarizes the various emission line measures and the related physical properties for all three sources in the context of earlier work.
4 Photoionization Modeling
The broadband SEDs of the RB16 galaxies suggest the presence of extremely large equivalent width [OIII]+H emission. Here we investigate whether the available data require an intense radiation field that may favor the escape of Ly. In the case, of EGS-zs8-1 and EGS-zs8-2, we fold in the new constraints on [CIII], CIII] emission. We focus our analysis on the three galaxies from RB16 for which we have obtained new spectral constraints (COS-zs7-1, EGS-zs8-1, EGS-zs8-2). We fit the available emission-line and broadband fluxes using the Bayesian spectral interpretation tool BEAGLE (Chevallard & Charlot, 2016), which incorporates in a flexible and consistent way the production of radiation in galaxies and its transfer through the interstellar and intergalactic media. The version of BEAGLE used here relies on the models of Gutkin et al. (in preparation), who follow the prescription of Charlot & Longhetti (2001) to describe the emission from stars and the interstellar gas, based on a combination of the latest version of the Bruzual & Charlot (2003) stellar population synthesis model with the standard photoionization code CLOUDY (Ferland et al., 2013). The main adjustable parameters of the photoionized gas are the interstellar metallicity, , the typical ionization parameter of newly ionized H ii regions, (which characterizes the ratio of ionizing-photon to gas densities at the edge of the Stroemgren sphere), and the dust-to-metal mass ratio, (which characterizes the depletion of metals on to dust grains). We consider here models with hydrogen density , and two values of C/O abundance ratios, equal to 1.0 and 0.5 times the standard value in nearby galaxies [. Attenuation by dust is described using the 2-component model of Charlot & Fall (2000), combined with the Chevallard et al. (2013) ‘quasi-universal’ prescription to account for the effects linked to dust/star geometry (including ISM clumpiness) and galaxy inclination. Finally, we adopt the prescription of Inoue et al. (2014) to include absorption by the IGM.
We parametrize the star formation histories of model galaxies in BEAGLE as exponentially delayed functions , for star formation timescale in the range and formation redshift in the range (where is the observed galaxy redshift). We adopt a standard Chabrier (2003) initial mass function and assume that all stars in a given galaxy have the same metallicity, in the range . We superpose on this smooth exponential function a current burst with a fixed duration 10 Myr, whose strength is parametrized in terms of the specific star formation rate, in the range . We adopt the same interstellar and stellar metallicity () and let the dust-to-metal mass ratio and ionization parameter freely vary in the range and , respectively. We consider -band dust attenuation optical depths in the range and fix the fraction of this arising from dust in the diffuse ISM rather than in giant molecular clouds to (Wild et al., 2011).
With this parametrization, we use BEAGLE to fit the available constraints on the Ly equivalent width (taken as a lower limit owing to resonant scattering), [C iii]+C iii] equivalent width (for EGS-zs8-1 and EGS-zs8-2), and broadband F125W, F140W, F160W and IRAC 3.6 m and 4.5 m fluxes. We obtain as output the posterior probability distributions of the above free model parameters, as well as those of a large collection of derived parameters, such as for example the production rate of hydrogen ionizing photons per 1500 Å luminosity, (Table 3). The values correspond to the intrinsic UV emission from the stellar population model that reproduces the data, computed before reprocessing by gas and before attenuation by dust. Below we also present , which is computed considering the UV emission after it has been reprocessed by gas and attenuated by dust. This latter quantity provides the total Lyman continuum production rate given the observed far-UV emission.
| ID | Z | log10 [erg] | [C/O] | ||||
|---|---|---|---|---|---|---|---|
| EGS-zs8-1 | -7.66 | 0.01 | -1.61 | 1.7 | 25.59 | 0.28 | 0.52 |
| EGS-zs8-2 | -7.61 | 0.02 | -2.26 | 2.6 | 25.58 | 0.23 | 1.00 |
| COS-zs7-1 | -8.14 | 0.01 | -2.16 | 1.6 | 25.58 | 0.27 | 1.00 |
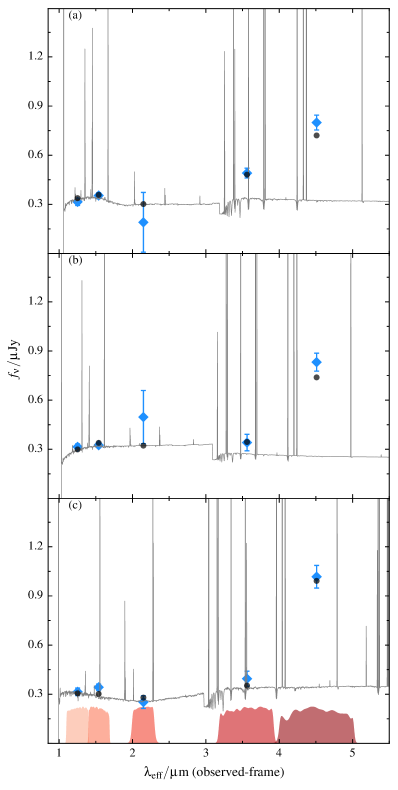
The modeling procedure is able to successfully reproduce the broadband SEDs of the Roberts-Borsani et al. (2016) galaxies (i.e., Figure 4). Matching the large flux excess in the IRAC [4.5] filter requires models with very large specific star formation rates (7-24 Gyr-1), indicating a population undergoing rapid stellar mass growth. The implied interstellar metallicities are in the range Z=0.0016-0.0026, which is equivalent to 0.10-0.17 Z⊙ using the solar metallicity value (Z⊙=0.01524) from Bressan et al. (2012). The strong [CIII], CIII] emission in EGS-zs8-1 forces the models to low metallicity (0.11 Z⊙) and significantly reduces the allowable metallicity range. Because of the depletion of metals onto dust grains (parameterized by the parameter) the gas-phase metallicity will be lower than the total interstellar metallicity that is fit by the models and reported in Table 3. After accounting for the derived values using the method described in Gutkin et al. (2016, in prep), the gas-phase oxygen abundance is found to range between 12+log O/H = 7.76, 7.77, 7.97 for COS-zs7-1, EGS-zs8-1, EGS-zs8-2, respectively. The detection of [CIII], CIII] in the spectrum of EGS-zs8-1 allows us to consider variations in the C/O abundance ratio. We fit the broad-band fluxes and emission lines equivalent widths with the two different set of models corresponding to C/O⊙, and 0.52 C/O⊙. A visual analysis of the maximum-a-posteriori SED, and a comparison of the Bayesian evidence obtained with the two settings, indicates a slight preference of the model corresponding to 0.52 C/O⊙, which exhibits a (marginally) larger sSFR, and a lower metallicity than the model with Solar-scaled C/O. The values reported in Table 3 thus correspond to the sub-Solar C/O models.
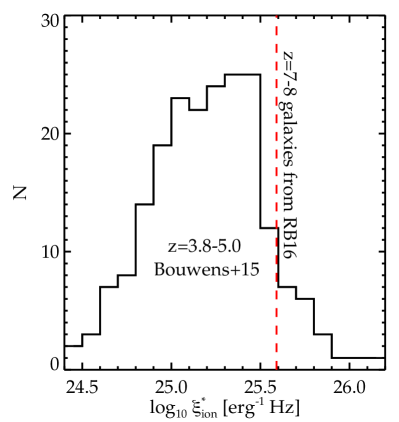
As expected for galaxies dominated by such young and sub-solar stellar populations, the models suggest very large Lyman continuum photon production efficiencies, log10 [erg, indicating that these galaxies have intense radiation fields. The values are larger than canonical values commonly used in reionization calculations (e.g. Kuhlen & Faucher-Giguère 2012; Robertson et al. 2015; Bouwens et al. 2015a), and are also larger than the average ionizing photon production efficiencies (log10 [erg-1 Hz] = 25.3) recently derived in Bouwens et al. (2015c) for galaxies at (Figure 5) and the average values derived at (log10 [erg-1 Hz] = 24.77) by Matthee et al. (2016). If the extreme optical line emission of the RB16 galaxies is typical at , it would indicate that reionization-era systems likely have considerably larger values than previously thought, easing requirements on the escape fraction of ionizing radiation (e.g. Robertson et al. 2015; Bouwens et al. 2015a). The estimated values of are in the range log10 [erg-1 Hz] = 25.60 and 25.73 for the three galaxies, larger than because of the effect of dust attenuation which lowers the observed UV flux density.
5 High Fraction of Ly Emission at : A New Population?
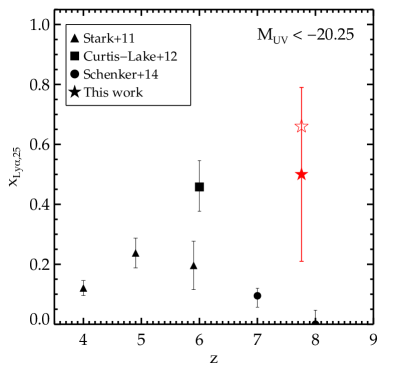
The detection of Ly in COS-zs7-1 and EGS-zs8-2 establishes that all four of the galaxies identified in RB16 exhibit Ly in emission, in spite of being situated at redshifts where the IGM is expected to be partially neutral. Of the four Ly emitters, two have W Å, implying a large Ly fraction (x with W Å). We search previous spectroscopic studies (e.g., Ono et al. 2012; Schenker et al. 2012; Finkelstein et al. 2013; Schenker et al. 2014; Pentericci et al. 2014) for galaxies with photometric redshifts above that are both luminous (M) and have IRAC fluxes indicative of intense [OIII]+H emission in the 4.5m filter (). Only two sources satisfy these requirements (most systems are either too faint or lack IRAC photometry), a galaxy reported in Finkelstein et al. (2013) and a galaxy confirmed in Ono et al. (2012). Both show Ly emission, but only the emitter has a rest-frame equivalent width in excess of 25 Å. †††Tilvi et al. (2016) have recently presented detection of Ly in the galaxy with the WFC3/IR grism as part of the FIGS survey (Malhotra et al. 2016, in prep). The measured Ly flux (1.0610-17 erg cm-2 s-1) and rest-frame equivalent width (46.9 Å) are both larger than in the MOSFIRE discovery spectrum reported in Finkelstein et al. (2013). With the WFC3/IR grism measurement, the implied Ly emitter fraction is larger yet: x. Together with the RB16 sample, this implies a high Ly fraction (x with W Å). Although this conclusion appears at odds with previous studies at (Figure 6), the average UV luminosity of the six galaxies with Ly emission (M) is larger than that of the galaxies in the luminous bin of the Schenker et al. (2014) measurements, possibly indicating that Ly transmission may be enhanced in these ultra-luminous systems.
The detection of UV metal lines allows us to begin exploring the precise physical mechanisms by which Ly is able to escape so effectively from the luminous RB16 galaxies. In §5.1, we consider whether the pre-selection of galaxies with IRAC [4.5] flux excesses is likely to influence the Ly detection rate, and in §5.2, we use the systemic redshift provided by [CIII], CIII] to explore whether the Ly velocity offsets of luminous galaxies boost the transmission of Ly through the IGM. We will argue that the selection of galaxies with IRAC color excess maximizes the production rate and transmission of Ly through the local circumgalactic medium, while the identification of the brightest galaxies picks out sources which are most likely to transmit Ly through the IGM.
5.1 Impact of local radiation field on Ly equivalent widths
The IRAC 4.5m flux excesses of the RB16 sample are suggestive of extreme optical line emission. Photoionization models indicate that the data require very large specific star formation rates, moderately low metallicity, and large (Table 3), suggesting efficient LyC production rates. The distribution of neutral hydrogen in the circumgalactic medium could be very different in such young, rapidly growing systems. Conceivably both the intense radiation field and enhanced stellar feedback of the RB16 galaxies could disrupt the surrounding distribution of gas, reducing the covering fraction of neutral hydrogen and boosting the transmission of Ly. If the escape fraction of Ly through the galaxy is indeed related to the specific star formation rate and , we should detect evidence of a larger Ly emitter fraction in extreme optical line emitters located just after reionization ().
To test the connection between Ly and , we investigate the Ly equivalent width distribution in a large sample of galaxies described in our earlier work (Stark et al., 2010, 2011, 2013). Redshifts were obtained via a large survey of UV-selected dropouts in GOODS-N using DEIMOS on Keck II (for details see Stark et al. 2010) and through a VLT/FORS survey described in by Vanzella et al. (2009). Our goal is to determine whether Ly equivalent widths tend to be enhanced in the subset of galaxies with extreme optical line emission. At , it is possible to characterize rest-optical line emission using a similar IRAC flux excess technique as employed by RB16. In this redshift range, the H line is situated in the IRAC [3.6] filter, while the [4.5] band is free of strong emission lines (e.g. Shim et al. 2011; Stark et al. 2013). While not identical to the RB16 selection (which identifies [OIII]+H emission), the subset of galaxies with extreme H emission is similar in nature to those with extreme [OIII]+H emission (Schenker et al., 2013).
In Stark et al. (2013), we measured H equivalent widths for a sample of spectroscopically confirmed galaxies at . Tang et al. (2016, in preparation) provide updated H equivalent width measurements for the sample with spectroscopic constraints (including galaxies with and without redshift confirmations), making use of new high S/N near-infrared photometry from CANDELS and improved IRAC flux measurements, both extracted from catalogs provided in Skelton et al. (2014). Using this new catalog of H measurements, we select those galaxies with IRAC [3.6] flux excesses indicative of H+[NII]+[SII] rest-frame equivalent widths in excess of 600 Å. This value is chosen by converting the [OIII]+H threshold of the Roberts-Borsani et al. (2016) selection (W[OIII]+Hβ=900 Å) to an H+[NII]+[SII] equivalent width using the Anders & Fritze-v. Alvensleben (2003) models with metallicity 0.2 Z⊙. We identify thirty galaxies that satisfy this criterion. In order to robustly compute a Ly fraction, the sample includes galaxies regardless of whether we successfully confirmed a redshift. To ensure the photometric subset is as reliable as possible, we follow previous studies (i.e. Smit et al. 2015b) and only include those galaxies with photometric redshifts that are confidently within the redshift window. Further details are included in Tang et al. (2016, in preparation). The median UV luminosity and spectroscopic(photometric) redshift of this subset of galaxies are M and 4.28(4.23), respectively. We find that ten of thirty galaxies identified by this selection have WLyα in excess of 25 Å, implying a Ly emitter fraction of x. This is significantly greater than the Ly emitter fraction of the full population of similarly luminous galaxies at () determined in Stark et al. (2011) and is significantly greater than that of galaxies with lower equivalent width H emission (Tang et al. 2016, in preparation). If we limit the extreme H emitter sample to galaxies with UV continuum slopes that are similarly blue () as galaxies at , we find an even larger Ly emitter fraction (x). These results suggest that Ly equivalent widths are boosted in galaxies with large equivalent width H emission, reflecting either enhanced transmission or production of Ly photons in galaxies with large sSFR.
A similar trend is seen in the faint gravitationally-lensed galaxies described in Stark et al. (2014). While the galaxies are much lower in stellar mass than the RB16 sample, they have similarly large specific star formation rates. Five galaxies have constraints on both [OIII]+H equivalent widths and Ly emission. The [OIII]+H equivalent widths of this subset are comparable to those in the RB16 galaxies, ranging from 660 Å to 1620 Å. The rest-frame Ly equivalent widths of the five galaxies are also extremely large, ranging from 36 to 164 Å, with a median of 73 Å.
The results described above suggest that prominent Ly emission (W Å) is common in UV-selected galaxies with extreme optical line emission, suggesting a connection between the local radiation field and the escape of Ly from the galaxy. This could reflect both enhanced Ly transmission (through the circumgalactic medium of the galaxy) and an unusually efficient Ly production rate in systems with large specific star formation rates. Based on these results, it is not surprising that a sample selected to have extreme optical line emission at is found to have larger-than-average Ly equivalent widths at any given redshift. But unlike the galaxies described in this subsection, the RB16 systems are located at redshifts where the IGM is expected to be significantly neutral. While the transmission through the galaxy may be enhanced in the RB16 sample, it is not clear that the local radiation field is sufficient to boost transmission through the IGM. One possibility, suggested in Zitrin et al. (2015), is that the identification of the four most luminous galaxies in the CANDELS fields picks out overdense regions which have the largest ionized bubbles at any given redshift. In the following subsection, we show that a correlation between Ly velocity offsets and luminosity is likely to also contribute to the enhanced transmission of Ly in the four RB16 galaxies.
5.2 Impact of MUV and on Ly transmission at
The velocity offset of Ly () plays an important role in regulating the transmission of the line through the IGM at . The larger the velocity offset from systemic, the further away Ly will be from resonance by the time the line photons encounter intergalactic hydrogen. The attenuation provided by the IGM to Ly will thus be minimized in galaxies with large velocity offsets. Knowledge of the typical velocity offsets of reionization-era galaxies is thus an important input for mapping the evolving Ly counts to a neutral hydrogen fraction.
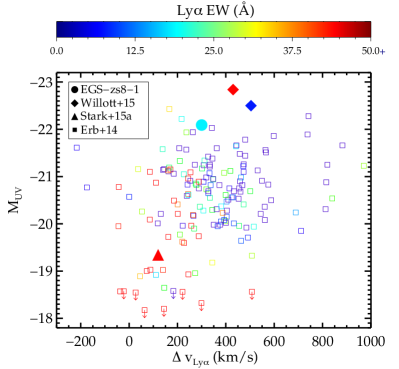
Unfortunately measurement of Ly velocity offsets in the reionization era is extremely challenging. Not only is Ly difficult to detect, but the standard rest-optical emission lines ([OIII], H) used to constrain the systemic redshift are not observable from the ground. Erb et al. (2014) have recently characterized the Ly velocity offsets for a large sample of galaxies at , where [OIII] and H can be easily detected with multi-object near-infrared spectrographs. The results reveal several important relationships. The velocity offset is correlated with UV luminosity and velocity dispersion (at 3 significance), and is anti-correlated with Ly equivalent width (at 7 significance). The smallest velocity offsets are thus found in low luminosity galaxies (Figure 7) with small velocity dispersions and large Ly equivalent widths. Erb et al. (2014) suggest a scenario where the Ly profile is modulated by the properties of the gas at the systemic redshift. The small values of in low mass galaxies could reflect less developed gaseous disks (resulting in less neutral hydrogen at line center) and a harder radiation field capable of reducing the covering fraction of neutral gas at the systemic redshift.
The correlations described above provide a valuable baseline for predicting the likely range of Ly velocity offsets expected in the reionization era. Since galaxies at tend to have larger Ly equivalent widths (Ouchi et al., 2008; Stark et al., 2011; Curtis-Lake et al., 2012; Cassata et al., 2015) and lower luminosities (McLure et al., 2013; Bouwens et al., 2015b; Finkelstein et al., 2015), smaller Ly velocity offsets are likely to be common in the reionization era. Measurement of Ly velocity offsets in a small sample of galaxies at (Schenker et al., 2013) provided the first evidence of redshift evolution in at (Figure 8). Most recently, Stark et al. (2015a) used the systemic redshift from detection of CIII]1909 in a a low luminosity (M) galaxy to provide the first constraint on the at . The measurement revealed a very small Ly offset ( km s-1), consistent with the trend reported in Schenker et al. (2013). Such evolution could be driven by the emergence of harder radiation fields and the gradual disappearance of ordered gaseous disks, both of which would reduce the neutral hydrogen content at the systemic redshift. If the tentative indications of evolution in are confirmed with future observations, it would require less intergalactic hydrogen to explain the disappearance of Ly emitters at (Mesinger et al., 2015). In particular, Choudhury et al. (2015) have recently shown that the evolving Ly fraction constraints can be fit with neutral fractions of % at (8) if the average Ly velocity offset decreases as (1+z)-3 at .
The connection between and IGM transmission is likely to be very different for the luminous RB16 sample. If the correlations discovered in Erb et al. (2014) are already in place at , the velocity offsets will be larger, boosting the transmission of Ly through the IGM. The discovery of a 340 km s-1 velocity offset in EGS-zs8-1 (see §3.1) is consistent with this framework (Figure 7), suggesting that the most luminous galaxies at may have enough neutral gas at their systemic redshift to modulate the Ly profile. Additional support for the existence of a relationship between MUV and in the reionization era comes from the discovery of large velocity offsets ( = 430, 504 km s-1) in two of the most luminous galaxies known at (Willott et al., 2015). Further data are clearly required to determine the relationship between and MUV at , yet the first results suggest a scenario whereby large velocity offsets of luminous galaxies allow Ly to be more easily transmitted through the surrounding IGM. Since luminous systems are also likely to trace overdense regions within large ionized bubbles, the likelihood of detecting Ly should be considerably greater in the most luminous galaxies at . Evidence for luminosity-dependent evolution of LAEs at has been suggested in previous Ly fraction studies (e.g., Ono et al. 2012) and is also consistent with the lack of evolution at the bright end of the Ly luminosity function over (e.g., Matthee et al. 2015).

6 Summary
We present new Keck/MOSFIRE spectroscopic observations of three of the four luminous galaxies presented in Roberts-Borsani et al. (2016). The galaxies are selected to have a large flux excess in the [4.5] IRAC filter, indicative of intense [OIII]+H emission. Previous spectroscopic follow-up has revealed Ly emission in two of the four galaxies and a tentative detection in a third system. Our new MOSFIRE observations confirm that Ly is present in the entire sample. We detect Ly emission in the galaxy COS-zs7-1, confirming its redshift as , and we detect Ly in EGS-zs8-2 at , verifying the lower S/N detection presented in Roberts-Borsani et al. (2016).
The ubiquity of Ly emission in this photometric sample is puzzling given that the IGM is expected to be significantly neutral over . To investigate the potential implications for reionization, we have initiated a campaign to target UV metal line emission in the four Ly emitters. We present the detection of very large equivalent width [CIII], CIII] 1907,1909 Å emission in EGS-zs8-1 (W Å), a galaxy previously shown by Oesch et al. (2015) to have Ly emission at . The centroid of CIII] reveals that Ly is redshifted from systemic by 340 km/s. This velocity offset is larger than that commonly found in less luminous systems and suggests that a correlation between velocity offset and luminosity, known to exist at (Erb et al., 2014), may already be in place in the reionization era. Physically, the velocity offset is modulated by the properties of neutral hydrogen at the systemic redshift of the galaxy. The existence of large velocity offsets at suggests that a substantial amount of gas has already accumulated at the line center in the most massive galaxies, forcing Ly to escape at redder wavelengths. We consider the requirements to match the broadband SEDs and UV metal line properties of the Roberts-Borsani et al. (2016) galaxies using the new BEAGLE tool (Chevallard & Charlot, 2016). The red IRAC colors require the presence of an hard ionizing spectrum (log10 ) in all of the galaxies, while the detection of intense [CIII], CIII] emission in EGS-zs8-1 additionally requires models with reasonably low metallicity (0.11 Z⊙).
These initial results provide the context for understanding why Ly appears so frequently in the luminous sample of galaxies discovered in Roberts-Borsani et al. (2016). The observability of Ly at depends on the transmission through both the galaxy and the IGM. We argue that the product of both quantities is maximized in the RB16 sample. The pre-selection of galaxies with extremely large equivalent width [OIII]+H emission picks out systems with very massive, young stellar populations. Based on results at lower redshift, we suggest that the hard radiation field of these galaxies likely increases the production rate of Ly and may also decrease the covering fraction of neutral hydrogen in the circumgalactic medium, boosting the transmission of Ly through the galaxy. Howewer, unlike at lower redshifts, the Ly emission produced by the RB16 galaxies must traverse a partially neutral IGM. The correlation between the Ly velocity offset and luminosity offers the explanation for why Ly is able to escape so effectively through the IGM from this luminous population of galaxies. For the typical low luminosity systems in the reionization era, Ly emerges close to line center and is thus strongly attenuated by the IGM. But for the most luminous systems with substantial velocity offsets, Ly will be redshifted further into the damping wing by the time it encounters intergalactic HI, enhancing the transmission through the IGM. The escape of Ly will be further amplified if luminous systems trace overdense regions situated in large ionized bubbles (e.g., Furlanetto et al. 2004). As a result, the disappearance of the Ly emitter population may well be less pronounced in the most luminous (i.e., M) galaxies in the reionization era.
Acknowledgments
We thank Mark Dijkstra, Dawn Erb, and Martin Haehnelt for enlightening conversations. We are grateful to Dawn Erb for providing data on Ly velocity offsets. DPS acknowledges support from the National Science Foundation through the grant AST-1410155. RSE acknowledges support from the European Research Council through an Advanced Grant FP7/669253. SC, JG and AVG acknowledge support from the ERC via an Advanced Grant under grant agreement no. 321323 – NEOGAL AZ is supported by NASA through Hubble Fellowship grant #HST-HF2-51334.001-A awarded by STScI, which is operated by the Association of Universities for Research in Astronomy, Inc. under NASA contract NAS 5-26555. This work was partially supported by a NASA Keck PI Data Award, administered by the NASA Exoplanet Science Institute. Data presented herein were obtained at the W. M. Keck Observatory from telescope time allocated to the National Aeronautics and Space Administration through the agency’s scientific partnership with the California Institute of Technology and the University of California. The Observatory was made possible by the generous financial support of the W. M. Keck Foundation. The authors acknowledge the very significant cultural role that the summit of Mauna Kea has always had within the indigenous Hawaiian community. We are most fortunate to have the opportunity to conduct observations from this mountain.
References
- Anders & Fritze-v. Alvensleben (2003) Anders P., Fritze-v. Alvensleben U., 2003, A&A, 401, 1063
- Barkana & Loeb (2004) Barkana R., Loeb A., 2004, ApJ, 609, 474
- Bouwens et al. (2015a) Bouwens R. J., Illingworth G. D., Oesch P. A., Caruana J., Holwerda B., Smit R., Wilkins S., 2015a, ApJ, 811, 140
- Bouwens et al. (2015b) Bouwens R. J., Illingworth G. D., Oesch P. A., Trenti M., Labbé I., Bradley L., Carollo M., van Dokkum P. G., Gonzalez V., Holwerda B., Franx M., Spitler L., Smit R., Magee D., 2015b, ApJ, 803, 34
- Bouwens et al. (2015c) Bouwens R. J., Smit R., Labbe I., Franx M., Caruana J., Oesch P., Stefanon M., Rasappu N., 2015c, Accepted in ApJ, arxiv:1511.08504
- Bowler et al. (2014) Bowler R. A. A., Dunlop J. S., McLure R. J., Rogers A. B., McCracken H. J., Milvang-Jensen B., Furusawa H., Fynbo J. P. U., Taniguchi Y., Afonso J., Bremer M. N., Le Fèvre O., 2014, MNRAS, 440, 2810
- Bressan et al. (2012) Bressan A., Marigo P., Girardi L., Salasnich B., Dal Cero C., Rubele S., Nanni A., 2012, MNRAS, 427, 127
- Bruzual & Charlot (2003) Bruzual G., Charlot S., 2003, MNRAS, 344, 1000
- Cassata et al. (2015) Cassata P., Tasca L. A. M., Le Fèvre O., Lemaux B. C., Garilli B., Le Brun V., Maccagni D., Pentericci L., Thomas R., Vanzella E., Zamorani G., Zucca E., Amorin R., Bardelli S., Capak P., Cassarà L. P., Castellano M., Cimatti A., Cuby J. G., Cucciati O., de la Torre S., Durkalec A., Fontana A., Giavalisco M., Grazian A., Hathi N. P., Ilbert O., Moreau C., Paltani S., Ribeiro B., Salvato M., Schaerer D., Scodeggio M., Sommariva V., Talia M., Taniguchi Y., Tresse L., Vergani D., Wang P. W., Charlot S., Contini T., Fotopoulou S., Koekemoer A. M., López-Sanjuan C., Mellier Y., Scoville N., 2015, A&A, 573, A24
- Chabrier (2003) Chabrier G., 2003, PASP, 115, 763
- Charlot & Fall (2000) Charlot S., Fall S. M., 2000, ApJ, 539, 718
- Charlot & Longhetti (2001) Charlot S., Longhetti M., 2001, MNRAS, 323, 887
- Chevallard & Charlot (2016) Chevallard J., Charlot S., 2016, Submitted to MNRAS, arxiv:1603.03037
- Chevallard et al. (2013) Chevallard J., Charlot S., Wandelt B., Wild V., 2013, MNRAS, 432, 2061
- Choudhury et al. (2015) Choudhury T. R., Puchwein E., Haehnelt M. G., Bolton J. S., 2015, MNRAS, 452, 261
- Christensen et al. (2012) Christensen L., Richard J., Hjorth J., Milvang-Jensen B., Laursen P., Limousin M., Dessauges-Zavadsky M., Grillo C., Ebeling H., 2012, MNRAS, 427, 1953
- Curtis-Lake et al. (2012) Curtis-Lake E., McLure R. J., Pearce H. J., Dunlop J. S., Cirasuolo M., Stark D. P., Almaini O., Bradshaw E. J., Chuter R., Foucaud S., Hartley W. G., 2012, MNRAS, 422, 1425
- Erb et al. (2010) Erb D. K., Pettini M., Shapley A. E., Steidel C. C., Law D. R., Reddy N. A., 2010, ApJ, 719, 1168
- Erb et al. (2014) Erb D. K., Steidel C. C., Trainor R. F., Bogosavljević M., Shapley A. E., Nestor D. B., Kulas K. R., Law D. R., Strom A. L., Rudie G. C., Reddy N. A., Pettini M., Konidaris N. P., Mace G., Matthews K., McLean I. S., 2014, ApJ, 795, 33
- Fan et al. (2006) Fan X., Carilli C. L., Keating B., 2006, Ann. Rev. Astr. Ap., 44, 415
- Feltre et al. (2016) Feltre A., Charlot S., Gutkin J., 2016, MNRAS, 456, 3354
- Ferland et al. (2013) Ferland G. J., Porter R. L., van Hoof P. A. M., Williams R. J. R., Abel N. P., Lykins M. L., Shaw G., Henney W. J., Stancil P. C., 2013, Rev. Mexicana Astron. Astrofis., 49, 137
- Finkelstein et al. (2013) Finkelstein S. L., Papovich C., Dickinson M., Song M., Tilvi V., Koekemoer A. M., Finkelstein K. D., Mobasher B., Ferguson H. C., Giavalisco M., Reddy N., Ashby M. L. N., Dekel A., Fazio G. G., Fontana A., Grogin N. A., Huang J.-S., Kocevski D., Rafelski M., Weiner B. J., Willner S. P., 2013, Nature, 502, 524
- Finkelstein et al. (2015) Finkelstein S. L., Ryan Jr. R. E., Papovich C., Dickinson M., Song M., Somerville R. S., Ferguson H. C., Salmon B., Giavalisco M., Koekemoer A. M., Ashby M. L. N., Behroozi P., Castellano M., Dunlop J. S., Faber S. M., Fazio G. G., Fontana A., Grogin N. A., Hathi N., Jaacks J., Kocevski D. D., Livermore R., McLure R. J., Merlin E., Mobasher B., Newman J. A., Rafelski M., Tilvi V., Willner S. P., 2015, ApJ, 810, 71
- Fontana et al. (2010) Fontana A., Vanzella E., Pentericci L., Castellano M., Giavalisco M., Grazian A., Boutsia K., Cristiani S., Dickinson M., Giallongo E., Maiolino R., Moorwood A., Santini P., 2010, ApJL, 725, L205
- Furlanetto et al. (2004) Furlanetto S. R., Zaldarriaga M., Hernquist L., 2004, ApJ, 613, 1
- Inoue et al. (2014) Inoue A. K., Shimizu I., Iwata I., Tanaka M., 2014, MNRAS, 442, 1805
- James et al. (2014) James B. L., Pettini M., Christensen L., Auger M. W., Becker G. D., King L. J., Quider A. M., Shapley A. E., Steidel C. C., 2014, MNRAS, 440, 1794
- Konno et al. (2014) Konno A., Ouchi M., Ono Y., Shimasaku K., Shibuya T., Furusawa H., Nakajima K., Naito Y., Momose R., Yuma S., Iye M., 2014, ApJ, 797, 16
- Kuhlen & Faucher-Giguère (2012) Kuhlen M., Faucher-Giguère C.-A., 2012, MNRAS, 423, 862
- Matthee et al. (2016) Matthee J., Sobral D., Best P., Khostovan A. A., Oteo I., Bouwens R., Röttgering H., 2016, Submitted to MNRAS, arXiv:1605.08782
- Matthee et al. (2015) Matthee J., Sobral D., Santos S., Röttgering H., Darvish B., Mobasher B., 2015, MNRAS, 451, 400
- McGreer et al. (2015) McGreer I. D., Mesinger A., D’Odorico V., 2015, MNRAS, 447, 499
- McLean et al. (2012) McLean I. S., Steidel C. C., Epps H. W., Konidaris N., Matthews K. Y., Adkins S., Aliado T., Brims G., Canfield J. M., Cromer J. L., Fucik J., Kulas K., Mace G., Magnone K., Rodriguez H., Rudie G., Trainor R., Wang E., Weber B., Weiss J., 2012, in Society of Photo-Optical Instrumentation Engineers (SPIE) Conference Series, Vol. 8446, Society of Photo-Optical Instrumentation Engineers (SPIE) Conference Series
- McLure et al. (2013) McLure R. J., Dunlop J. S., Bowler R. A. A., Curtis-Lake E., Schenker M., Ellis R. S., Robertson B. E., Koekemoer A. M., Rogers A. B., Ono Y., Ouchi M., Charlot S., Wild V., Stark D. P., Furlanetto S. R., Cirasuolo M., Targett T. A., 2013, MNRAS, 432, 2696
- Mesinger et al. (2015) Mesinger A., Aykutalp A., Vanzella E., Pentericci L., Ferrara A., Dijkstra M., 2015, MNRAS, 446, 566
- Oesch et al. (2015) Oesch P. A., van Dokkum P. G., Illingworth G. D., Bouwens R. J., Momcheva I., Holden B., Roberts-Borsani G. W., Smit R., Franx M., Labbé I., González V., Magee D., 2015, ApJL, 804, L30
- Oke & Gunn (1983) Oke J. B., Gunn J. E., 1983, ApJ, 266, 713
- Ono et al. (2012) Ono Y., Ouchi M., Mobasher B., Dickinson M., Penner K., Shimasaku K., Weiner B. J., Kartaltepe J. S., Nakajima K., Nayyeri H., Stern D., Kashikawa N., Spinrad H., 2012, ApJ, 744, 83
- Ouchi et al. (2008) Ouchi M., Shimasaku K., Akiyama M., Simpson C., Saito T., Ueda Y., Furusawa H., Sekiguchi K., Yamada T., Kodama T., Kashikawa N., Okamura S., Iye M., Takata T., Yoshida M., Yoshida M., 2008, ApJS, 176, 301
- Pentericci et al. (2014) Pentericci L., Vanzella E., Fontana A., Castellano M., Treu T., Mesinger A., Dijkstra M., Grazian A., Bradac M., Cristiani S., Galametz A., Giavalisco M., Giallongo E., Maiolino R., Paris D., Santini P., 2014, ArXiv e-prints
- Planck Collaboration et al. (2016) Planck Collaboration, Adam R., Aghanim N., Ashdown M., Aumont J., Baccigalupi C., Ballardini M., Banday A. J., Barreiro R. B., Bartolo N., Basak S., Battye R., Benabed K., Bernard J.-P., Bersanelli M., Bielewicz P., Bock J. J., Bonaldi A., Bonavera L., Bond J. R., Borrill J., Bouchet F. R., Bucher M., Burigana C., Calabrese E., Cardoso J.-F., Carron J., Chiang H. C., Colombo L. P. L., Combet C., Comis B., Coulais A., Crill B. P., Curto A., Cuttaia F., Davis R. J., de Bernardis P., de Rosa A., de Zotti G., Delabrouille J., Di Valentino E., Dickinson C., Diego J. M., Doré O., Douspis M., Ducout A., Dupac X., Elsner F., Enßlin T. A., Eriksen H. K., Falgarone E., Fantaye Y., Finelli F., Forastieri F., Frailis M., Fraisse A. A., Franceschi E., Frolov A., Galeotta S., Galli S., Ganga K., Génova-Santos R. T., Gerbino M., Ghosh T., González-Nuevo J., Górski K. M., Gruppuso A., Gudmundsson J. E., Hansen F. K., Helou G., Henrot-Versillé S., Herranz D., Hivon E., Huang Z., Ili S., Jaffe A. H., Jones W. C., Keihänen E., Keskitalo R., Kisner T. S., Knox L., Krachmalnicoff N., Kunz M., Kurki-Suonio H., Lagache G., Lähteenmäki A., Lamarre J.-M., Langer M., Lasenby A., Lattanzi M., Lawrence C. R., Le Jeune M., Levrier F., Lewis A., Liguori M., Lilje P. B., López-Caniego M., Ma Y.-Z., Macías-Pérez J. F., Maggio G., Mangilli A., Maris M., Martin P. G., Martínez-González E., Matarrese S., Mauri N., McEwen J. D., Meinhold P. R., Melchiorri A., Mennella A., Migliaccio M., Miville-Deschênes M.-A., Molinari D., Moneti A., Montier L., Morgante G., Moss A., Naselsky P., Natoli P., Oxborrow C. A., Pagano L., Paoletti D., Partridge B., Patanchon G., Patrizii L., Perdereau O., Perotto L., Pettorino V., Piacentini F., Plaszczynski S., Polastri L., Polenta G., Puget J.-L., Rachen J. P., Racine B., Reinecke M., Remazeilles M., Renzi A., Rocha G., Rossetti M., Roudier G., Rubiño-Martín J. A., Ruiz-Granados B., Salvati L., Sandri M., Savelainen M., Scott D., Sirri G., Sunyaev R., Suur-Uski A.-S., Tauber J. A., Tenti M., Toffolatti L., Tomasi M., Tristram M., Trombetti T., Valiviita J., Van Tent F., Vielva P., Villa F., Vittorio N., Wandelt B. D., Wehus I. K., White M., Zacchei A., Zonca A., 2016, ArXiv e-prints
- Planck Collaboration et al. (2015) Planck Collaboration, Ade P. A. R., Aghanim N., Arnaud M., Ashdown M., Aumont J., Baccigalupi C., Banday A. J., Barreiro R. B., Bartlett J. G., et al., 2015, ArXiv e-prints
- Roberts-Borsani et al. (2016) Roberts-Borsani G. W., Bouwens R. J., Oesch P. A., Labbe I., Smit R., Illingworth G. D., van Dokkum P., Holden B., Gonzalez V., Stefanon M., Holwerda B., Wilkins S., 2016, ApJ, 823, 143
- Robertson et al. (2015) Robertson B. E., Ellis R. S., Furlanetto S. R., Dunlop J. S., 2015, ApJL, 802, L19
- Sanders et al. (2016) Sanders R. L., Shapley A. E., Kriek M., Reddy N. A., Freeman W. R., Coil A. L., Siana B., Mobasher B., Shivaei I., Price S. H., de Groot L., 2016, ApJ, 816, 23
- Schenker et al. (2013) Schenker M. A., Ellis R. S., Konidaris N. P., Stark D. P., 2013, ApJ, 777, 67
- Schenker et al. (2014) —, 2014, ApJ, 795, 20
- Schenker et al. (2012) Schenker M. A., Stark D. P., Ellis R. S., Robertson B. E., Dunlop J. S., McLure R. J., Kneib J.-P., Richard J., 2012, ApJ, 744, 179
- Shibuya et al. (2012) Shibuya T., Kashikawa N., Ota K., Iye M., Ouchi M., Furusawa H., Shimasaku K., Hattori T., 2012, ApJ, 752, 114
- Shim et al. (2011) Shim H., Chary R.-R., Dickinson M., Lin L., Spinrad H., Stern D., Yan C.-H., 2011, ApJ, 738, 69
- Skelton et al. (2014) Skelton R. E., Whitaker K. E., Momcheva I. G., Brammer G. B., van Dokkum P. G., Labbé I., Franx M., van der Wel A., Bezanson R., Da Cunha E., Fumagalli M., Förster Schreiber N., Kriek M., Leja J., Lundgren B. F., Magee D., Marchesini D., Maseda M. V., Nelson E. J., Oesch P., Pacifici C., Patel S. G., Price S., Rix H.-W., Tal T., Wake D. A., Wuyts S., 2014, ApJS, 214, 24
- Smit et al. (2015a) Smit R., Bouwens R. J., Franx M., Oesch P. A., Ashby M. L. N., Willner S. P., Labbé I., Holwerda B., Fazio G. G., Huang J.-S., 2015a, ApJ, 801, 122
- Smit et al. (2015b) Smit R., Bouwens R. J., Labbé I., Franx M., Wilkins S. M., Oesch P. A., 2015b, Submitted, AriXiv:1511.08808
- Smit et al. (2014) Smit R., Bouwens R. J., Labbé I., Zheng W., Bradley L., Donahue M., Lemze D., Moustakas J., Umetsu K., Zitrin A., Coe D., Postman M., Gonzalez V., Bartelmann M., Benítez N., Broadhurst T., Ford H., Grillo C., Infante L., Jimenez-Teja Y., Jouvel S., Kelson D. D., Lahav O., Maoz D., Medezinski E., Melchior P., Meneghetti M., Merten J., Molino A., Moustakas L. A., Nonino M., Rosati P., Seitz S., 2014, ApJ, 784, 58
- Song et al. (2016) Song M., Finkelstein S. L., Livermore R. C., Capak P. L., Dickinson M., Fontana A., 2016, ArXiv e-prints
- Stanway et al. (2016) Stanway E. R., Eldridge J. J., Becker G. D., 2016, MNRAS, 456, 485
- Stark et al. (2010) Stark D. P., Ellis R. S., Chiu K., Ouchi M., Bunker A., 2010, MNRAS, 408, 1628
- Stark et al. (2011) Stark D. P., Ellis R. S., Ouchi M., 2011, ApJL, 728, L2
- Stark et al. (2015a) Stark D. P., Richard J., Charlot S., Clément B., Ellis R., Siana B., Robertson B., Schenker M., Gutkin J., Wofford A., 2015a, MNRAS, 450, 1846
- Stark et al. (2014) Stark D. P., Richard J., Siana B., Charlot S., Freeman W. R., Gutkin J., Wofford A., Robertson B., Amanullah R., Watson D., Milvang-Jensen B., 2014, MNRAS, 445, 3200
- Stark et al. (2013) Stark D. P., Schenker M. A., Ellis R., Robertson B., McLure R., Dunlop J., 2013, ApJ, 763, 129
- Stark et al. (2015b) Stark D. P., Walth G., Charlot S., Clément B., Feltre A., Gutkin J., Richard J., Mainali R., Robertson B., Siana B., Tang M., Schenker M., 2015b, MNRAS, 454, 1393
- Tilvi et al. (2014) Tilvi V., Papovich C., Finkelstein S. L., Long J., Song M., Dickinson M., Ferguson H. C., Koekemoer A. M., Giavalisco M., Mobasher B., 2014, ApJ, 794, 5
- Tilvi et al. (2013) Tilvi V., Papovich C., Tran K.-V. H., Labbé I., Spitler L. R., Straatman C. M. S., Persson S. E., Monson A., Glazebrook K., Quadri R. F., van Dokkum P., Ashby M. L. N., Faber S. M., Fazio G. G., Finkelstein S. L., Ferguson H. C., Grogin N. A., Kacprzak G. G., Kelson D. D., Koekemoer A. M., Murphy D., McCarthy P. J., Newman J. A., Salmon B., Willner S. P., 2013, ApJ, 768, 56
- Tilvi et al. (2016) Tilvi V., Pirzkal N., Malhotra S., Finkelstein S. L., Rhoads J. E., Windhorst R., Grogin N. A., Koekemoer A., Zakamska N., Ryan R., Christensen L., Hathi N., Pharo J., Joshi B., Yang H., Gronwall C., Cimatti A., Walsh J., OConnell R., Straughn A., Ostlin G., Rothberg B., Livermore R. C., Hibon P., Gardner J. P., 2016, ArXiv e-prints
- Vanzella et al. (2009) Vanzella E., Giavalisco M., Dickinson M., Cristiani S., Nonino M., Kuntschner H., Popesso P., Rosati P., Renzini A., Stern D., Cesarsky C., Ferguson H. C., Fosbury R. A. E., 2009, ApJ, 695, 1163
- Vanzella et al. (2011) Vanzella E., Pentericci L., Fontana A., Grazian A., Castellano M., Boutsia K., Cristiani S., Dickinson M., Gallozzi S., Giallongo E., Giavalisco M., Maiolino R., Moorwood A., Paris D., Santini P., 2011, ApJL, 730, L35
- Wild et al. (2011) Wild V., Groves B., Heckman T., Sonnentrucker P., Armus L., Schiminovich D., Johnson B., Martins L., Lamassa S., 2011, MNRAS, 410, 1593
- Willott et al. (2015) Willott C. J., Carilli C. L., Wagg J., Wang R., 2015, ApJ, 807, 180
- Zitrin et al. (2015) Zitrin A., Labbe I., Belli S., Bouwens R., Ellis R. S., Roberts-Borsani G., Stark D. P., Oesch P. A., Smit R., 2015, ArXiv e-prints