Multiplicity of Galactic Cepheids from long-baseline interferometry III.
Sub-percent limits on the relative brightness of a close companion of Cephei
Abstract
We report new CHARA/MIRC interferometric observations of the Cepheid archetype Cep, which aimed at detecting the newly discovered spectroscopic companion. We reached a maximum dynamic range = 6.4, 5.8, and 5.2 mag, respectively within the relative distance to the Cepheid mas, mas and mas. Our observations did not show strong evidence of a companion. We have a marginal detection at with a flux ratio of 0.21 %, but nothing convincing as we found other possible probable locations. We ruled out the presence of companion with a spectral type earlier than F0V, A1V and B9V, respectively for the previously cited ranges . From our estimated sensitivity limits and the Cepheid light curve, we derived lower-limit magnitudes in the band for this possible companion to be and 7.77 mag, respectively for mas, mas and mas. We also found that to be consistent with the predicted orbital period, the companion has to be located at a projected separation mas with a spectral type later than a F0V star.
keywords:
techniques: interferometric – techniques: high angular resolution – stars: variables: Cepheids – star: binaries: close1 Introduction
Cep is well known as the prototype of classical Cepheid stars since the discovery of its variability by J. Goodricke in 1784 (Goodricke, 1786, although the very first discovered Cepheid was Aql, identified by E. Piggot a few months earlier). Cep has therefore a particular historical interest as being the Cepheid archetype, and is also an important calibrator for the period-luminosity relation with the most accurate parallax for a Milky Way Cepheid ( pc, Benedict et al., 2002). Cep is also a member of a star cluster (Majaess et al., 2012), and its very precise distance derived from cluster membership confirms the parallax distance with a comparable uncertainty (4 %). Both distance determinations further show excellent agreement with the value derived by Storm et al. (2011) using the infrared surface-brightness technique.
This 5.37 days pulsating star, which is also the second nearest Cepheid, has been extensively studied with several observing techniques and wavelengths, revealing little by little new unseen physical properties. Cep is known to have an A0-type visual companion located at about 40″(Fernie, 1966; Prugniel et al., 2007), which turns out to have itself an astrometric component (Benedict et al., 2002). The Cep system is also associated with a circumstellar infrared nebulae, reminiscent of a bow shock aligned with the direction of the proper motion of the stars. This might have been created by the interaction between the stellar wind and the local interstellar medium, and might show that the Cepheid is losing mass (Marengo et al., 2010; Matthews et al., 2012).
Recently, from high-precision radial velocity measurements, Anderson et al. (2015) reported the detection of a spectroscopic companion, closer to the Cepheid than the visual component. They estimated an orbital period of about six years, and a projected semi-major axis of 21.2 mas ( AU, assuming masses for the components). Evans (1992) set upper limits on any possible companions using IUE spectra, she excluded spectral types earlier than A3V (). Anderson et al. (2015) further pointed out that the companion mass is likely to be . If the orbit is favorable and the contrast not too high between the components, the companion should be detected by interferometry. We therefore recently performed new and unique multi-telescope interferometric observations with the MIRC instrument at the CHARA array with the goal of detecting this companion. Our team has already proven that long-baseline interferometry is a powerful tool to spatially detect and resolve very close, faint companions orbiting classical Cepheids (Gallenne et al., 2015, 2014, 2013a, 2013b).
2 CHARA/MIRC observations and data reduction
| UT | MJD | , | Configuration |
|---|---|---|---|
| 2015 Jul. 31 | 57234.484 | 508, 379 | S2-E1-E2-W1-W2 |
| 2015 Oct. 22 | 57317.313 | 303, 160 | S2-E1-E2-W1-W2 |
The observations were performed in July and October 2015 using the Michigan InfraRed Combiner (MIRC) installed at the CHARA array (ten Brummelaar et al., 2005), located on Mount Wilson, California. The CHARA array consists of six 1 m aperture telescopes with an Y-shaped configuration (two telescopes on each branch), oriented to the east (E1, E2), west (W1,W2) and south (S1, S2), providing good coverage of the plane. The baselines range from 34 m to 331 m, providing a high angular resolution down to 0.5 mas in . The MIRC instrument (Monnier et al., 2004; Monnier et al., 2010) is an image-plane combiner which enables us to combine the light coming from all six telescopes in . MIRC also offers three spectral resolutions ( and 400), which provide 15 visibility and 20 closure phase measurements across a range of spectral channels.
We observed Cep (HD 213306, HIP 110991) with five telescopes (S2-E1-E2-W1-W2). We used the lowest spectral resolution, where the light is split into eight spectral channels. Table 1 lists the journal of our observations. We followed a standard procedure of observing a calibrator before and/or after our Cepheids to monitor the interferometric transfer function. The calibrators, HD 206349 ( mas) and HD 214454 ( mas), were selected using the SearchCal111Available at http://www.jmmc.fr/searchcal. software (Bonneau et al., 2006) provided by the Jean-Marie Mariotti Center222http://www.jmmc.fr.
The data were reduced using the standard MIRC pipeline (Monnier et al., 2007), which consists of computing the squared visibilities and triple products for each baseline and spectral channel, and to correct for photon and readout noises. Squared visibilities are estimated using Fourier transforms, while the triple products are evaluated from the amplitudes and phases between three baselines forming a closed triangle. We then did an incoherent average of 30 s for the final data such that the projected baselines do not change significantly during one exposure, therefore reducing smearing of the closure phases and optimizing the companion detection sensitivity.
3 Companion search and sensitivity limit
| All Observables | Only | Sp. Type limit | |||||||
|---|---|---|---|---|---|---|---|---|---|
| #1 | 6.17 | 5.63 | 5.26 | 6.44 | 5.82 | 5.24 | F0V | A1V | B9V |
| #2 | 4.24 | 3.68 | 3.51 | 4.35 | 3.45 | 2.88 | B6V | B3V | B1V |
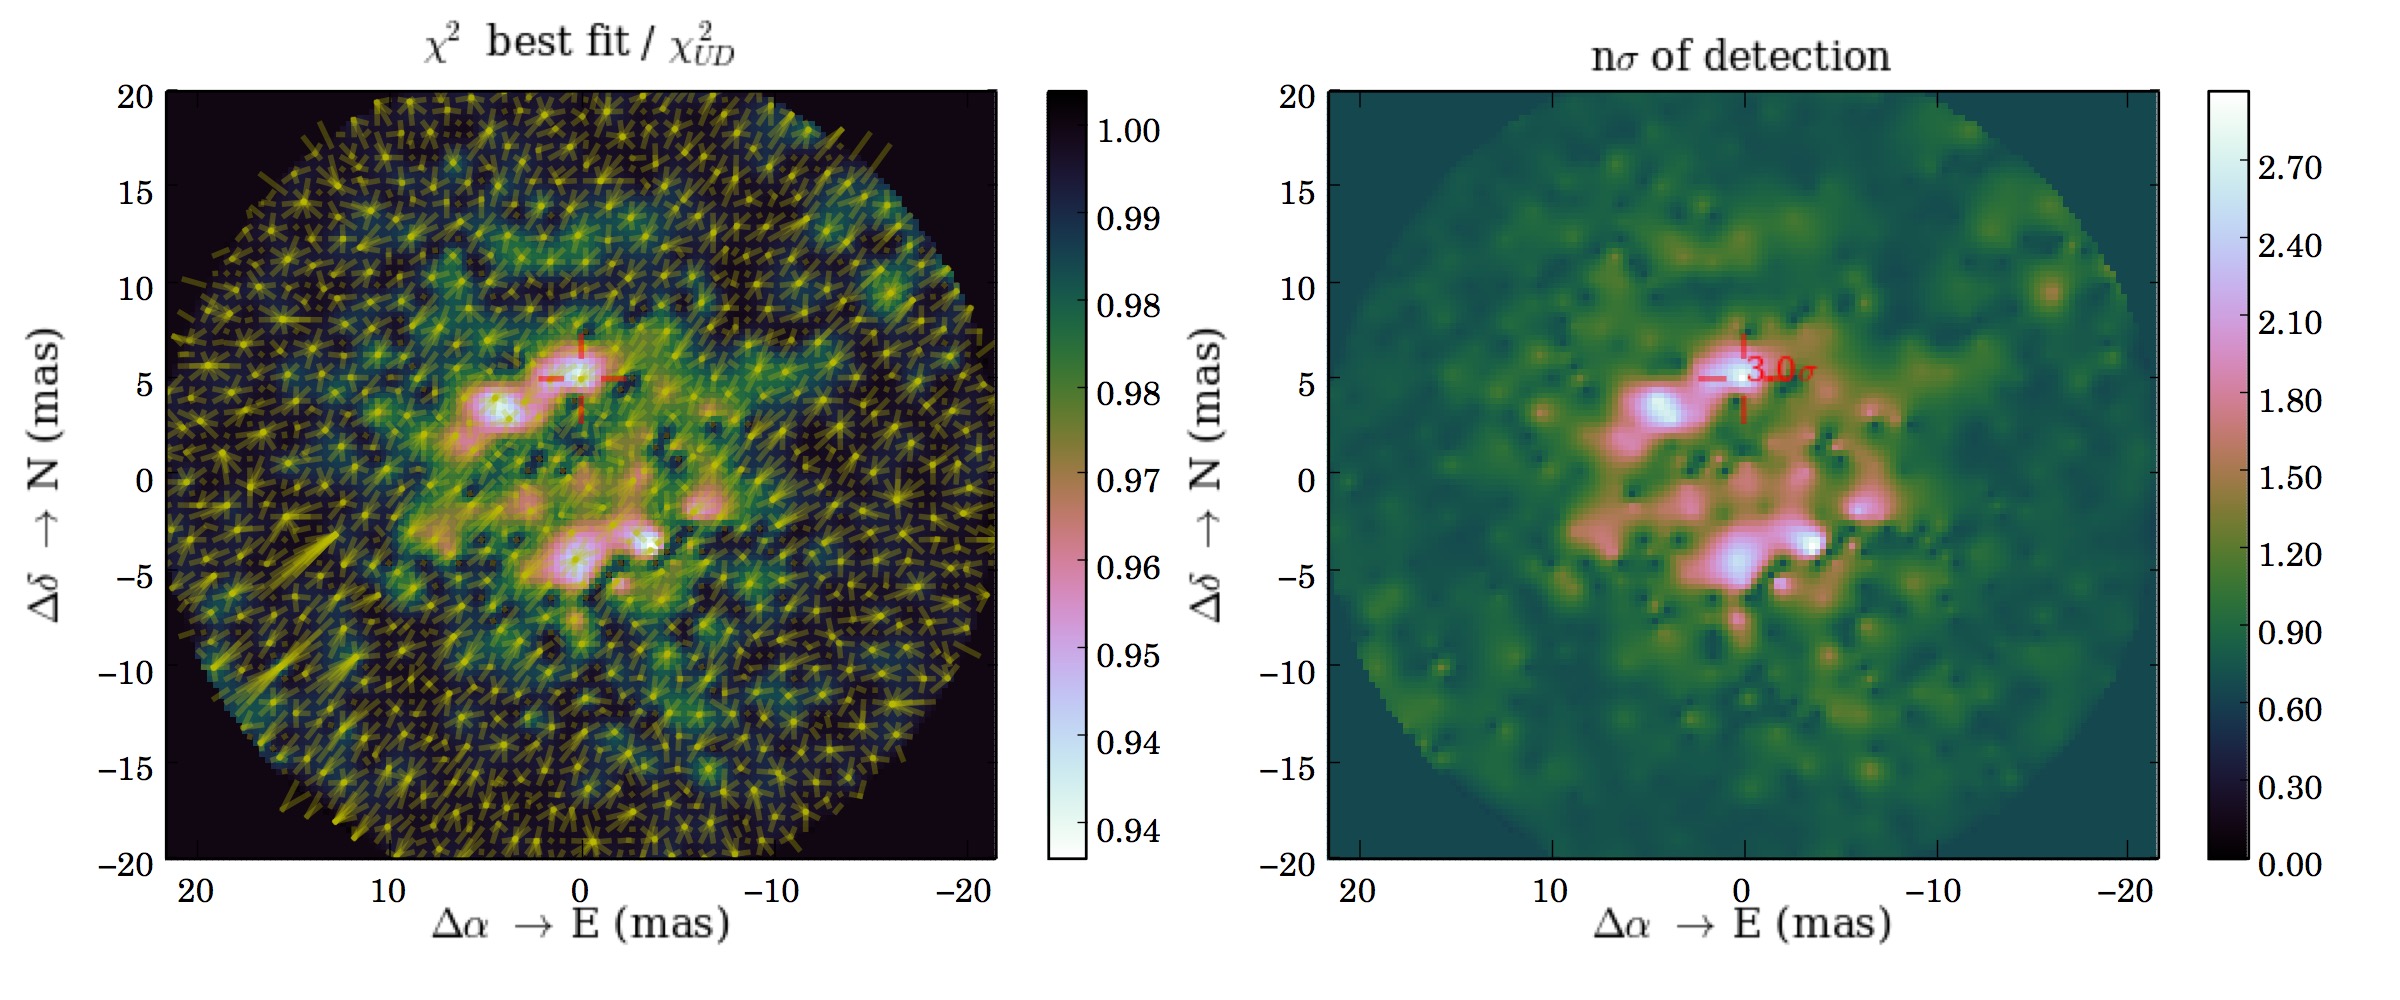
To search for companion we used the tool CANDID333Available at https://github.com/amerand/CANDID (Gallenne et al., 2015), made for this purpose. It allows a systematic search for companions performing a grid of fit, whose minimum needed grid resolution is estimated a posteriori. The tool delivers the binary parameters, namely the flux ratio and the astrometric separation (), but also the uniform disk angular diameter of the primary , and the (non-)detection level of the component. It uses statistics to estimate the level of detection in "number of sigmas", and therefore assumes the error bars are uncorrelated. We will claim a detection if the level is .
We first CANDID for each individual dataset (i.e. July and October) and searched around 100 mas from the Cepheid. We chose this limit because companions at larger distances are strongly impacted by the bandwidth smearing effect, and in addition are more efficiently detected using adaptive optics on a single-dish telescope (through imaging or sparse aperture masking). The first dataset (July) gives a best fit at a detection level of using all interferometric observables (i.e. the squared visibilities , the closure phases CPs, and the bispectrum amplitudes), and only using . Fig. 1 shows the map with the most probable location of a companion, if any, and the map giving the detection level at each point in the grid for the July observations. A companion might be detected at mas and , with a flux ratio of %, but other positions seem also possible with similar detection levels. Furthermore, such a flux ratio is below the average sensitivity limit reachable by the current beam combiners, but two components were already detected with such a contrast (Roettenbacher et al., 2015; Gallenne et al., 2015). The second dataset (October) gives a best fit at a detection level of both for all observables and only the CPs, but at distinct locations and very different flux ratios. As this second observation was performed under poor seeing conditions, the visibilities are probably biased and not reliable to detect such faint companions. With the closure phase only, the most probable location is at mas and , and seems consistent with the July observations. However, the estimated flux ratio is 0.88 %, very different to 0.21 % in July. The magnitude difference of the Cepheid between the two phases is mag (see Fig. 4), which would correspond to a % change in flux ratio, and not a factor of 4. We therefore conclude that we do not have a detection in October, while it is marginal for July and just at our chosen detection threshold.
CANDID has also implemented a robust method to derive the dynamic range we can reach with a given set of data. It consist of injecting a fake companion into the data at each astrometric position with different flux ratios. As we inject a companion, we therefore know that the binary model should be the true model. We then compare the with the one of a single star model (uniform disk model) to obtain the probability of the binary model to be the true model. We set the significance level on the flux ratios at , meaning that lower flux ratios are not significantly detected. We refer the reader to Gallenne et al. (2015) for more information about the method. For comparison, CANDID has also implemented a less robust method which consist of comparing a uniform disk model with a binary model for each position in the grid, and then check whether the probability of the binary model is consistent with the data (Absil et al., 2011). In the following, all of the given detection limits are derived from our injection method, because we demonstrated in Gallenne et al. (2015) that the Absil’s method may under- or overestimate the detection limits.

We listed in Table 2 two detection limits for each dataset, one using all of the observables, and one using only the closure phases. We also gave three different values, the average for mas, mas and mas, which can be relevant when the limit increases with the relative distance to the Cepheid, . All of the final contrast limits, expressed in magnitude, are conservative as they correspond to the mean plus the standard deviation for the given radius range. We present in Fig. 2 the contrast limit curve, using all observables, for the observations performed in July.
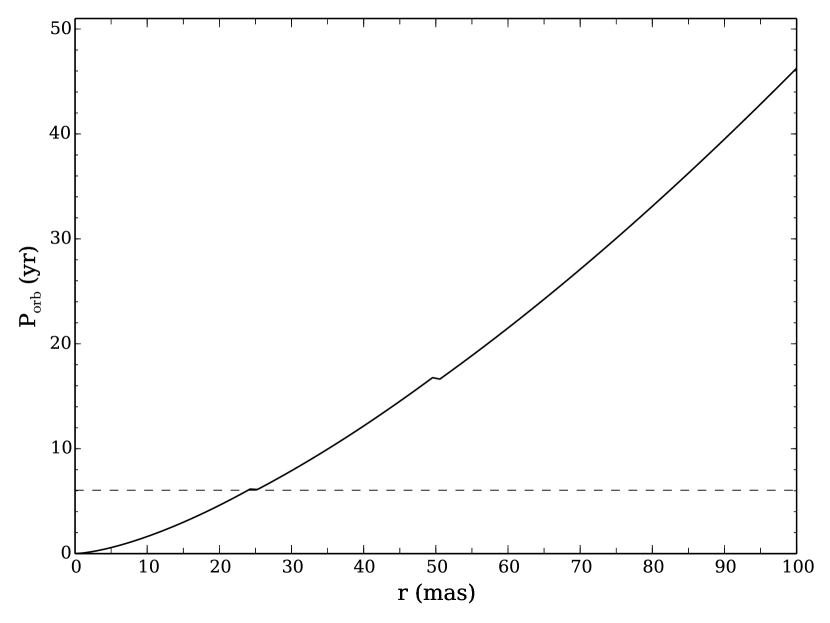
From an evolutionary timescale point of view, most of the companions should be stars close to the main sequence. We therefore set upper limits for the companion spectral type assuming it is on the main sequence, and based on their H-band luminosities. From our estimated reported limits, we can exclude the presence of a companion having a spectral type earlier than a F0V star within 25 mas, A1V star between 25–50 mas, and B9V star between 50–100 mas from Cep (estimated using intrinsic colors from Cox (2000) and Ducati et al. (2001)). This would correspond to a companion mass , , and , respectively (Cox, 2000). From those limits, we can check the consistency with the predicted orbit of Anderson et al. (2015). Using Kepler’s law and setting the projected separation as a lower limit for the angular semi-major axis, that is , we have:
with in arcsecond, in parsec, in year and the masses in solar mass. In Fig. 3, we plotted the function , using a maximum Cepheid mass of (see e.g. Matthews et al., 2012), and the previously cited mass limits for the companion. We also plotted the predicted upper-limit period (i.e. ) derived by Anderson et al. (2015). We can see that to be consistent with the expected period, the companion has to be located at mas, and has therefore a spectral type later than a F0V star. It is also consistent with the predicted projected semi-major axis of 21.2 mas.
The marginally detected component with % ( mag) would correspond to a F2V star, with a mass of about , which would be consistent with the upper limit pointed out by Anderson et al. (2015). The projected separation of mas seems also consistent with our previous maximum separation threshold.
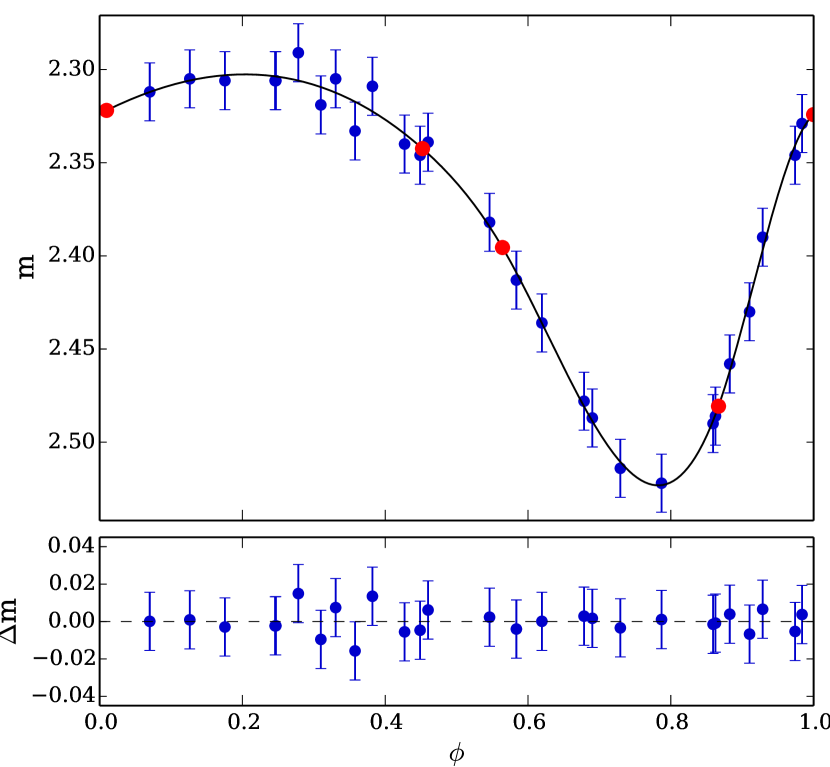
We can also set lower limit on the companion flux using the Cepheid -band light curve from the literature, which would actually represent the combined flux in case of an unseen companion is present. We retrieved the photometry from Barnes et al. (1997) and used the ephemeris = 2448305.2362421 days and = 5.3662906 days (Mérand et al., 2015) to construct the -band light curve. To estimate the magnitudes at our given pulsation phases (i.e. = 0.05 and 0.48), we interpolated the data with a periodic cubic-spline function defined by floating nodes. The interpolated curve is shown in Fig. 4. We then estimated the combined magnitudes mag and mag, respectively at phases and 0.48. For simplicity and as those values are rather close, we used the averaged value and the standard deviation, giving the average combined magnitude mag. Following Eq. 2 of Gallenne et al. (2014),
| (1) |
with , and the flux ratio between the companion and the Cepheid, we estimated a minimum -band magnitude for the companion to be and 7.77 mag, respectively for mas, mas and mas.
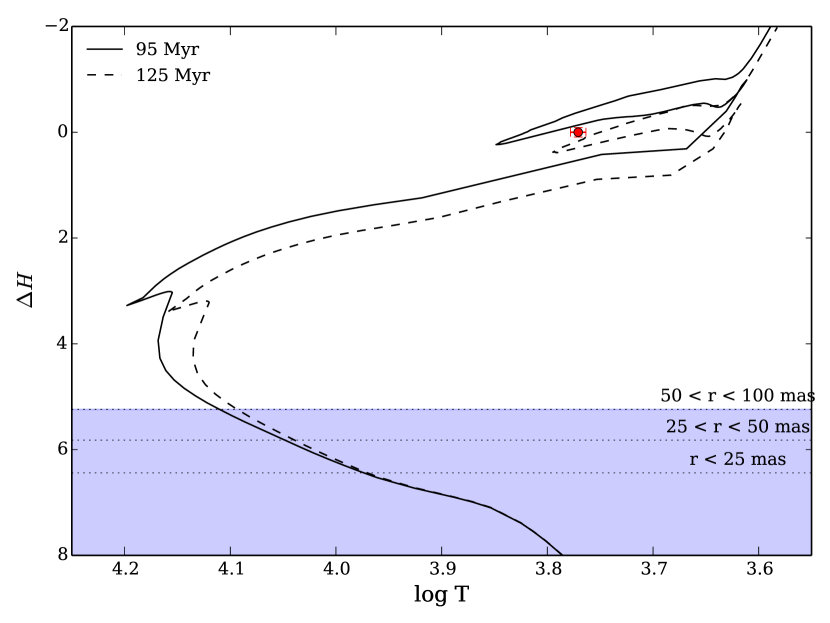
Another approach in deriving the luminosity class limit of this possible companion is to use the Hertzsprung-Russell (HR) diagram and our derived magnitude difference limits. We retrieved Geneva stellar isochrones (Ekström et al., 2012) for ages Myr, a solar metallicity and a initial rotation rate of . Using the output of the isochrone models, i.e. effective temperatures and absolute magnitudes, we converted the HR diagram into a -band absolute magnitude-temperature diagram () using the known properties of the Cepheid, i.e. the parallax mas (Benedict et al., 2002), an average effective temperature K (Andrievsky et al., 2005), and an average apparent magnitude mag (Barnes et al., 1997). In Fig. 5, we show two isochrones encompassing the Cepheid properties (red dot). We see that the two isochrone limits give the same luminosity class limit for an undetected component, as indicated by the blue area in the figure, i.e. if a companion is orbiting Cep, it should be a main-sequence or white dwarf star. The presence of a white-dwarf companion is not unlikely. This is possible if the companion was originally more massive than the Cepheid, but no white dwarf companion to a Cepheid has been found so far.
4 Angular diameter
Our observations also provide measurements of the angular diameter of the Cepheid for two pulsation phases. We estimated the limb-darkened (Rosseland) diameter of the star following the formalism of (Mérand et al., 2015), i.e. we extracted the radial intensity profile of the spherical SATLAS models (for temperatures of 6900 K and 5600 K at phases 0.05 and 0.048), which was converted to a visibility profile using a Hankel transform and fitted to our squared visibility data.
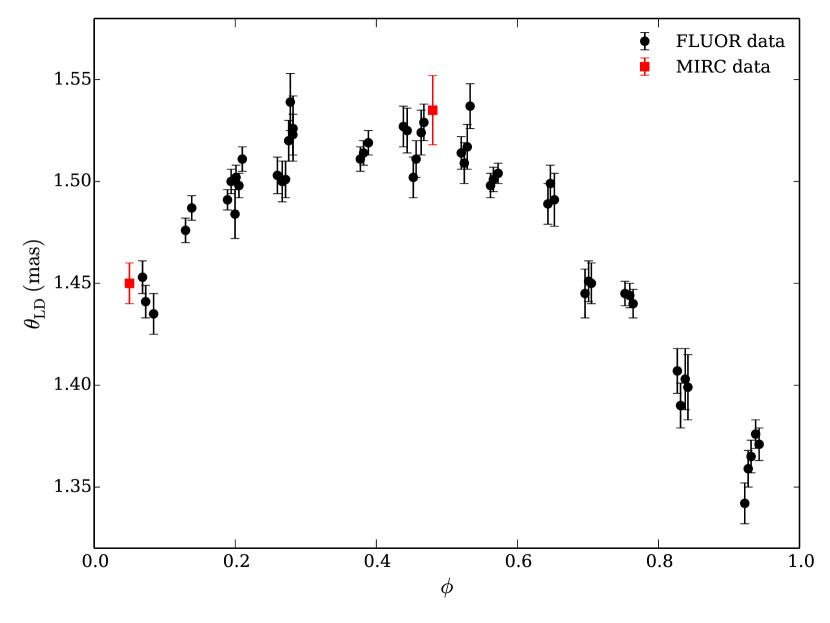
We measured mas and mas, respectively at pulsation phases 0.05 and 0.48. These values have been estimated using the bootstrapping technique (with replacement) on all baselines. We took from the distributions the median, and the maximum value between the 16th and 84th percentiles as uncertainty. These measurements are in good agreement with the angular diameter variation curve previously reported with the instrument CHARA/FLUOR (Mérand et al., 2005, 2015), as shown in Fig. 6.
5 Conclusion
We reported new and unique multi-telescope interferometric observations of the classical Cepheid Cep. The goal was to detect the newly discovered spectroscopic companion reported by Anderson et al. (2015).
Our observations did not show strong evidence of any companion with a spectral type earlier than F0V, A1V and B9V, respectively within the relative distance from Cep mas, mas and mas. The spectral type limits are tighter than previous works for mas. We also estimated lower limit magnitudes for the companion to be and 7.77 mag, respectively. We also showed that to be consistent with the predicted orbital period, the companion has to be located at a projected separation mas and have spectral type later than a F0V star.
A component might have been marginally detected at only , but we found several possible locations. Although the estimated flux ratio and separation are consistent with what expected, the detection is not really convincing. Additional data are necessary to claim a detection.
The regular dynamic range reachable by the current beam combiners is about 5.8 mag (200:1), making this new possible companion of Cep hardly detectable from long-baseline interferometry, but not impossible as already demonstrated by Gallenne et al. (2015) and Roettenbacher et al. (2015), who detected components with a flux ratio of about 6.5 mag.
Acknowledgements
The authors would like to thank the CHARA Array and Mount Wilson Observatory staffs for their support. This work is based upon observations obtained with the GSU Center for High Angular Resolution Astronomy Array at Mount Wilson Observatory. The CHARA Array is supported by the NSF under Grants No. AST-1211929 and AST-1411654. Institutional support has been provided from the GSU College of Arts and Sciences and the GSU Office of the Vice President for Research and Economic Development. JDM’s contribution to this work was partially supported by HST Guest Observer grants (HST-GO-13454.07-A, HST-GO-13841.006-A) and NSF (NSF-AST1108963). WG and GP gratefully acknowledge financial support for this work from the BASAL Centro de Astrofísica y Tecnologías Afines (CATA) PFB-06/2007. Support from the Polish National Science Centre grants MAESTRO DEC-2012/06/A/ST9/00269 is also acknowledged. PK, AG and WG acknowledge support of the French-Chilean exchange program ECOS-Sud/CONICYT (C13U01). The authors acknowledge the support of the French Agence Nationale de la Recherche (ANR), under grant ANR-15-CE31-0012-01 (project UnlockCepheids). R.I.A. acknowledges funding from the Swiss National Science Foundation. W.G. also acknowledges financial support from the Millenium Institute of Astrophysics (MAS) of the Iniciativa Cientifica Milenio del Ministerio de Economía, Fomento y Turismo de Chile, project IC120009. This research received the support of PHASE, the high angular resolution partnership between ONERA, Observatoire de Paris, CNRS, and University Denis Diderot Paris 7. This work made use of the SIMBAD and VIZIER astrophysical database from CDS, Strasbourg, France and the bibliographic informations from the NASA Astrophysics Data System. This research has made use of the Jean-Marie Mariotti Center SearchCal and ASPRO services, co-developed by FIZEAU and LAOG/IPAG, and of CDS Astronomical Databases SIMBAD and VIZIER.
References
- Absil et al. (2011) Absil O., et al., 2011, A&A, 535, A68
- Anderson et al. (2015) Anderson R. I., Sahlmann J., Holl B., Eyer L., Palaversa L., Mowlavi N., Süveges M., Roelens M., 2015, ApJ, 804, 144
- Andrievsky et al. (2005) Andrievsky S. M., Luck R. E., Kovtyukh V. V., 2005, AJ, 130, 1880
- Barnes et al. (1997) Barnes III T. G., Fernley J. A., Frueh M. L., Navas J. G., Moffett T. J., Skillen I., 1997, PASP, 109, 645
- Benedict et al. (2002) Benedict G. F., et al., 2002, AJ, 124, 1695
- Bonneau et al. (2006) Bonneau D., et al., 2006, A&A, 456, 789
- Cox (2000) Cox A. N., 2000, Allen’s astrophysical quantities. New York: AIP
- Ducati et al. (2001) Ducati J. R., Bevilacqua C. M., Rembold S. B., Ribeiro D., 2001, ApJ, 558, 309
- Ekström et al. (2012) Ekström S., et al., 2012, A&A, 537, A146
- Evans (1992) Evans N. R., 1992, ApJ, 384, 220
- Fernie (1966) Fernie J. D., 1966, AJ, 71, 119
- Gallenne et al. (2013a) Gallenne A., Kervella P., Mérand A., Monnier J. D., Breitfelder J., Pietrzyński G., Gieren W., 2013a, in Pavlovski K. Tkachenko A., Torres G., eds, Vol. 64, EAS Publications Series. pp 197–204 (arXiv:1311.3207), doi:10.1051/eas/1364027
- Gallenne et al. (2013b) Gallenne A., et al., 2013b, A&A, 552, A21
- Gallenne et al. (2014) Gallenne A., et al., 2014, A&A, 561, L3
- Gallenne et al. (2015) Gallenne A., et al., 2015, A&A, 579, A68
- Goodricke (1786) Goodricke J., 1786, RSPT, 76, 48
- Majaess et al. (2012) Majaess D., Turner D., Gieren W., 2012, ApJ, 747, 145
- Marengo et al. (2010) Marengo M., et al., 2010, ApJ, 725, 2392
- Matthews et al. (2012) Matthews L. D., Marengo M., Evans N. R., Bono G., 2012, ApJ, 744, 53
- Mérand et al. (2005) Mérand A., et al., 2005, A&A, 438, L9
- Mérand et al. (2015) Mérand A., et al., 2015, A&A, 584, A80
- Monnier et al. (2004) Monnier J. D., Berger J.-P., Millan-Gabet R., ten Brummelaar T. A., 2004, in W. A. Traub ed., Vol. 5491, Society of Photo-Optical Instrumentation Engineers (SPIE) Conference Series. p. 1370
- Monnier et al. (2007) Monnier J. D., et al., 2007, Science, 317, 342
- Monnier et al. (2010) Monnier J. D., et al., 2010, in Danchi W. C., Delplancke F., Rajagopal J. K., eds, Vol. 7734, SPIE Conference Series. pp 77340G–77340G–12, doi:10.1117/12.858286
- Prugniel et al. (2007) Prugniel P., Soubiran C., Koleva M., Le Borgne D., 2007, VizieR Online Data Catalog, 3251, 0
- Roettenbacher et al. (2015) Roettenbacher R. M., et al., 2015, ApJ, 809, 159
- Storm et al. (2011) Storm J., et al., 2011, A&A, 534, A94
- ten Brummelaar et al. (2005) ten Brummelaar T. A., et al., 2005, ApJ, 628, 453