Correlation Between Sunspot Number and Ca ii K Emission Index
keywords:
Chromosphere, Active; Magnetic fields, Chromosphere; Solar Irradiance1 Introduction
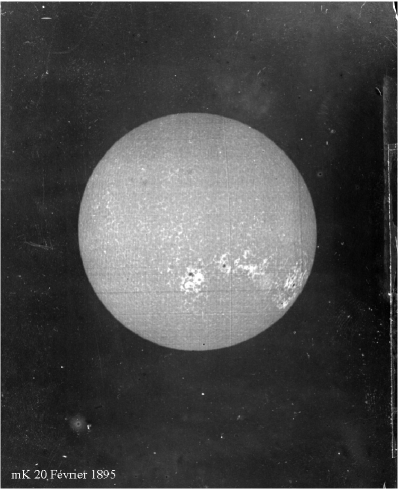
The first spectroheliograph was developed by George Ellery Hale in 1889 and within a few years the first images of the Sun in the Ca ii K line became available. Figure \irefhistory shows an example of a very early observation taken with a spectroheliograph. The image is from the Meudon archive of historical spectroheliograms, available at bass2000.obspm.fr/gallery2/main.php. Clearly visible in this image is the presence of brighter regions on the solar disk, known as plages. However, it was only after the turn of the 20th century that regular observations in the Ca ii K line began at the Kodaikanal Observatory (India) and later, in 1915, at the Mount Wilson Observatory (USA). Within the next decade, analogous programs began at several other observatories. Full-disk Ca ii K observations started in 1917 at the National Solar Observatory of Japan (e.g. Hanaoka, 2013), in 1919 at the Paris-Meudon Observatory in France (e.g. Mein and Ribes, 1990), in 1926 at the ”Donati” solar tower telescope of the Arcetri Astrophysical Observatory in Italy (e.g. Ermolli et al., 2009b), and in 1926 at the Astronomical Observatory of the Coimbra University in Portugal (e.g. Garcia et al., 2011).
Detailed studies of long-term variations in the solar activity cycle require observations taken on a continuous basis for several decades. At present, only four sets of direct observations of the solar atmosphere are available for this purpose: 1) the visual sunspot counts, that retrace the last four centuries of solar activity; 2) the measurements in the ionized Ca ii K line (393.37 nm); 3) H observations; and 4) white-light measurements. Regular observations in Ca ii K , H, and white-light have been available since the early years of the twentieth century. Although all four sets of measurements provide important insight into the behavior of the 11-year solar cycle, the last three offer much broader diagnostic capabilities. They can capture the complex hierarchical structures of the solar magnetic field and its evolution on a wide range of different spatial and temporal scales. In particular, Ca ii K measurements in bright magnetic features can be used as a proxy for the line-of-sight unsigned magnetic flux density (e.g. Babcock and Babcock, 1955; Schrijver et al., 1989; Ortiz and Rast, 2005; Loukitcheva, Solanki, and White, 2009; Pevtsov et al., 2016).
Furthermore, observations and empirical models have shown that solar irradiance varies on time scales from minutes to decades (Fröhlich and Lean, 2004; Solanki, Krivova, and Haigh, 2013) and this variability is highly correlated to area variations of plages and chromospheric network that can be observed in the Ca ii K line (e.g. Domingo et al., 2009; Ermolli, Criscuoli, and Giorgi, 2011; Fontenla et al., 2011; Fontenla, Stancil, and Landi, 2015 and references therein). In particular, plages and chromospheric magnetic network play a significant role in modulating the solar irradiance in the UV and EUV spectral bands which directly influence the Earth’s atmosphere, from the stratosphere down to the troposphere (Haigh and Blackburn, 2006; Foukal et al., 2009). Due to the Earth’s atmospheric absorption it was not until long-duration measurements from space were available that changes in total and spectral solar irradiance were accurately measured. Those measurements began with the launch of the Nimbus 7 satellite in November 1978. However, Ca ii K measurements can be used as a proxy to reconstruct the past history of solar irradiance over much longer periods of time (Foukal, 1998; Foukal, 2003).
The purpose of this paper is twofold: 1) Create a 100+ years long, ongoing, disk-integrated Ca ii K emission index time series by combining both historical and modern data; 2) Investigate possible significant differences between this time series and the recently released new sunspot number data. We anticipate that this new Ca ii K time series may provide a useful tool for a variety of studies related to the investigation of the long-term properties of the solar cycle. In the next section we briefly discuss the properties of the three data sets used in creating the disk-integrated Ca ii K emission composite, and how those data were combined together into a single time series. In Section 3 we present the comparison between our new Ca ii K composite and the recently revised sunspot number data series. Our conclusions are highlighted in Section 4.
2 Disk-Integrated Ca ii K Emission Indices
For our analysis we consider data from three separate sets of measurements in the Ca ii K line: 1) Data from the Kodaikanal photographic archive of spectroheliograms; 2) Data from integrated sunlight observations carried out at the National Solar Observatory Sacramento Peak, and 3) Data obtained with the Integrated Sunlight Spectrometer operated by the National Solar Observatory in Arizona. These measurements and their corresponding Ca ii K index time series, have been described in great details in several previously published studies. Here we only provide a brief summary of their properties.
2.1 Kodaikanal Time series
The archive at the Kodaikanal Observatory (KKL) of the Indian Institute of Astrophysics in Bangalore hosts the longest record of spectroheliograms currently available. After the Cambridge spectroheliograph was put into operation, in late 1904, there was some problem with the settings of the second slit at the correct wavelength. Although spectroheliograms were obtained in 1905 and 1906, the instrument did not perform to its potential until 1907, when regular observations began (Hasan et al., 2010). The 70-micron exit slit of the spectroheliograph corresponds to a 0.5 Å bandpass centered on the core of K3 at 393.37 nm. Spectroheliograms in the Ca ii K line were obtained using the photographic emulsion until 2007. In particular, from the 1970s to late 2007 Scientia EM 23D56 emulsions from the AGFA company was used. After this stock was exhausted, in 2007, images in Ca ii K were taken using Kodak film, but the results were not satisfactory and the program was terminated the same year. Observations in Ca ii K at Kodaikanal Observatory were also acquired using other instruments. For example, beginning in 1997 observations were obtained using a filter-based instrument (Daystar), with a 1.2Å bandpass, and Photometrics CCD camera. After 2008 Ca ii K measurements, along with broadband images of the Sun, were recorded on two ANDOR CCD cameras simultaneously using the TWIN telescope. While the TWIN telescope is still operational, due to problems with the CCD cameras, observations in Ca K line have not been obtained since October 2013. Overall, the number of days available at Kodaikanal for making observations of the Sun had become less in the later part of the 20th century as compared to the first half of 20th century. Our investigation does not require the longest database available from this program of observations, but rather the most uniform and homogeneous one. For this reason we used here data from a collection of more than 26 000 observations acquired between 1907 and 1999 that were digitized by Makarov et al. (2004). During this time interval observations were taken with minimum changes in instrumental set-up, property of films, etc…, providing a highly uniform and homogenous set of images. This is the same data set investigated, for example, by Tlatov, Pevtsov, and Singh (2009), Ermolli et al., 2009a and Foukal et al. (2009). The 8-bit depth and 2.0 arcseconds/pixel image scale of these images are sufficient to study plage areas with high contrast. Recently, the same collection of Ca ii K spectroheliograms has been re-digitized using a 4K4K CCD camera format with a pixel resolution of 0.86 arcseconds, and 16-bit readout (Priyal et al., 2014). The calibration of the new images includes flat-fielding, density to intensity conversion, and corrections for image geometry. About 80% of those images have been used in the study by Priyal et al. (2014), but due to some residual calibration issues the data have not yet been released (J. Singh, private communication).
In general, the proper photometric calibration of photographic spectroheliograms requires the presence of both the solar image and a series of stepwedge exposures on the plate. When this is the case, the transparency of the photographic plate material and the corresponding emulsion response curve can be determined using the approach suggested by de Vaucouleurs (1968). Unfortunately, the lack of stepwedge exposures on a significant portion of the KKL data makes difficult to consistently calibrate these images. In addition, changes in the image center across the field-of-view may produce variations in intensity and its gradient (vignetting) from one image to another. It should be noticed that these issues are common also in other similar historical data, such as the Mount Wilson archive of ionized Ca ii K line spectroheliograms (Bertello, Ulrich, and Boyden, 2010). As discussed in Ermolli et al. (2009a), properly addressing these issues is critical for the diagnostic value of these measurements in long-term solar activity and irradiance studies. Different techniques have been proposed in the past to mitigate artifacts affecting the quality of these data (e.g. Foukal, 1998; Lefebvre et al., 2005; Tlatov, Pevtsov, and Singh, 2009; Centrone, Ermolli, and Giorgi, 2005). In Tlatov, Pevtsov, and Singh (2009) the same approach was used to calibrate Ca ii K images from three different observatory: Kodaikanal Observatory, Mount Wilson Observatory, and the National Solar Observatory at Sacramento Peak. A plage index was defined as the fraction of the visible solar hemisphere covered by chromospheric plages and network elements at any given time for all of these three sets of measurements. For the first two sets of measurements, area values determined from the images were not compensated for foreshortening. The Ca ii K plage index time series derived from the Kodaikanal measurements is shown in Figure \irefkkl.

2.2 NSO Sacramento Peak Time series
Sun-as-a-star Ca ii K line measurements have been taken with the coelostat and horizontal Littrow spectrograph of the National Solar Observatory Evans facility at Sacramento Peak (New Mexico, USA) since late 1976 (Keil and Worden, 1984). The instrument was designed to have a very low level of scattered light by blocking the light reflected from the back of the spectrograph lens, and from using the Littrow spectrograph in double-pass mode. The observed spectrum has a stepsize of 5.5 mÅ, and each Ca ii K profile is flux-calibrated according to the procedure described in White and Livingston (1978). In short, the average flux computed within a 0.528 Å-wide window that is 1.187 Å redward from the core of the Ca ii K line is assumed to be equal to 16.2% of the continuum value near the Ca ii K line. The equivalent width of a 1-Å spectral band centered on the core of the Ca ii K line is defined as the Ca ii K 1-Å emission index (Wilson, 1968). Because a similar program of observations (SOLIS/ISS) began at Kitt Peak near the end of 2006, after reaching a sufficient overlap in time between the two series, the Sacramento Peak program was discontinued in November 2015. Over 36 years of data from this program were recently analysed by Scargle, Keil, and Worden (2013) to study the temporal variability of seven different chromospheric parameters.
2.3 SOLIS/ISS Time series
The Integrated Sunlight Spectrometer (ISS) is one of three instruments comprising the Synoptic Optical Long-term Investigations of the Sun (SOLIS, Balasubramaniam and Pevtsov, 2011 and reference therein). In operation since late 2006, the ISS takes high spectral resolution (R 300,000) daily observations of the Sun-as-a-star in nine different spectral bands covering a large range of wavelengths (Bertello et al., 2011). The observations taken in the Ca ii K spectral line centered at 393.37 nm is the longest continuous data in the SOLIS/ISS data set. The spectral band for the Ca ii K line covers about 0.05 nm, and thus, does not include the continuum near the Ca ii K line. To overcome this limitation, the observed line profiles are normalized using intensities at two narrow bands situated in the blue (393.147-393.153 nm) and red (393.480-393.500 nm) wing of the Ca ii K line (Pevtsov, Bertello, and Marble, 2014). Mean intensities in these two bands are scaled to match intensities in the ”reference” spectral line profile taken by the NSO Fourier Transform Spectrometer (FTS, Wallace, Hinkle, and Livingston, 2007). This normalization also helps to remove any residual linear gradients in intensity in the spectral direction. Variation in intensity over the activity cycle at the location of these normalization bands is estimated to be around 1%, which is much smaller than the variation in the Ca ii K line emission component. For a more detailed description of the SOLIS/ISS data reduction we refer the reader to Bertello et al. (2011).
2.4 Ca ii K Composite
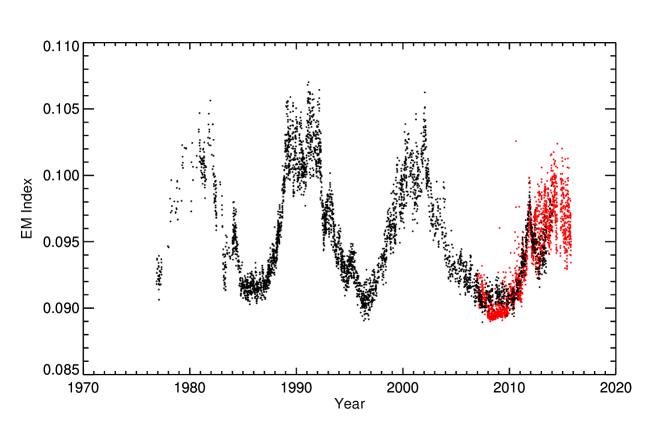
A composite of disk-integrated Ca ii K measurements that dates back to 1907 can be produced by combining the three time series described in Sections 2.1-2.3. The adopted Kodaikanal time series covers the 1907–1999 time interval, while data from the NSO/Sacramento Peak time series were used up to the end of 2013. The ongoing SOLIS/ISS time series, that began December 2006, is used here as a reference for creating the composite. There is an overlap of about seven years (2007–2013) between the observations at Sacramento Peak and those taken by the SOLIS/ISS, which includes the extended solar minimum of Cycles 23/24. This time-span is long enough to cross-calibrate the two sets of measurements. Although the two instruments are very similar, and they measure the same quantities, they slightly differ in sensitivity and noise level. This results in an offset between the two derived Ca ii K emission index time series, with the Sacramento Peak data being about 3% lower on average than the ISS data. The correlation between the overlapping data sets is 0.88 after removing outliers greater than 2.5 times the standard deviation and after removing yearly and monthly variations.
As a first step in creating the composite, we have adjusted the NSO/Sacramento Peak data to the SOLIS/ISS scale by multiplying the NSO/Sacramento Peak values by 1.032. This scaling factor was determined from the linear regression between the two time series. Figure \irefiss_sp shows the daily values of the two data sets, after the correction was applied. A similar approach is then used to rescale the Kodaikanal data to match the newly adjusted NSO/Sacramento Peak time series. Figure \irefkd-sp_cal shows the high correlation between the annual mean values from both time series, for the 22 years (1978–1999) of overlapping observations. It should be pointed out that this high correlation is due mainly to the strong 11-year cycle component presents in both time series. At shorter time scales the correlation is significantly lower.

The paired data were fit to a linear model, , using a robust least absolute deviation method to mitigate the effect of outliers. The parameters from this model, shown in Figure \irefkd-sp_cal, are then used to rescale the Kodaikanal plage index values into an emission index. The top panel of Figure \irefcomposite shows the monthly mean values of the three data sets after the Kodaikanal time series was linearly scaled. For times when observations were taken at two different observatories the comparison between those measurements, at time scales longer than a month, shows some significant differences. We identified three periods when some discrepancy among the data is visible. A first period of about two years, centered around 1992, where the Sacramento Peak data shows the presence of a more pronounced second maximum in Cycle 22 than indicated by the Kodaikanal data. The presence of this second maximum is also confirmed by other indicators of solar activity, such as the newly released sunspot number time series discussed below and the 10.7 cm radio flux data (e.g. www.ngdc.noaa.gov/stp/solar/flux.html). A second period of about one year, from middle 1985 to middle 1986, shows a peculiar behavior in the Kodaikanal time series in the form of a sudden rise in the plage index value visible in both Figures \irefcomposite and \irefcak_sn. A close inspection indicates that daily calibrated measurements are mostly missing from May 15 to November 14, 1985 and for most of the second semester of 1986. In between, data are sparse and with values that suggest possible calibration issues. The monthly values used here are from the original plage index time series generated by Tlatov, Pevtsov, and Singh (2009), where missing values were linearly interpolated. This approach could potentially introduce some artifacts when, like in this case, several consecutive months of measurements are missing. This aspect will be addressed in a more detailed study of the Ca ii K time series planned for a near future.
Finally, during the extended minimum of Cycles 23/24 (2008 – 2010) the chromospheric emission index derived from the Sacramento Peak measurements is about 1% higher than the corresponding value derived from SOLIS/ISS. It also shows an uncharacteristic flatness that seems to suggest possible issues with those data. On the other hand, as demonstrated in the next section, the minimum in the emission index captured by the SOLIS/ISS data during that period agrees very well with the one from the sunspot number data.
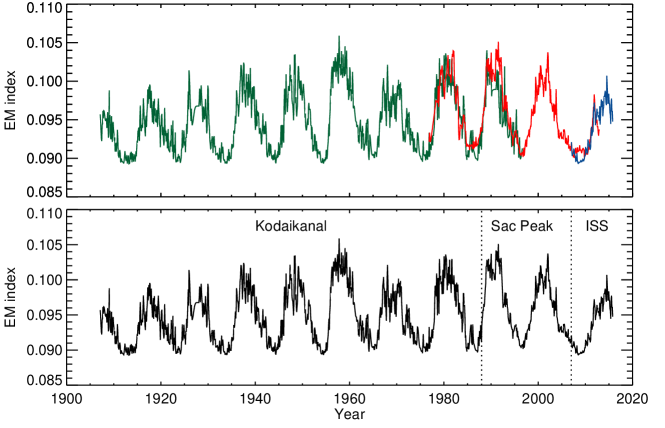
Creating a composite requires to define the boundaries of each time series involved. Ideally, a new segment of the composite should begin at the end of the previous one. However, due to some of the issues discussed above, we followed a slightly different approach. The Kodaikanal data were used until the end of 1987, followed by the Sacramento Peak time series until December 31st, 2006. The ongoing SOLIS/ISS data are then used starting January 1st, 2007. The resulting composite is plotted in the bottom panel of Figure \irefcomposite. The continuity between the various time series is well preserved at the transition points, which are indicated by the two vertical dotted lines. One can notice that at the sunspot minima, between Cycles 21–22 and Cycles 23–24, NSO/Sacramento Peak Ca ii K data appear overestimating the level of the chromospheric activity as compared with KKL and SOLIS/ISS observations. Cancellation within ARs and active nests prevent the growth of plages, reducing the correlation at times of closely packed active Sun. These periods are not included in the composite time series shown in Figure \irefcomposite (bottom panel). While the current proposed series represents a significant first step, the reader should be cautioned that some remaining calibration issues may affect the quality of the proposed composite in some applications.
3 Correlation with the Sunspot Number Time Series
The sunspot number time series provides the longest direct record of the evolution of solar activity, covering a timespan of more than 400 years. This time series has been widely used in solar physics and climate studies. In recent years, however, several criticisms emerged about the consistency and homogeneity of such a long database (Hossfield, 2002; Schaefer, 1997a; Schaefer, 1997b). A major complication is due to the fact that such a time series is constructed by combining observations taken from different observers, with different instruments, and reduced using different processing techniques. A major effort was undertaken a few years ago through a series of workshops dedicated to address most of those issues (Cliver, Clette, and Svalgaard, 2013). The compendium of this endeavor is summarized in a paper by Clette et al. (2015), and by the release of a new revised sunspot number time series.
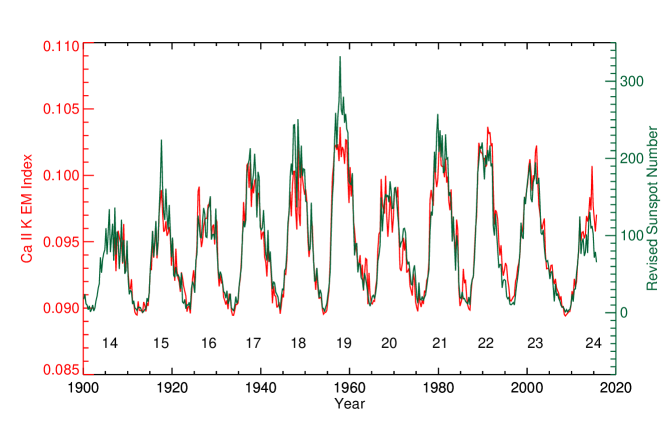
The new time series is available from the Sunspot Index and Long-term Solar Observations (WDC-SILSO) website at http://www.sidc.be/silso/datafiles (Source: WDC-SILSO, Royal Observatory of Belgium, Brussels). Some of the issues that have been addressed in this new release include a correction for the Waldmeier sunspot weighting bias that was affecting the sunspot number counting after 1947 (Svalgaard, 2010), and the RGO-SOON scaling bias occurring after 1975 (Clette et al., 2015). Figure \irefcak_sn shows a comparison between our Ca ii K composite and the sunspot number time series. They were plotted to have a common baseline, defined by their values during periods of minimum of solar activity. The major discrepancy is during maximum of Cycle 19, where the minimum to maximum variation in the sunspot number is significantly higher than observed in the chromospheric emission index derived from the Kodaikanal data. However, as pointed out by Foukal et al. (2009) and Ermolli et al., 2009a, the relative amplitude in the Kodaikanal data during cycle 19 is significantly lower than in other similar time series such as the Ca ii K plage index derived from the Mount Wilson photographic archive of spectroheliograms. A possible explanation is that because the Kodaikanal measurements were taken with a slightly wider spectral passband than those taken at the Mount Wilson Observatory they refer to a deeper level in the solar atmosphere, where plage areas are smaller (Ermolli et al., 2007). Tlatov, Pevtsov, and Singh (2009) also indicated that, because of the narrower spectral bandpass, spot areas present in the Mount Wilson measurements are more difficult to identify and separate from plages.

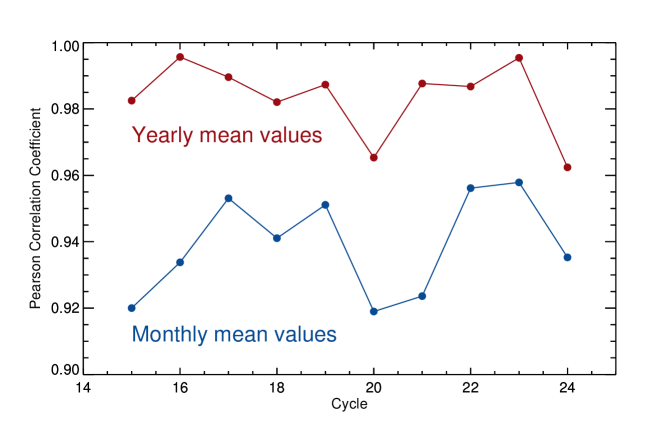
A more detailed analysis of the correlation between chromospheric emission index and sunspot counts is shown in Figure \irefcycle_month. For each solar cycle we computed the Pearson’s correlation coefficient between the monthly mean values of both time series. Only months for which the sunspot number is greater than zero and Ca ii K measurements are available were considered in computing these correlations. As for every ground-based synoptic programs of solar observations, continuity in the Ca ii K data stream may be affected by weather conditions and/or instrumental issues. Consequently, individual monthly averages likely include a different number of observations and therefore the statistical significance of these values may vary. The boundaries for the different solar cycles were taken from en.wikipedia.org/wiki/List_of_solar_cycles. Correlations with the sunspot number plotted in Figure \irefcycle_month exceed 0.92 for all the nine solar cycles, indicating an excellent agreement between the two time series on time scales of a month or longer. It is also interesting to notice that the value of the slope derived from the linear model greatly depends on the strength of the cycle: the stronger is the cycle and the larger is the value of this parameter. We have also repeated the same analysis using the annual mean values of each time series. In this case the correlation significantly improves, reaching values as high as 0.99 for some of the solar cycles. Figure \irefcycle_cor summarizes the results from both analyses. It should be noticed that current solar Cycle 24 has yet to be completed, therefore reducing slightly the significance of the result in this case. There are some interesting facts that can be deduced from a simple inspection of Figure \irefcycle_cor. The highest correlation between sunspot counts and chromospheric emission index is reached during Cycle 23 for both the yearly and monthly mean values. This cycle is only the sixth strongest cycle among those covered by the Ca ii K observations described in this paper, but it shows a well defined double-maximum which is well captured by both time series. Cycle 20 shows the lowest correlation value in both the annual and monthly mean value. This is mainly due to the larger variability in the chromospheric emission index, compared to that of the sunspot count, during the phase of maximum activity of that cycle (see Figure \irefcak_sn). Cycle 16 is an interesting case: it shows the highest correlation coefficient for the annual mean values but a more modest value for the monthly averages compared to other cycles. Figure \irefcak_sn reveals that Cycle 16 was characterized by a quite extended period of maximum of activity, of about five years, distinguished by significant fluctuations in the sunspot counts over periods of few months. Unfortunately, the coverage of the Kodaikanal data during that period was quite poor, resulting in a fragmented monthly series that required interpolation and consequently a reduced correlation with the corresponding sunspot number series. The annual mean values are much less affected by the missing data, which explains the higher correlation coefficient in this case.
4 Conclusions
In this paper we present a preliminary attempt to build an ongoing long-term Ca ii K emission index time series by combining data from three different sets of observations. Systematic observations in the Ca ii K line began in 1907 at the Kodaikanal Observatory (India). While this program is still operational today, significant changes in the instrumentation after 2008 have affected the uniformity of data time series. In particular, the use of a new filter with a much broader bandpass (1.2 Å as compared to the original 0.5Å) makes very difficult to properly cross-calibrate the two subsets. In addition, calibrated public data are only available up to October 2007. Although not used in this investigation, it should be mentioned that a somewhat similar program of observations was also established at the Mount Wilson Observatory between 1915 and 1985, and at other observatories over different periods. Integrated sunlight measurements in the Ca ii K line by the National Solar Observatory (USA) started at the Sacramento Peak Observatory in the early 1970s, and continue today as a part of the Synoptic Optical Long-term Investigations of the Sun (SOLIS) program. Although quite different in nature, we show that the disk-integrated plage index derived from the Kodaikanal measurements correlates well with the NSO/Sacramento Peak 1-Å emission index at time scales as low as one year. For more details about the comparison between the Kodaikanal measurements and other plage-index time series we refer the reader to the papers by Tlatov, Pevtsov, and Singh (2009), Ermolli et al. (2009a), Foukal et al. (2009), and Priyal et al. (2014). The significant overlap between pairs of those observations permits their cross-calibration and the ability to merge them into a single long time series, as discussed in Section 2.4.
This Ca ii K composite covers more than 100 years of observations, or about 11 solar activity cycles. The cycle-to-cycle variations in amplitude of our composite match very well those determined from the recent newly released sunspot number time series, as shown in Figure \irefcak_sn. The only significant exception is for Cycle 19, the strongest cycle covered by this study. As briefly explained in Section 3, a possible explanation is that Kodaikanal measurements during that period were taken with a slightly wider spectral passband. It should be pointed out, however, that the high correlation between these two different time series is not necessary due to a very close relationship between Ca ii K emission index and sunspot number, but rather to the fact that both correlate well with the overall level of solar activity. In fact, this correlation breaks down significantly at time scales of few days. When the analysis is preformed for each cycle separately, as shown in Figures \irefcycle_month-\irefcycle_cor, there is a clear linear relationship between these two quantities. Even at time scales of about a month the Pearson’s correlation coefficient remains quite high. Qualitatively, this could be understood in the following way: the brightness of the chromospheric plages in Ca ii K line (and thus the sun-as-a-star emission index) correlate strongly with the magnetic flux. The sunspot number also correlates with the magnetic flux, but only with its portion represented by sunspots and pores. When the sunspots disappear, the magnetic flux of associated plages does not. Thus, on shorter time scales (days) sunspot number and emission index may not correlate very well with each other. On time scales larger than the typical lifetime of an active region (months), the monthly/yearly sunspot number will provide a good proxy for total magnetic flux in active regions (including plages) and thus, sunspot number and emission index will correlate well with each other. A previous study by Tlatov, Pevtsov, and Singh (2009) has found that the Ca ii K plage index correlate quadratically with the sunspot area, therefore suggesting a non-linear relationship between sunspot numbers and areas. This indicates that further investigations are required for better understanding the complexity of the solar cycle of activity, and its various manifestations.
In a near future we aim to improve the quality of this composite, and make it publicly available to the solar community. For example, the presence of daily gaps in the Kodaikanal time series could be mitigated by using a combination of data from other databases, such as the Mount Wilson archive of spectroheliograms. This will improve the statistical significance of the monthly and annual average values. Also, a more detailed comparison of the daily measurements obtained from different observatories should address some of the issues discussed in Ermolli et al. (2009a). An improved Ca ii K composite will also offer a more powerful tool to understand better the physical significance of the sunspot counts.
Acknowledgments
This work utilizes SOLIS/ISS data obtained by the NSO Integrated Synoptic Program (NISP), managed by the National Solar Observatory, which is operated by the Association of Universities for Research in Astronomy (AURA), Inc. under a cooperative agreement with the National Science Foundation. The sunspot number data are provided by WDC-SILSO, Royal Observatory of Belgium, Brussels. We thank the anonymous referee for insightful comments that led to a significant improvement of the overall quality of the article.
References
- Babcock and Babcock (1955) Babcock, H.W., Babcock, H.D.: 1955, The Sun’s Magnetic Field, 1952-1954. ApJ 121, 349. DOI. ADS.
- Balasubramaniam and Pevtsov (2011) Balasubramaniam, K.S., Pevtsov, A.: 2011, Ground-based synoptic instrumentation for solar observations. In: Fineschi, S., Fennelly, J. (eds.) Solar Physics and Space Weather Instrumentation IV., Proc. SPIE 8148, 814809. DOI. ADS.
- Bertello, Ulrich, and Boyden (2010) Bertello, L., Ulrich, R.K., Boyden, J.E.: 2010, The Mount Wilson Ca ii K Plage Index Time Series. Sol. Phys. 264, 31. DOI. ADS.
- Bertello et al. (2011) Bertello, L., Pevtsov, A.A., Harvey, J.W., Toussaint, R.M.: 2011, Improvements in the Determination of ISS Ca ii K Parameters. Sol. Phys. 272, 229. DOI. ADS.
- Centrone, Ermolli, and Giorgi (2005) Centrone, M., Ermolli, I., Giorgi, F.: 2005, Image processing for the Arcetri Solar Archive. Mem. Soc. Astron. Italiana 76, 941. ADS.
- Clette et al. (2015) Clette, F., Svalgaard, L., Vaquero, J.M., Cliver, E.W.: 2015, In: Balogh, A., Hudson, H., Petrovay, K., von Steiger, R. (eds.) Revisiting the Sunspot Number, 35. DOI. ADS.
- Cliver, Clette, and Svalgaard (2013) Cliver, E.W., Clette, F., Svalgaard, L.: 2013, Recalibrating the Sunspot Number (SSN): The SSN Workshops. Central European Astrophysical Bulletin 37, 401. ADS.
- de Vaucouleurs (1968) de Vaucouleurs, G.: 1968, Linearization of characteristic curves in photographic photometry. Appl. Opt. 7, 1513. ADS.
- Domingo et al. (2009) Domingo, V., Ermolli, I., Fox, P., Fröhlich, C., Haberreiter, M., Krivova, N., Kopp, G., Schmutz, W., Solanki, S.K., Spruit, H.C., Unruh, Y., Vögler, A.: 2009, Solar Surface Magnetism and Irradiance on Time Scales from Days to the 11-Year Cycle. Space Sci. Rev. 145, 337. DOI. ADS.
- Ermolli, Criscuoli, and Giorgi (2011) Ermolli, I., Criscuoli, S., Giorgi, F.: 2011, Recent results from optical synoptic observations of the solar atmosphere with ground-based instruments. Contributions of the Astronomical Observatory Skalnate Pleso 41, 73. ADS.
- Ermolli et al. (2007) Ermolli, I., Tlatov, A., Solanki, S.K., Krivova, N.A., Singh, J.: 2007, Solar Activity and Irradiance Studies with Ca II Spectroheliograms: Potential and Problems. In: Heinzel, P., Dorotovič, I., Rutten, R.J. (eds.) The Physics of Chromospheric Plasmas, Astronomical Society of the Pacific Conference Series 368, 533. ADS.
- Ermolli et al. (2009a) Ermolli, I., Solanki, S.K., Tlatov, A.G., Krivova, N.A., Ulrich, R.K., Singh, J.: 2009a, Comparison Among Ca II K Spectroheliogram Time Series with an Application to Solar Activity Studies. ApJ 698, 1000. DOI. ADS.
- Ermolli et al. (2009b) Ermolli, I., Marchei, E., Centrone, M., Criscuoli, S., Giorgi, F., Perna, C.: 2009b, The digitized archive of the Arcetri spectroheliograms. Preliminary results from the analysis of Ca II K images. A&A 499, 627. DOI. ADS.
- Fontenla, Stancil, and Landi (2015) Fontenla, J.M., Stancil, P.C., Landi, E.: 2015, Solar Spectral Irradiance, Solar Activity, and the Near-Ultra-Violet. ApJ 809, 157. DOI. ADS.
- Fontenla et al. (2011) Fontenla, J.M., Harder, J., Livingston, W., Snow, M., Woods, T.: 2011, High-resolution solar spectral irradiance from extreme ultraviolet to far infrared. Journal of Geophysical Research (Atmospheres) 116, D20108. DOI. ADS.
- Foukal (1998) Foukal, P.: 1998, Extension of the F10.7 Index to 1905 using Mt. Wilson Ca K Spectroheliograms. Geophys. Res. Lett. 25, 2909. DOI. ADS.
- Foukal (2003) Foukal, P.: 2003, Can Slow Variations in Solar Luminosity Provide Missing Link Between the Sun and Climate? EOS Transactions 84, 205. DOI. ADS.
- Foukal et al. (2009) Foukal, P., Bertello, L., Livingston, W.C., Pevtsov, A.A., Singh, J., Tlatov, A.G., Ulrich, R.K.: 2009, A Century of Solar Ca ii Measurements and Their Implication for Solar UV Driving of Climate. Sol. Phys. 255, 229. DOI. ADS.
- Fröhlich and Lean (2004) Fröhlich, C., Lean, J.: 2004, Solar radiative output and its variability: evidence and mechanisms. A&A Rev. 12, 273. DOI. ADS.
- Garcia et al. (2011) Garcia, A., Sobotka, M., Klvaňa, M., Bumba, V.: 2011, Synoptic observations with the Coimbra spectroheliograph. Contributions of the Astronomical Observatory Skalnate Pleso 41, 69. ADS.
- Haigh and Blackburn (2006) Haigh, J.D., Blackburn, M.: 2006, Solar Influences on Dynamical Coupling Between the Stratosphere and Troposphere. Space Sci. Rev. 125, 331. DOI. ADS.
- Hanaoka (2013) Hanaoka, Y.: 2013, Long-term synoptic observations of the Sun at the National Astronomical Observatory of Japan. Journal of Physics Conference Series 440(1), 012041. DOI. ADS.
- Hasan et al. (2010) Hasan, S.S., Mallik, D.C.V., Bagare, S.P., Rajaguru, S.P.: 2010, Solar Physics at the Kodaikanal Observatory: A Historical Perspective. Astrophysics and Space Science Proceedings 19, 12. DOI. ADS.
- Hossfield (2002) Hossfield, C.H.: 2002, A History of the Zurich and American Relative Sunspot Number Indices. Journal of the American Association of Variable Star Observers (JAAVSO) 31, 48. ADS.
- Keil and Worden (1984) Keil, S.L., Worden, S.P.: 1984, Variations in the solar calcium K line 1976-1982. ApJ 276, 766. DOI. ADS.
- Lefebvre et al. (2005) Lefebvre, S., Ulrich, R.K., Webster, L.S., Varadi, F., Javaraiah, J., Bertello, L., Werden, L., Boyden, J.E., Gilman, P.: 2005, The solar photograph archive of the Mount Wilson Observatory. A resource for a century of digital data. Mem. Soc. Astron. Italiana 76, 862. ADS.
- Loukitcheva, Solanki, and White (2009) Loukitcheva, M., Solanki, S.K., White, S.M.: 2009, The relationship between chromospheric emissions and magnetic field strength. A&A 497, 273. DOI. ADS.
- Makarov et al. (2004) Makarov, V.I., Tlatov, A.G., Singh, J., Gupta, S.S.: 2004, 22-years magnetic cycle in polar activity of the Sun. In: Stepanov, A.V., Benevolenskaya, E.E., Kosovichev, A.G. (eds.) Multi-Wavelength Investigations of Solar Activity, IAU Symposium 223, 125. DOI. ADS.
- Mein and Ribes (1990) Mein, P., Ribes, E.: 1990, Spectroheliograms and motions of magnetic tracers. A&A 227, 577. ADS.
- Ortiz and Rast (2005) Ortiz, A., Rast, M.: 2005, How good is the Ca II K as a proxy for the magnetic flux? Mem. Soc. Astron. Italiana 76, 1018. ADS.
- Pevtsov, Bertello, and Marble (2014) Pevtsov, A.A., Bertello, L., Marble, A.R.: 2014, The sun-as-a-star solar spectrum. Astronomische Nachrichten 335, 21. DOI. ADS.
- Pevtsov et al. (2016) Pevtsov, A.A., Virtanen, I., Mursula, K., Tlatov, A., Bertello, L.: 2016, Reconstructing solar magnetic fields from historical observations. I. Renormalized Ca K spectroheliograms and pseudo-magnetograms. A&A 585, A40. DOI. ADS.
- Priyal et al. (2014) Priyal, M., Singh, J., Ravindra, B., Priya, T.G., Amareswari, K.: 2014, Long Term Variations in Chromospheric Features from Ca-K Images at Kodaikanal. Sol. Phys. 289, 137. DOI. ADS.
- Scargle, Keil, and Worden (2013) Scargle, J.D., Keil, S.L., Worden, S.P.: 2013, Solar Cycle Variability and Surface Differential Rotation from Ca II K-line Time Series Data. ApJ 771, 33. DOI. ADS.
- Schaefer (1997a) Schaefer, B.E.: 1997a, Automaticc Inflation in the AAVSO Sunspot Number. Journal of the American Association of Variable Star Observers (JAAVSO) 26, 40. ADS.
- Schaefer (1997b) Schaefer, B.E.: 1997b, Improvements for the AAVSO Sunspot Number. Journal of the American Association of Variable Star Observers (JAAVSO) 26, 47. ADS.
- Schrijver et al. (1989) Schrijver, C.J., Cote, J., Zwaan, C., Saar, S.H.: 1989, Relations between the photospheric magnetic field and the emission from the outer atmospheres of cool stars. I - The solar CA II K line core emission. ApJ 337, 964. DOI. ADS.
- Solanki, Krivova, and Haigh (2013) Solanki, S.K., Krivova, N.A., Haigh, J.D.: 2013, Solar Irradiance Variability and Climate. ARA&A 51, 311. DOI. ADS.
- Svalgaard (2010) Svalgaard, L.: 2010, Updating the Historical Sunspot Record. In: Cranmer, S.R., Hoeksema, J.T., Kohl, J.L. (eds.) SOHO-23: Understanding a Peculiar Solar Minimum, Astronomical Society of the Pacific Conference Series 428, 297. ADS.
- Tlatov, Pevtsov, and Singh (2009) Tlatov, A.G., Pevtsov, A.A., Singh, J.: 2009, A New Method of Calibration of Photographic Plates from Three Historic Data Sets. Sol. Phys. 255, 239. DOI. ADS.
- Wallace, Hinkle, and Livingston (2007) Wallace, L., Hinkle, K., Livingston, W.: 2007, An Atlas of the Spectrum of the Solar Photosphere from 13,500 to 33,980 cm-1 (2942 to 7405 Å). ADS.
- White and Livingston (1978) White, O.R., Livingston, W.: 1978, Solar luminosity variation. II - Behavior of calcium H and K at solar minimum and the onset of cycle 21. ApJ 226, 679. DOI. ADS.
- Wilson (1968) Wilson, O.C.: 1968, Flux Measurements at the Centers of Stellar h- and K-Lines. ApJ 153, 221. DOI. ADS.