Synthesis, phase stability, structural and physical properties of 11-type iron chalcogenides
Abstract
This article reviews recent experimental investigations on two binary Fe-chalcogenides: FeSe and Fe1+yTe. The main focus is on synthesis, single crystal growth, chemical composition, as well as on the effect of excess iron on structural, magnetic, and transport properties of these materials. The structurally simplest Fe-based superconductor Fe1+xSe with a critical temperature 8.5 K undergoes a tetragonal to orthorhombic phase transition at a temperature 87 K. No long-range magnetic order is observed down to the lowest measured temperature in Fe1+xSe. On the other hand, isostructural Fe1+yTe displays a complex interplay of magnetic and structural phase transitions in dependence on the tuning parameter such as excess amount of Fe or pressure, but it becomes a superconductor only when Te is substituted by a sufficient amount of Se. We summarize experimental evidence for different competing interactions and discuss related open questions.
I Introduction
The discovery of superconductivity in LaFeAsO1-xFx with a = 26 K by Kamihara kam2008 unveiled a new field of research generally referred to Fe-based superconductors (Fe-SC). Several new superconducting phases have been discovered with highest of 56 K achieved so far in bulk samples. Ren2008 ; Wan2008 . Among the different families of Fe-SC, FeSe (11-type chalcogenide) has the simplest crystal structure Hsu2008 . The atomic structure belongs to the tetragonal space group and consists of edge-sharing FeSe4 tetrahedra, which form layers orthogonal to the -axis. The bulk of Fe1+xSe is 8.5 K at ambient conditions, with the superconducting properties being extremely sensitive to the amount of excess Fe Mc2009 . The of FeSe can be increased to as high as 37 K by the application of hydrostatic pressure Miz2008 ; Med2009 ; Mar2009 ; Ima2009 ; Sid2009 . This makes Fe1+xSe a member of the high- class of compounds. Fe1+xSe does not order magnetically, but spin fluctuations were detected by nuclear magnetic resonance (NMR) measurements Ima2009 . The spin fluctuations are found to be strongly increased near , and applied pressure seems to enhance the spin fluctuations along with the superconducting transition temperature Ima2009 . On the other hand, of FeSe can also be increased by Te substitution of Se, up to a maximum of 15 K for Fe1+ySe0.5Te0.5 Yeh2008 ; Fan2008 ; Ros2010 ; Che2015a . The superconducting volume fraction decreases with increasing Te and no superconductivity has been found so far in bulk samples of the end-member Fe1+yTe.
It is also important to mention that a monolayer of FeSe on a SrTiO3 substrate becomes superconducting with in the range of 65-100 K Yan2012 ; He2013 ; Tan2013 ; Ge2015 ; Fan2015 . Angle resolved photoemission spectroscopic (ARPES) measurements observed its Fermi surface being distinct from other iron-based superconductors, consisting only of electron-like pockets near the zone corner without indication of any hole-like Fermi surface around the point He2013 ; Liu2013 . The high- in the FeSe monolayer likely originates from an electron doping by the substrate at the interface thereby modifying the Fermi surface Tan2013 ; Bang2013 . Although the properties of FeSe monolayers are extremely interesting, here we limit ourselves to bulk materials only. Further, this article gives by no means a complete review of the vast existing literature on Fe-chalcogenides, it only provides an overview with emphasis on the composition and homogeneity of the samples.
II FeSe
In the literature, there has been some confusion concerning the nomenclature of the tetragonal FeSe. In this article, following the early publications of the binary phase diagram of FeSe Sch1979 ; Oka1991 , the tetragonal FeSe is referred to as -FeSe.
II.1 Synthesis and characterization
Although the binary phase diagram of Fe1+xSe was known for about three decades Sch1979 ; Oka1991 , the interest in this compound rose tremendously when superconductivity was found in FeSe1-δ by Hsu et al. Hsu2008 . These polycrystalline samples were synthesized by mixing high-purity Se and Fe powder and carrying out the reaction at 700∘C, which is slightly above the boiling point of Se (for the detailed synthesis procedure see Ref. Hsu2008 ). Superconductivity was reported for highly Se deficient samples FeSe0.82. The x-ray diffraction pattern of these samples displayed several impurity phases as well as unknown phases. This work was followed by a combined x-ray and neutron diffraction study which reported a composition for the superconductor as FeSe0.92 Mar2008 . Both these compositions fall outside of the composition reported in Ref. Sch1979 ; Oka1991 for the binary phase diagram of -FeSe.
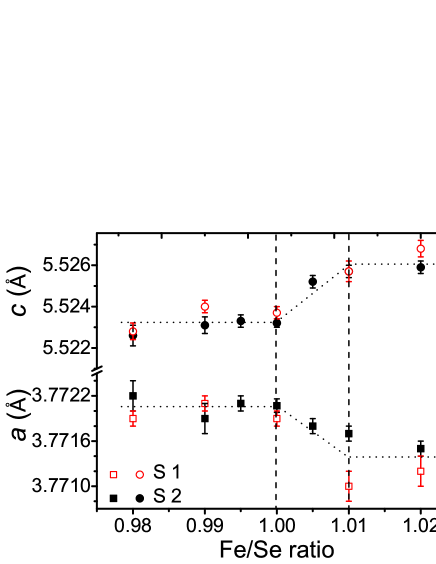
Alternatively, McQueen et al. Mc2009 considered stoichiometric FeSe samples. They used two different temperature steps of 750∘C and 1025∘C, respectively, before cooling the sample to 420∘C, followed by subsequent quenching of the sample to -13∘C Mc2009 ; Wil2009 . This procedure yielded FeSe samples free of impurities. Further, McQueen et al. Mc2009 reported that Fe1.01Se and Fe1.02Se are superconductors with = 8.5 K and 5 K, respectively, whereas Fe1.03Se is not a superconductor at all. A more detailed comparison Pom2009 on samples synthesized by the above mentioned two different routes concluded that a stable phase exhibiting superconductivity at 8 K exists in a narrow range of selenium concentration FeSe0.974±0.005 ( Fe1.027±0.005Se). More recently, Koz et al. Koz2014 synthesized FeSe by following the procedure described in Ref. Mc2009 and starting from the nominal compositions of the Fe:Se ratio in the range 0.98 - 1.02. The lattice parameters obtained from the x-ray diffraction of these samples are presented in Fig. 1. It can be seen in Fig.1 that the stability range of Fe1+xSe narrows the nominal composition range to . Thus, the composition of iron selenide lies in the range Fe1.00Se to Fe1.01Se, and is referred to hereafter as -FeSe.
II.2 Single crystal growth
Different methods have been attempted for the growth of single crystals of FeSe. These methods include vapor self transport Pat2009 ; alkali-halide-flux growth with KCl (or KBr) Mok2009 ; Gor2012 , NaCl/KCl Zha2009 , LiCl/CsCl Hu2011 , or KCl/AlCl3 Cha2013 ; Boe2013 ; the Bridgman technique Yan2011 ; the traveling-solvent float zone technique Ma2014 ; chemical vapor transport with I2 Kar2012 , TeCl4 Har2010 , or FeBr3 Wu2013 ; a cubic-anvil high-pressure technique Wu2013 ; and chemical vapor transport with AlCl3 Koz2014 . Many of these techniques did not yield high-quality single crystals of FeSe. For instance, for single crystals growth with only alkali-halide flux Zha2009 ; Hu2011 as well as by the Bridgman technique Yan2011 , impurities like -Fe1-ySe and -Fe were reported. In addition, FeSe crystals grown by the Bridgman method Yan2011 showed a dendrite-like morphology. Further, the magnetization hysteresis loops suggested the presence of ferromagnetic impurities Pat2009 ; Hu2011 .
Among the above-mentioned different methods, two procedures turned out to be successful in growing high-quality single crystals of FeSe, either by utilizing a eutectic mixture of KCl and AlCl3 Cha2013 ; Boe2013 ; Lin2011 ; Huy2014 or chemical vapor transport performed with AlCl3 Koz2014 . In the former method, Böhmer et al. Boe2013 took powders of Fe and Se in an atomic ratio of 1.1:1. The powders were put in an evacuated SiO2 ampule together with an eutectic mixture of KCl and AlCl3. The ampoule was heated to 390∘C on one end while the other end was kept at 240∘C. After 28.5 days isometric FeSe crystals with tetragonal morphology were extracted at the colder end of the ampule. The level of impurities in these single crystals was found to be less than 500 ppm. The single crystals grown by this method were utilized in several sophisticated physical experiments Mal2014 ; Ter2014 ; Shi2014 ; Kas2014 ; Zha2015 ; Kn2015 ; Wat2015 ; Boe2015 ; Wat2015b ; Wata2015 to explore the electronic properties of FeSe.
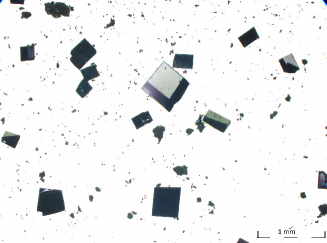
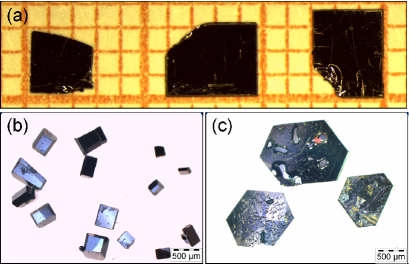
Alternatively, Koz et al. Koz2014 grew single crystals of FeSe by chemical vapor transport using only very small quantities of AlCl3 as transport reagent. In their method, 1 g of stoichiometric FeSe powder was taken along with 20 mg of AlCl3 in an evacuated quartz ampule. The ampule was placed in a two-zone furnace at temperatures = 400∘C and = 300∘C. The growth was typically carried out for 2-3 months. Finally, the ampule was quenched in water to room temperature. The product contained plate-like crystals with tetragonal morphology (see Fig. 2) with edge lengths up to 0.5 mm and a maximum thickness of 0.01 mm. The crystals were repeatedly washed with ethanol to remove any remaining condensed gas phase, dried under vacuum, and stored in argon-filled glove boxes. By extending the growth time to 1 year, larger single crystals with dimensions up to 4 2 0.03 mm3 were grown Koz2014 . The single crystals were characterized by x-ray diffraction, wave length dispersive x-ray spectroscopy, and electron diffraction. The results of these experiments proved a high quality of the single crystals and hence, the amount of impurities present in the sample was assumed to be below the detection limit of these physical measurements. Further, topography measured by scanning tunneling microscopy displayed large surfaces free of impurities and defects Ros2015 . In addition to these methods, magnetization measurements at room temperature were utilized to estimate the amount of elemental Fe in the samples. According to these estimates, the best polycrystalline samples contained between 100 and 300 ppm elemental iron Koz2014 . The bulk nature of superconductivity in the crystals was confirmed by specific heat measurements Koz2014 . Typical values for the residual resistivity ratio / are found to be in the range 22-27 for these crystals.
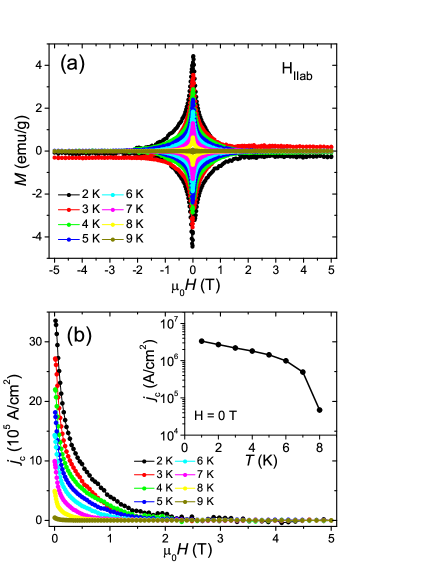
The single crystals grown by the above method are free of magnetic impurities as can be seen from the magnetization isotherms . Exemplary curves measured for a -FeSe single crystal below 10 K are plotted in Fig. 3(a) Koz2015 . A typical superconducting magnetic hysteresis curve is observed below = 8.5 K. There is no indication of a second peak (fishtail effect) within the measured field range. In contrast, such a fishtail feature was observed for tetragonal FeTe0.6Se0.4 Yad2009 . From the loops, the critical current density, , can be calculated by using the Bean critical state model Bea1962 ; Bea1964 :
in which . Here, and are the measured with increasing and decreasing field, respectively, whereas and () are the dimensions of the rectangular cross section of the crystal normal to the applied field. Here, the field is applied perpendicular to the -axis. For the present crystal, = 0.003 cm and = 0.13 cm. Since the measured crystal is a very thin plate and the applied field is parallel to the long axis, the demagnetization factor was assumed to be negligible. Fig. 3(b) presents the critical current density at several temperatures as a function of field. The calculated from our curves at zero field is 106 A/cm2 at 2 K, which is higher than the previously reported values for -FeSe Son2011 ; Lei2011 ; Oza2012 ; Ding2012 but similar to other iron based superconductors Yad2009 ; Ding2012 ; Yan2008 ; Tae2009 . The inset of Fig. 3 (b) shows the critical current density as a function of temperature. is uniformly decreasing up to 7 K but still amounts to 104 A/cm2 at 8 K.
II.3 Structural phase transition and nematicity
One of the features of the parent compounds of Fe-SC is that they undergo a tetragonal to orthorhombic structural phase transition at a temperature . The structural phase transition can either occur simultaneously with a spin density wave transition at a Néel temperature = , or they are split such that , see for details Refs. Lum2010 ; Joh2010 ; Ste2011 . At , the materials develop a large in-plane anisotropy in the resistivity Chu2010 ; Fis2011 , ., a spontaneous breaking of the rotational symmetry, while preserving the translational symmetry of the underlying electronic system. This large in-plane electronic anisotropy is termed nematicity and the terms “structural transition” and “nematic transition” have become synonyms in the literature. However, the origin of the nematic state is highly controversial Fer2014 because such a transition can be induced by either phonons, or orbital or spin fluctuations. Understanding the exact nature of this phase transition is considered highly important for obtaining insight into the mechanism of superconductivity as well as the symmetry of the superconducting order parameter Fer2014 .
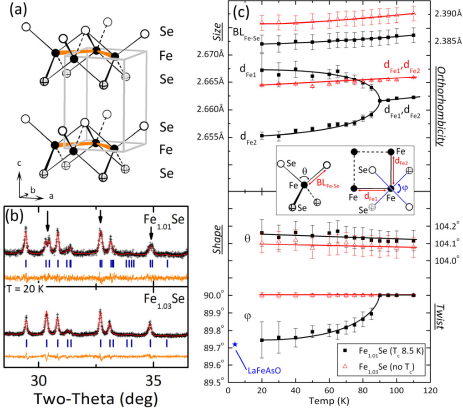
-FeSe is deemed to be an ideal candidate material for addressing the origin of the nematic transition in Fe-SC. At room temperature, it has a tetragonal structure with a space group . It exhibits a transition to an orthorhombic phase at = 87 K Mar2008 ; Pom2009 ; Mc2009 ; Mil2009 , but does not order magnetically down to 2 K. The structural parameters for Fe1.01Se and Fe1.03Se obtained by McQueen et al. are reproduced in Fig. 4 from Ref. Mc2009b . In Fig 3(a), the tetragonal structure of FeSe is presented. The superconducting Fe1.01Se has an orthorhombic distortion, indicated by the splitting of some peaks in the synchrotron x-ray diffraction (SXRD) pattern, Fig. 4(b). The orthorhombic distortion is due to coherent twisting of the upper and lower Se pairs away from the ideal angle of 90∘. It can be described by five parameters: the torsional angle between the Se pairs (), two Fe-Fe distances ( and ), the Fe-Se bond length (BLFe-Se), and the upper Se-Fe-Se angle () Mc2009b . The temperature-dependence of these parameters is shown in Fig. 4(c). It is interesting to note that the structural transition is found only in the superconducting Fe1.01Se, but not in the non-superconducting Fe1.03Se Mc2009b . Therefore, an observation of this structural transition can be considered as a good test for the composition of FeSe samples. The single crystals of FeSe grown by KCl/AlCl3 flux Boe2013 and chemical vapor transport with AlCl3 Koz2014 , both displayed the orthorhombic phase transition.
The origin of the structural phase transition in FeSe nonetheless remains controversial. Although -FeSe does not display a long-range magnetic order, signatures of spin-fluctuations have been detected in NMR Ima2009 ; Boe2015 ; Bae2015 , magnetic susceptibility Ros2015 , and inelastic neutron scattering experiments Rah2015 ; Wan2016 . The latter measurements, when performed at an energy of 13 meV did not show any variation in spin-fluctuations across the structural phase transition Rah2015 . The highly dispersive paramagnetic fluctuations found along (,0) in the Fe-square lattice extending beyond 80 meV in energy suggested that FeSe is close to an instability towards (,0) antiferromagnetism that is characteristic of the parent phases of the Fe-pnictide superconductors Rah2015 . In contrast, an inelastic neutron scattering experiment Wan2016 conducted at low energies of 2.5 meV on single crystalline FeSe found an onset of the dynamical spin correlation function at the orthorhombic phase transition. The temperature evolution of was compared with the orthorhombic distortion, , where and are the lattice parameters of FeSe. The results indicated that the enhancement of is coupled to the orthorhombic phase, which is consistent with the theoretical proposals of a nematic order driven by spin fluctuations Yu2015 ; Gla2015 ; Wang2015 ; Chu2015 .
Alternatively, an orbital-driven nematic scenario was favored by the results based on NMR experiments Boe2015 ; Bae2015 , in which, unlike the neutron scattering, probe only momentum-integrated spin fluctuations at very low energies. The spin-lattice relaxation rate measured in those NMR experiments starts to diverge at temperatures significantly lower than the structural transition temperature of 87 K. Based on this fact, Böhmer et al. argued that the spin-fluctuations are not the driving force of the structural phase transition Boe2015 . Further, Baek et al. observed an order-parameter-like temperature dependence of the Knight shift when measured with magnetic field applied parallel to the crystallographic axis Bae2015 . Since the Knight shift is proportional to the orbital-order parameter, they concluded that the nematicity in FeSe is driven by orbital order. Several ARPES experiments reported a 50 meV splitting of and bands Shi2014 ; Zha2015 ; Wat2015 ; Nak2014 ; Suz2015 , which is considered as an evidence of nematicity. On the other hand, the first ARPES measurement on FeSe Mal2014 contradicted the above results by claiming that all observed ARPES spectral features can be explained by regular band structure calculations, therefore they do not provide any evidence for nematic order. Further, it was shown that even though a band splitting of 50 meV was found in the energy dispersive curves, by taking into account the intrinsic widths of these peaks, the possible remaining splitting was estimated to be in the order of 5 meV Bor2015 . Note that this is a reasonable estimation of an energy scale of the structural phase transition occurring at 87 K.
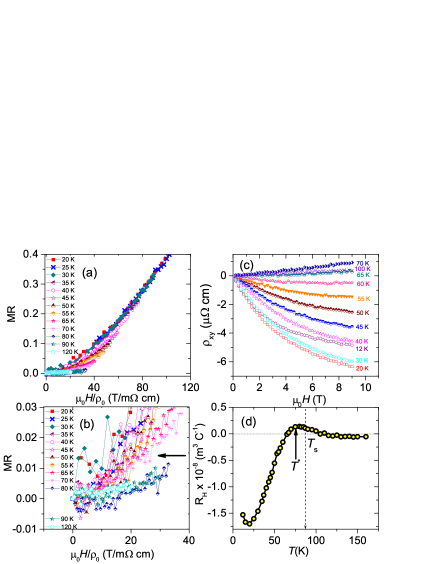
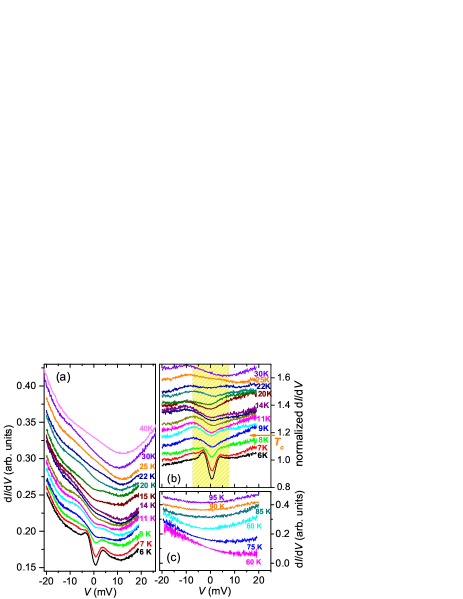
Albeit the above discussed controversial results concerning the origin of the tetragonal-orthorhombic phase transition, the two different Fe-Fe distances () in the orthorhombic phase, see Fig. 4, have the following consequence: due to the non-equal Fe-Fe distances, the orbital occupancies of the and orbitals are not equal, i.e., , usually described as orbital order or nematicity. However, such a preferential partial occupation of one of the / orbitals might induce additional reconstructions of the Fermi surface, a Peierls-type dimerization or an onset of some type of density wave Ros2015 . Both types would spontaneously break the translational symmetry of the lattice. An early electron diffraction experiment Mc2009b on FeSe indeed reported the actual symmetry of FeSe below 20 K is lower than that of . Based on telltale signs in the magnetoresistance and Hall effect measurements (Fig. 5) as well as scanning tunneling spectra (Fig. 6) on the single crystals grown by chemical vapor transport Koz2014 , we identified the emergence of an incipient ordering mode and its nucleation Ros2015 . The onset temperature 75 K of this ordering mode is clearly lower than the structural transition temperature = 87 K, and therefore must be of different origin. The temperature was identified from the temperature at which (i) an onset of spin fluctuations was found in magnetic susceptibility and NMR measurements; (ii) an enhancement of positive magnetoresistance was observed; (iii) a deviation from the Kohler’s scaling , which could be seen in Figs. 4 (a) and (b); (iv) the Hall resistivity deviates from linearity, Fig. 5(c); (v) an inflection in the temperature dependence of the initial Hall coefficient could be obtained, Fig. 5(d); (vi) the tunneling spectra develop an asymmetry, Fig. 6 (c), suggesting a non-compensation of occupied (electron-like) and unoccupied (hole-like) states. Here we would like to mention that several other groups reported a similar behavior of the Hall coefficient measured on single crystals grown by different methods Huy2014 ; Kas2014 ; Wat2015b ; Lei2012 ; Sun2016 indicating that the behavior is intrinsic, and not sample dependent. While Refs. Huy2014 ; Kas2014 ; Wat2015b attributed the negative values of at low temperature to an enhanced mobility of the electrons in a compensated metal, Refs. Ros2015 ; Lei2012 considered an increased number of negative charge carriers at low temperatures. The latter interpretation is also supported by a negative sign of the Seebeck coefficient found at low temperatures for FeSe Mc2009 ; Kas2014 ; Son2011 . A screening for further evidences for an emerging ordering mode at in other measurements reported in literature revealed that such signs were not identified as a separate feature different from the nematicity. For instance, a negative value of the Seebeck coefficient was observed at , see supplementary information in Ref. Kas2014 . Further, the sign of the elastoresisitance tensor changes sign at 65 K Wat2015 and the resistivity anisotropy peaks at around 70 K Tan2015 . In both Refs. Wat2015 and Tan2015 , the behavior was attributed to anisotropic inelastic scattering originating from the enhanced spin fluctuations at the respective temperatures.
In our measurements Ros2015 , we speculated about another temperature scale 22 - 30 K, marked by the opening up of a partial gap of about 8 meV (Fig. 6 b) in tunneling spectra as well as a recovery of Kohler’s scaling (Fig. 5a). Based on these results we suggested that represents the onset of an incipient order associated with enhanced spin fluctuations. Static nucleation of this mode below a second temperature appears to result in a coupling between electronic charge, orbital, and pocket degrees of freedom Jian2011 at this temperature which is discernible in anomalies of transport data and tunneling spectra. The temperature may also be related to the translational symmetry breaking found in electron diffraction experiments Mc2009b .
II.4 Superconductivity
When a new superconducting compound is discovered, typically the two main foci of research are i) how to further enhance the transition temperature ?, and ii) what is the superconducting pairing mechanism ? In the case of FeSe, has been enhanced from 8.5 K to 37 K by the application of pressure Miz2008 ; Med2009 ; Mar2009 ; Ima2009 ; Sid2009 , and to 65 - 100 K by growing FeSe monolayers on SrTiO3 substrates Yan2012 ; He2013 ; Tan2013 ; Ge2015 ; Fan2015 . The superconducting pairing mechanism, however, still remains elusive. The symmetry of the superconducting order parameter is still under dispute Hir2011 ; Hir2016 , but most researchers favor an unconventional symmetry with a sign change of the order parameter between the hole and the electron bands mediated by either nesting-induced spin Maz2008 ; Kur2008 ; Wan2009 or orbital fluctuations Kon2010 . All these theories are based on multi-orbital models. For FeSe, the density functional calculations yield two intersecting elliptical electron Fermi surfaces at the corner of the Brillouin zone and two concentric hole cylinders at the zone center Sub2008 . Nevertheless, experimental observation of the Fermi surfaces of FeSe by ARPES and quantum oscillation experiments deviate significantly from those obtained by band structure calculations. Quantum oscillation experiments at low temperatures have detected extremely small Fermi surfaces Ter2014 ; Wat2015 ; Wat2015b ; Aud2015 . Several ARPES experiments detected only one small hole pocket at the zone center and one electron pocket at the zone corner Mal2014 ; Shi2014 ; Zha2015 ; Wat2015 ; Nak2014 ; Suz2015 . Concerning the hole pocket, the quantum oscillations are in agreement with the ARPES experiments, but the electron pocket measured in the two experiments appear to be different. Based on their combined results of the quantum oscillations and ARPES, Watson et al. Wat2015 ; Wat2015b suggested a scenario with two electron pockets and one hole pocket crossing the Fermi energy. In any case, experimentally detected Fermi surfaces so far did not provide any evidence for nesting of the Fermi surfaces in FeSe.
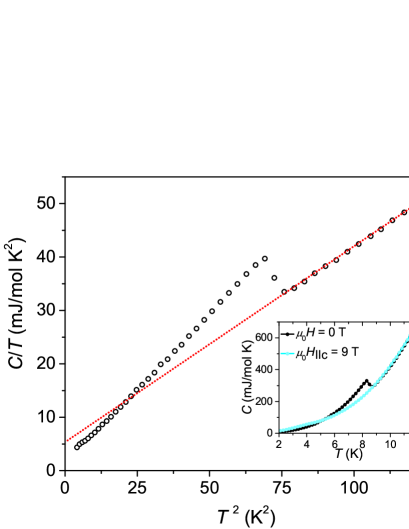
Now we turn to some experiments which shed light on the symmetry of the superconducting order parameter in FeSe. In Fig. 7, the heat capacity measurement on a FeSe single crystal grown by chemical vapor transport Koz2014 is presented. The inset shows the measured in fields of 0 and 9 T with the field applied parallel to the -axis. By fitting taken at 9 T in the temperature range 5 - 13 K to , the coefficient of the electronic contribution to the specific heat in the normal state is estimated to be 5.11(11) mJ/mole K2. This value is also comparable to the extrapolation of the zero-field, high-temperature (-data (red dotted line in Fig. 7). By the balance of entropy around the superconducting transition, the dimensionless specific-heat jump at is determined as Koz2015 . This value is significantly higher than the Bardeen-Cooper-Schrieffer (BCS) value of 1.43 for the weak electron-phonon coupling scenario Bar1957 . A more detailed analysis of the specific heat data by Lin et al. Lin2011 found an isotropic gap of = 1.33 meV on the hole Fermi sheets and an extended -wave gap with = 1.13 meV and = 0.78 on the electron Fermi sheets. Further, the London penetration depth calculated from the temperature () dependence of the lower critical fields could not be fitted to a single-gap BCS model Abd2013 . This -dependence could be described by using either a two-band model with -wave-like gaps of magnitudes = 0.410.1 meV and = 3.330.25 meV or a single anisotropic -wave order parameter Abd2013 . Two-gap behavior was also reported based on the superfluid density measurements using muon-spin rotation Kha2010 . Thermal conductivity measurements on single crystalline FeSe also report two node-less superconducting gaps Dong2009 ; Hop2016 . In any case, these bulk measurements support two superconducting gaps without nodes. In contrast, surface sensitive scanning tunneling spectroscopic (STS) measurements on FeSe, both in the single crystalline Kas2014 and the thin film form Song2011 , detected a “V”-shape spectra in the superconducting state, which was interpreted as being indicative of the presence of nodes. Interestingly, it was also shown by STS measurements that the tunneling spectra display a full gap at the twin boundaries Wata2015 . However, our most recent combined STS and specific heat studies conducted on single crystals grown by pure chemical vapor transport Koz2014 strongly support multigap node-less superconducting gap structure through out the FeSe material Jiao2016 .
One recent experiment that connected both nematicity and superconductivity to spin-fluctuations is inelastic neutron scattering on FeSe single crystals Wan2016 . They found a spin resonance of 4 meV in the superconducting state. The temperature dependence of this mode behaved like an order parameter, thus the authors argued that the spin-resonance is coupled to the onset of superconductivity. The resonance energy was compared with the electron-boson coupling mode at similar energies reported based on STS experiments Song2014 . Based on these arguments, these authors suggested a spin-fluctuation-mediated, sign-changing pairing mechanism for FeSe. Further, antiferromagnetism coexisiting with superconductivity has been reported in FeSe upon application of pressure Ben2010 ; Ben2012 ; Ter2015 ; Ter2016 .
From the above overview of the current experimental status it can be discerned that unequivocal conclusions on the origin of nematicity, the pairing mechanism as well as the order parameter symmetry of FeSe can still not be drawn. More experiments on high-quality single crystals are required for testing scenarios such as orbital or spin-fluctuation driven nematicity and/or superconductivity. It is also worthwhile to consider phonons as the driving force of the structural transition, and then investigate how this broken symmetry affects the underlying electronic system.
III Fe1+yTe
The compound Fe1+yTe has the same tetragonal structure at room temperature as FeSe, but forms only in the presence of excess Fe (). Fe1+yTe has also remarkably different physical properties. It does not exhibit superconductivity in the bulk form. Instead, it shows a very rich interplay of localized and itinerant magnetism Zal2011 ; Sto2014 ; Duc2014 . Moreover, magnetostructural phase transitions have been observed when tuning parameters such as temperature, composition, or pressure were varied Bao2009 ; Li2009 ; Rod2011 ; Ros2011 ; Zal2012 ; Koz2012 ; Koz2013 ; Rod2013 ; Koz2016 . As a digression, while can be dramatically increased in FeSe monolayers Yan2012 ; He2013 ; Tan2013 ; Ge2015 ; Fan2015 , superconductivity has been found in Fe1+yTe when fabricated in the form of thin films Han2010 or heterostructures He2014 .
III.1 Synthesis and characterization

Polycrystalline Fe1+yTe samples are typically synthesized utilizing a solid state reaction of Fe and Te pieces with different amounts of iron contents in the range 0.02 0.20. Mixtures of the target composition were placed in a glassy carbon crucibles with lid and sealed in quartz ampoules under vacuum. Starting materials were first heated up to 700∘C at a rate of 100∘C/h and kept there for one day. Subsequently, the temperature was slowly increased to 920∘C in order to complete the reaction between Fe and Te and to obtain homogeneous products. After maintaining a temperature of 920∘C for 48 h, samples were cooled down to 700∘C and annealed for 24 h in order to avoid the formation of a high-temperature modification of Fe1+yTe which was reported above 800∘C Ros1974 ; Isp1974 ; Isp1974b . Initially, the chemical composition of Fe1+yTe was reported to be in the range 0 0.3 Chi1955 ; Oka1990 ; Miz2012 . A more detailed investigation by Koz et al. found that the actual phase stability range for tetragonal Fe1+yTe is only for compositions with 0.060(5) 0.155(5) Koz2015 ; Koz2013 . In Fig. 8(a), the powder x-ray diffraction (PXRD) patterns of Fe1+yTe (y = 0.04, 0.06, 0.08, 0.11, 0.13, 0.15, and 0.17 are presented. The tetragonal Fe1+yTe is the main phase at room temperature for all studied nominal compositions, and the main reflections can be indexed on the basis of a tetragonal cell of space group . For and , FeTe2 Gro1954 and Fe impurities were observed in the PXRD patterns, respectively. The lattice parameters of tetragonal Fe1+yTe at room temperature are presented in Fig. 8(b). In the composition range 0.060(5) 0.155(5), the parameter increases while the parameter decreases upon increasing Fe content. The volume of the unit cell does not change significantly with composition, however, the ratio decreases from 1.645 to 1.638 with increasing Koz2015 .
In the following, we discuss the site occupancy of excess Fe. Grønvold et al. Gro1954 first suggested that the excess iron atoms in the Fe1+yTe phase are located in partially occupied interstitial sites. The crystal structure was considered to be an intermediate type between tetragonal PbO (the B10 type) and Fe2As (the C38 type). The arrangement in the B10 structure as described for -FeSe is a quadratic net of iron atoms, which together with the tellurium atoms form square pyramids with sharing edges, and with apices alternately above and below the net of iron atoms. The excess Fe atoms (Fe2) occupy an additional site in the tellurium plane and convert a pyramid into an octahedron without appreciably disturbing the original grouping. In space group , the Fe1 and Te atoms fully occupy the and sites, respectively, while the Fe2 atoms randomly occupy a second site. These conclusions have been confirmed using x-ray and neutron diffraction measurements Bao2009 ; Li2009 ; Fru1975 ; Sal2009 ; Liu2009 .
III.2 Single crystal growth
The single crystals of Fe1+yTe were generally grown either by a self flux method Rod2011 ; Miz2012b , by the horizontal or vertical Bridgman method Sal2009 ; Wen2011 ; Che2014 , or by chemical vapor transport Koz2015 . The growth started either from the mixture of elemental Fe and Te Miz2012 ; Che2014 or by taking premade powder of Fe1+yTe Rod2011 ; Koz2015 . Because of the non-stoichiometry, it proved to be difficult to control the exact Fe content in the single crystals. In the case of the horizontal Brigdman method Che2014 ; Che2015 , when the starting composition of Fe:Te was kept at 1.04:1, crystals of Fe1.06Te could be grown Che2015 . For the growth of crystals with higher Fe content, the starting ratio of Fe:Te was kept at 1.09:1. Note that both Fe1.11Te and Fe1.12Te crystals were extracted from a single growth, but from different parts of the ampoule. The exact compositions were determined only after a detailed chemical and physical analysis. The chemical vapor transport also had very similar problems in controlling the stoichiometry. Different temperature gradients between 700 and 800∘C, and different transport additives, such as NH4I, GaI3, and TeCl4, did not help to optimize the composition of the end products. However, a trend was observed during the experiments with I2. The single crystals contain roughly 2 % less iron than the starting composition. For example, polycrystalline materials with nominal composition Fe1.15Te yielded single crystals with composition Fe1.13Te. Good quality single crystals of Fe1+yTe () could be easily grown under respective conditions. However, when the starting composition was y = 0.11, the grown crystals were found to be a mixture of the tetragonal phase with different compositions. With further decrease in the starting composition, y 0.11, the grown crystals formed in another phase with chemical composition of Fe1-xTe (). This new phase could not be identified from the PXRD pattern. However, the compositions estimated from energy dispersive x-ray (EDX) measurements were in good agreement with the -phase which was reported between 636 and 809∘C in the Fe-Te phase diagram Oka1990 . Hence, in chemical vapor transport with I2 as a transport additive, only crystals of the compositions Fe1.11Te, Fe1.12Te and Fe1.14Te could be grown. In Fig. 9, images of such crystals are presented. Alternatively, Rodriguez et al. reported that I2 can be used as an oxidant in the topotactic deintercalation of interstitial iron in Fe1+yTe and Fe1+yTe0.7Se0.3 Rod2010 ; Rod2011b . According to their results, iodine reacts with iron at 300∘C to form FeI2. This might explain the composition difference of starting and end products in our chemical vapor transport reactions. Using the deintercalation procedure, crystals of Fe1.051(5)Te could be obtained from Fe1.118(5)Te Rod2010 .
III.3 Structural and magnetic properties
Based on neutron scattering experiments on Fe1+yTe, Bao it al. Bao2009 made two important observations. (i) The magnetic and structural properties of Fe1+yTe are extremely sensitive to the amount of excess Fe (). For example, Fe1.076Te undergoes a structural phase transition to a monoclinic () bicollinear antiferromagnetic phase whereas for Fe1.141Te, a structural phase transition to an orthorhombic () phase with an incommesurate antiferromagnetic structure was observed. (ii) The bicollinear antiferromagnetic structure of Fe1.076Te has a wave vector along . When defined in the 1-Fe Brillouin zone, this corresponds to (/2,/2) ordering. Along this wave vector, no nesting has been observed either in the ARPES experiments Xia2009 ; Lin2013 or in the density functional calculations Sub2008 . The results of neutron scattering indicated the presence of local moments. Indeed, above the antiferromagnetic ordering temperature , the magnetic susceptibility follows a Curie-Weiss behavior Koz2016 . The value of the total spin calculated from the Curie constant was found to be = 3/2, which is also consistent with the value obtained from the inelastic neutron scattering Zal2011 ; Sto2014 . Further, below , the ordered magnetic moment corresponds to = 1 Zal2011 ; Bao2009 . The values of both above and below are clearly lower than = 2 expected for Fe2+ in the tetrahedral coordination. The electrical properties of Fe1+yTe shows nonmetallic character in resistivity for temperatures above with , indicative of charge carrier incoherence near the Fermi level Liu2009 ; Chen2009 . ARPES measurements on Fe1.02Te revealed a sharp feature near the Fermi energy below , suggesting the appearance of coherent charge carriers in the AFM phase Liu2013b . A similar behavior was also observed in scanning tunneling spectroscopy Ros2012 . These results suggest an entanglement of localized and itinerant electrons in Fe1+yTe Zal2011 ; Tur2009 .
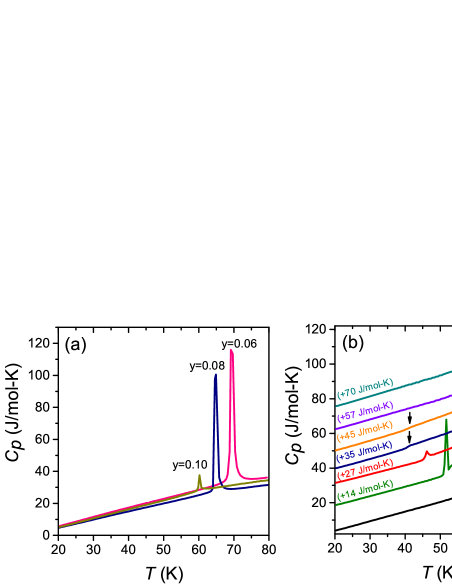
More detailed low temperature neutron as well as SXRD experiments revealed three different types of magnetic and structural behavior in Fe1+yTe depending on the amount of excess Fe Rod2011 ; Ros2011 ; Zal2012 ; Koz2013 ; Rod2013 ; Miz2012 ; Che2014b . In the compositional range , Fe1+yTe undergoes a simultaneous first-order phase transition to a monoclinic () as well as bicollinear antiferromagnetic phase. For the intermediate composition , two coupled magneto-structral phase transitions were observed Ros2011 ; Zal2012 ; Koz2013 ; Miz2012 ; Che2014b . Upon cooling, the system undergoes a continuous phase transition to an orthorhombic () incommesurate antiferromagnetic phase, followed by a first-order lock-in transition to the monoclinic bicollinear antiferromagnetic phase. It was, however, found that the low-temperature phase is a mixture of both, the orthorhombic and the monoclinic phases Koz2013 ; Rod2013 . For , the material undergoes a single phase transition to the orthorhombic incommensurate antiferromagnetic phase Rod2011 ; Sto2011 . This behavior is nicely corroborated by measurements of the specific heat of Fe1+yTe, Fig. 10. The sharp peaks found in for confirm a first-order phase transition. For , two peaks can be discerned in . The transition at higher temperature has a -like shape in suggesting a continuous phase transition, while the peaked shape of the low-temperature transition is first-oder like. For , once again a single -like peak is found in suggesting a continuous nature of the phase transition.
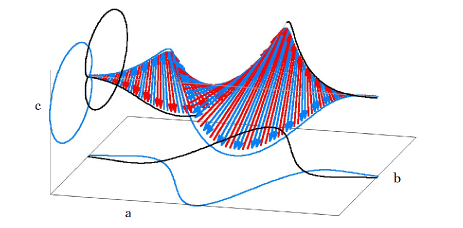
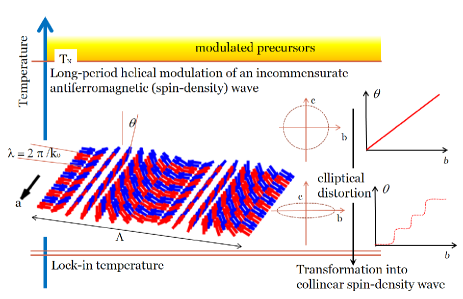
The bicollinear antiferromagnetic ordering can be captured by a frustrated -- Heisenberg model Ma2009 . However, the antiferromagnetic ordering for 0.11 is rather unconventional. For this compositional range, a random field Potts model Zal2012 or models involving several propagation vectors (plaquette ordering pattern) were proposed Duc2012 ; Ena2014 . Based on a phenomenological Landau theory, U. K. Rößler Mat2015 predicted the presence of liquid-like mesophases as precursors in Fe1+yTe. These precursors are composed of solitonic amplitude-modulated states, Fig. 11 (top panel). A dense amorphous condensate of such particle-like states is formed as a precursor at higher temperatures before a coherent magnetic long-range ordering takes place. Evidence for such magnetic precursors have been found in inelastic neutron scattering Sto2011 ; Par2012 as well as Mössbauer spectrosocpy Mat2015 . At the ordering temperature , a long-period modulation of a helical antiferromagnetic spin density wave is established. Upon decreasing temperature, the modulation direction is determined by a strong anisotropy, thereby making the helix more and more elliptical, until a bicollinear antiferromagnetic order is achieved at the lock-in transition. This process is pictorially represented in Fig. 11 (lower panel). The transition from a helical incommensurate spin density wave to bicollinear antiferromagnetic order was also observed in neutron diffraction experiments Bao2009 ; Rod2011 ; Zal2012 ; Fob2014 .
III.4 Effects of pressure
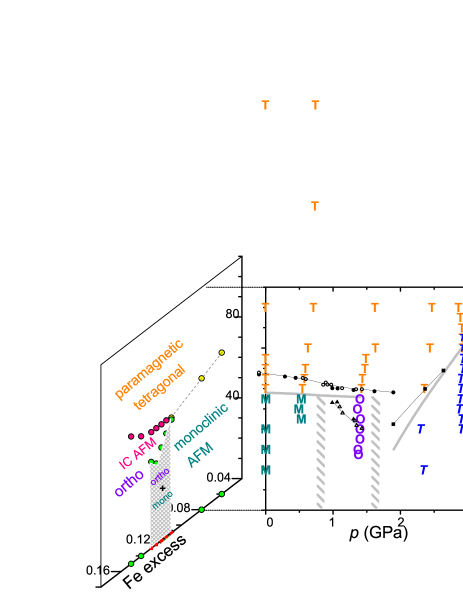
The temperature-pressure phase diagram of Fe1+yTe is remarkably similar to the temperature-composition (excess Fe) phase diagram as can be seen from Fig. 12. Based on resistivity and magnetization measurements, Okada et al. Oka2009 first identified two pressure-induced phases at low temperatures in FeTe0.92 (Fe1.086Te). In order to identify the phases, Koz et al. Koz2012 performed high-pressure SXRD on Fe1.08Te. At ambient pressure, Fe1.08Te undergoes simultaneous first-order structural and magnetic phase transitions, from the paramagnetic tetragonal () to the antiferromagnetic monoclinic () phase. At a pressure of 1.33 GPa, the low-temperature structure adopts an orthorhombic symmetry in the space group . More importantly, for pressures of 2.29 GPa and higher, a symmetry-conserving tetragonal-tetragonal phase transition has been identified from a change in the ratio of the lattice parameters. From the high-pressure magnetization measurements, the high-pressure, low-temperature tetragonal phase was found to be ferromagnetic Ben2013 . Interestingly, unlike the parent compounds of Fe-pnictides, no superconductivity was observed in Fe1+yTe up to a pressure of 19 GPa Oka2009 . The close resemblance of the temperature-composition and the temperature-pressure phase diagrams suggests a strong magneto-elastic coupling between the magnetic and structural order parameters in Fe1+yTe.
IV Concluding remarks
In this article, we have reviewed the synthesis and properties of two isostructural materials belonging to the family of Fe-chalcogenides. While FeSe is an itinerant non-magnetic compound, Fe1+yTe displays an interplay of localized and itinerant properties. The magnetic ordering in Fe1+yTe is bicollinear antiferromagnetic with the magnetic vector along (/2, /2) defined in the 1-Fe Brillouin zone. Upon substituting Se for Te, the long-range (/2, /2) order is suppressed and superconductivity emerges. Interestingly, in Fe1+yTe1-xSex, a resonance of a soft magnetic mode appears at the wave vector (, 0) (Liu2010 , note that this vector is defined in the 2-Fe unit cell in the original article) and becomes dominant for . These results support nesting-based theories of superconductivity, which require magnetic fluctuations along the wave vector (, 0) which connects hole and electron parts of the Fermi surface. However, the discovery of high-temperature superconductivity in FeSe monolayers Yan2012 ; He2013 ; Tan2013 ; Ge2015 ; Fan2015 as well as in Li1-xFexOHFeSe single crystals Du2016 ; Zha2016 , in which the hole Fermi surface is found to be absent at the center of the Brillouin zone, pose a serious challenge to the Fermi surface nesting-based theories of superonductivity in Fe-SC.
Alternative theories consider many-body effects and electron correlations. Although the Mott transition is absent in Fe-SC, these materials are depicted as systems with intermediate correlations Qaz2009 ; Si2008 ; Si2016 . Dynamical mean-field theory (DMFT) calculations provide evidence for such correlation effects in FeSe Aic2010 . Considering an interplay of electron kinetic energy, Coulomb potential , and Hund’s coupling , these theories find different effective masses for electrons in different -orbitals. The ARPES and quantum oscillation experiments on FeSe detect different band renomalization for different -bands Mal2014 ; Ter2014 ; Wat2015 ; Wat2015b , in agreement with the DMFT results. Further, according to the DMFT studies, Fe1+yTe is considered as the most strongly correlated among all Fe-based superconductorsYin2011 . Thus, orbital selectivity seems to be relevant in the case of Fe-chalcogenides Si2016 .
Another issue that has not been theoretically considered as of primary importance for superconductivity in Fe-SC is the role of spin-orbit coupling. Spin-orbit coupling provides a mechanism for the spins to couple to the lattice, thereby giving rise to a large magneto-elastic effect. A recent ARPES study Bor2015 on several Fe-SCs including FeSe, detected much larger band splitting due to spin-orbit effects than the possible nematic effects. The size of the spin-orbit coupling was found to be of the same order as the superconducting gap in these materials. In the case of Fe1+yTe, strong magneto-elastic effects have been observed in magnetostriction experiments Ros2012 . Further, scanning tunneling microscopy on Fe1+yTe detected a one-dimensional stripe structure Mac2012 ; Sug2013 , which is at the same wave vector as the magnetic ordering, indicating the presence of a spin-orbit coupling. These results suggest that the couplings of the electronic subsystem to the phonons are equally important as spin and orbital fluctuations.
Thus, in spite of nearly one decade of intense research on Fe-chalcogenides, the exact nature of the superconducting pairing mechanism still remains an open question. The current availability of large, good-quality single crystals of these materials provide an opportunity to resolve some of the controversies in the near future.
V Acknowledgments
Financial support from the Deutsche Forschungsgemeinschaft within the priority program SPP1458 is gratefully acknowledged. We thank U. K. Rößler for providing Fig. 11. We are grateful to Yuri Grin and Liu Hao Tjeng for support during the entire project. Chien-Lung Huang and Lin Jiao are acknowledged for commenting on the manuscript.
References
- (1) Y. Kamihara, T. Watanabe, M. Hirano, and H. Hosono, J. Am. Chem. Soc. 130, 3296 (2008).
- (2) Z.-A. Ren, G.-C. Che, X.-L. Dong, J. Yang, W. Lu, W. Yi, X.-L. Shen, Z.-C. Li, L.-L. Sun, F. Zhou, and Z.-X. Zhao, Europhys. Lett. 83, 17002 (2008).
- (3) C. Wang, L. Li, S. Chi, Z. Zhu, Z. Ren, Y. Li, Y. Wang, X. Lin, Y. Luo, S. Jiang, X. Xu, G. Cao, and Z. Xu, Europhys. Lett. 83, 67006 (2008).
- (4) F.-C. Hsu, J.-Y. Luo, K.-W. Yeh, T.-K. Chen, T.-W. Huang, P. M. Wu, Y.- C. Lee, Y.-L. Huang, Y.-Y. Chu, D.-C. Yan, and M.-K. Wu, Proc. Natl. Acad. Sci. U. S. A. 105, 14262 (2008).
- (5) T. M. McQueen, Q. Huang, V. Ksenofontov, C. Felser, Q. Xu, H. Zandbergen, Y. S. Hor, J. Allred, A. J. Williams, D. Qu, J. Checkelsky, N. P. Ong, and R. J. Cava, Phys. Rev. B 79, 014522 (2009).
- (6) Y. Mizuguchi, F. Tomioka, S. Tsuda, T. Yamaguchi, and Y. Takano, Appl. Phys. Lett. 93, 152505 (2008).
- (7) S. Medvedev, T. M. McQueen, I. A. Troyan, T. Palasyuk, M. I. Eremets, R. J. Cava, S. Naghavi, F. Casper, V. Ksenofontov, G. Wortmann, and C. Felser, Nature Mater. 8, 630 (2009).
- (8) S. Margadonna, Y. Takabayashi, Y. Ohishi, Y. Mizuguchi, Y. Takano, T. Kagayama, T. Nakagawa, M. Takata, and K. Prassides, Phys. Rev. B 80, 064506 (2009).
- (9) T. Imai, K. Ahilan, F. L. Ning, T. M. McQueen, and R. J. Cava, Phys. Rev. Lett. 102, 177005 (2009).
- (10) V A Sidorov, A V Tsvyashchenko, and R A Sadykov, J. Phys.: Condens. Matter 21, 415701 (2009).
- (11) K.-W. Yeh, T.-W. Huang, Y.-L. Huang, T.-K. Chen, F.-C. Hsu, P. M. Wu, Y.-C. Lee, Y.-Y. Chu, C.- L. Chen, J.-Y. Luo, D.-C. Yan and M.-K. Wu, Europhys. Lett. 84, 37002 (2008).
- (12) M. H. Fang, H. M. Pham, B. Qian, T. J. Liu, E. K. Vehstedt, Y. Liu, L. Spinu and Z. Q. Mao, Phys. Rev. B 78, 224503 (2008).
- (13) S. Rößler, Dona Cherian, S. Harikrishnan, H. L. Bhat, Suja Elizabeth, J. A. Mydosh, L. H. Tjeng, F. Steglich, and S. Wirth, Phys. Rev. B 82, 144523 (2010).
- (14) D. Cherian, S. Rößler, S. Wirth, and S. Elizabeth, J. Phys.: Condens. Matter 27, 205702 (2015).
- (15) Q.-Y. Wang, Z. Li, W.-H. Zhang, Z.-C. Zhang, J.-S. Zhang, W. Li, H. Ding, Y.-B. Ou, P. Deng, K. Chang, J. Wen, C.-L. Song, K. He, J.-F. Jia, S.-H. Ji, Y. Wang, L. Wang, X. Chen, X. Ma, Q.-K. Xue, Chin. Phys. Lett. 29, 037402 (2012).
- (16) S. He, J. He, W. Zhang, L. Zhao, D. Liu, X. Liu, D. Mou, Y.-B. Ou, Q.-Y. Wang, Z. Li, L. Wang, Y. Peng, Y. Liu, C. Chen, L. Yu, G. Liu, X. Dong, J. Zhang, C. Chen, Z. Xu, X. Chen, X. Ma, Q. Xue, and X. J. Zhou, Nature Mater. 12, 605 (2013).
- (17) S. Tan, Y. Zhang, M. Xia, Z. Ye, F. Chen, X. Xie, R. Peng, D. Xu, Q. Fan, H. Xu, J. Jiang, T. Zhang, X. Lai, T. Xiang, J. Hu, B. Xie, and D. Feng, Nature Mater. 12, 634 (2013).
- (18) J.-F. Ge, Z.-L. Liu, C. Liu, C.-L. Gao, D. Qian, Q.-K. Xue, Y. Liu, and J.-F. Jia, Nature Mater. 14, 285 (2015).
- (19) Q. Fan, W. H. Zhang, X. Liu, Y. J. Yan, M. Q. Ren, R. Peng, H. C. Xu, B. P. Xie, J. P. Hu, T. Zhang, and D. L. Feng, Nature Phys. 11, 946 (2015).
- (20) D. Liu, W. Zhang, D. Mou, J. He, Y.-B. Ou, Q.-Y. Wang, Z. Li, L. Wang, L. Zhao, S. He, Y. Peng, X. Liu, C. Chen, L. Yu, G. Liu, X. Dong, J. Zhang, C. Chen, Z. Xu, J. Hu, X. Chen, X. Ma, Q. Xue, and X.J. Zhou, Nature Commun. 3, 931 (2013).
- (21) J. Bang, Z. Li, Y. Y. Sun, A. Samanta, Y. Y. Zhang, W. Zhang, L. Wang, X. Chen, X. Ma, Q.-K. Xue, and S. B. Zhang, Phys. Rev. B 87, 220503(R) (2013).
- (22) W. Schuster, H. Mikler, and K. L. Komarek, Monatsh. Chem. 110, 1153 (1979).
- (23) H. Okamoto, J. Phase Equilibria 12, 383 (1991).
- (24) S. Margadonna, Y. Takabayashi, M. T. McDonald, K. Kasperkiewicz, Y. Mizuguchi, Y. Takano, A. N. Fitch, E. Suard, and K. Prassides, Chem. Commun. (Cambridge), 5607, (2008).
- (25) A. J. Williams, T. M. McQueen, and R. J. Cava, Solid State Commun. 149, 1507 (2009).
- (26) E. Pomjakushina, K. Conder, V. Pomjakushin, M. Bendele, and R. Khasanov, Phys. Rev. B 80, 024517 (2009).
- (27) C. Koz, M. Schmidt, H. Borrmann, U. Burkhardt, S. Rößler, W. Carrillo-Cabrera, W. Schnelle, U. Schwarz, and Y. Grin, Z. Anorg. Allg. Chem. 640, 1600 (2014).
- (28) U. Patel, J. Hua, S. H. Yu, S. Avci, Z. L. Xiao, H. Claus, J. Schlueter, V. V. Vlasko-Vlasov, U. Welp, W. K. Kwok, Appl. Phys. Lett. 94, 082508 (2009).
- (29) B. H. Mok, S. M. Rao, M. C. Ling, K. J. Wang, C. T. Ke, P. M. Wu, C. L. Chen, F. C. Hsu, T. W. Huang, J. Y. Luo, D. C. Yan, K. W. Ye, T. B. Wu, A. M. Chang, M. K. Wu, Cryst. Growth Des. 9, 3260 (2009).
- (30) J. I. Gorina, G. A. Kaluzhnaya, M. V. Golubkov, V. V. Rodin, N. N. Sentjurina, and S. G. Chernook, Crystallogr. Rep. 57, 585 (2012).
- (31) S. B. Zhang, Y. P. Sun, X. D. Zhu, X. B. Zhu, B. S. Wang, G. Li, H. C. Lei, X. Luo, Z. R. Yang, W. H. Song, J. M. Dai, Supercond. Sci. Technol. 22, 015020 (2009).
- (32) R. Hu, H. Lei, M. Abeykoon, E. S. Bozin, S. J. L. Billinge, J. B. Warren, T. Siegrist, C. Petrovic, Phys. Rev. B 83, 224502, (2011).
- (33) D. Chareev, E. Osadchii, T. Kuzmicheva, J.-Y. Lin, S. Kuzmichev, O. Volkova, A. Vasiliev, Cryst. Eng. Commun. 15, 1989 (2013).
- (34) A. E. Böhmer, F. Hardy, F. Eilers, D. Ernst, P. Adelmann, P. Schweiss, T. Wolf, and C. Meingast, Phys. Rev. B 87, 180505(R) (2013).
- (35) C. M. Yang, P. W. Chen, J. C. Kou, P. Diko, I. G. Chen, M. K. Wu, IEEE Trans. Appl. Supercond. 21, 2845, (2011).
- (36) M. Ma, D. Yuan, Y. Wu, H. Zhou, X. Dong, and F. Zhou, Supercond. Sci. Technol. 27, 122001 (2014).
- (37) A. E. Kar’kin, A. N. Titov, E. G. Shkvarina, A. A. Titov, and B. N. Goshchitskii, Phys. Metals Metallogr. 113, 932 (2012).
- (38) Y. Hara, K. Takase, A. Yamasaki, H. Sato, N. Miyakawa, N. Umeyama, S. I. Ikeda, Physica C 470, S313 (2010).
- (39) M.-K. Wu, M. -J. Wang, and K. -W. Jeh Sci. Technol. Adv. Mater, 14, 014402 (2013).
- (40) J.-Y. Lin, Y. S. Hsieh, D. A. Chareev, A. N. Vasiliev, Y. Parsons, and H. D. Yang, Phys. Rev. B 84, 220507(R) (2011).
- (41) K. K. Huynh, Y. Tanabe, T. Urata, H. Oguro, S. Heguri, K. Watanabe, and K. Tanigaki, Phys. Rev. B 90, 144516 (2014).
- (42) J. Maletz, V. B. Zabolotnyy, D. V. Evtushinsky, S. Thirupathaiah, A. U. B. Wolter, L. Harnagea, A. N. Yaresko, A. N. Vasiliev, D. A. Chareev, A. E. Böhmer, F. Hardy, T. Wolf, C. Meingast, E. D. L. Rienks, B. Büchner, and S. V. Borisenko, Phys. Rev. B 89 220506 (2014).
- (43) T. Terashima, N. Kikugawa, A. Kiswandhi, E.-S. Choi, J. S. Brooks, S. Kasahara, T. Watashige, H. Ikeda, T. Shibauchi, Y. Matsuda, T. Wolf, A. E. Böhmer, F. Hardy, C. Meingast, H. v. Löhneysen, M.-T. Suzuki, R. Arita, and S. Uji, Phys. Rev. B 90, 144517 (2014).
- (44) T. Shimojima, Y. Suzuki, T. Sonobe, A. Nakamura, M. Sakano, J. Omachi, K. Yoshioka, M. Kuwata-Gonokami, K. Ono, H. Kumigashira, A. E. Böhmer, F. Hardy, T. Wolf, C. Meingast, H. v. Löhneysen, H. Ikeda, and K. Ishizaka, Phys. Rev. B 90, 121111 (2014).
- (45) S. Kasahara, T. Watashige, T. Hanaguri, Y. Kohsaka, T. Yamashita, Y. Shimoyama, Y. Mizukami, R. Endo, H. Ikeda, K. Aoyama, T. Terashima, S. Uji, T. Wolff, H. v. Löhneysen, T. Shibauchi, and Y. Matsuda, Proc. Natl. Acad. Sci. U. S. A. 111, 16309 (2014).
- (46) P. Zhang, T. Qian, P. Richard, X. P. Wang, H. Miao, B. Q. Lv, B. B. Fu, T. Wolf, C. Meingast, X. X. Wu, Z. Q. Wang, J. P. Hu, and H. Ding, Phys. Rev. B 91, 214503 (2015).
- (47) S. Knöner, D. Zielke, S. Köhler, B. Wolf, Th. Wolf, L. Wang, A. Böhmer, C. Meingast, and M. Lang, Phys. Rev. B 91, 174510 (2015).
- (48) M. D. Watson, T. K. Kim, A. A. Haghighirad, N. R. Davies, A. McCollam, A. Narayanan, S. F. Blake, Y. L. Chen, S. Ghannadzadeh, A. J. Schofield, M. Hoesch, C. Meingast, T. Wolf, and A. I. Coldea, Phys. Rev. B 91, 155106 (2015).
- (49) A. E. Böhmer, T. Arai, F. Hardy, T. Hattori, T. Iye, T. Wolf, H. v. Löhneysen, K. Ishida, and C. Meingast, Phys. Rev. Lett. 114, 027001 (2015).
- (50) M. D. Watson, T. Yamashita, S. Kasahara, W. Knafo, M. Nardone, J. Béard, F. Hardy, A. McCollam, A. Narayanan, S. F. Blake, T. Wolf, A. A. Haghighirad, C. Meingast, A. J. Schofield, H. v. Löhneysen, Y. Matsuda, A. I. Coldea, and T. Shibauchi, Phys. Rev. Lett. 115, 027006 (2015).
- (51) T. Watashige, Y. Tsutsumi, T. Hanaguri, Y. Kohsaka, S. Kasahara, A. Furusaki, M. Sigrist, C. Meingast, T. Wolf, H. v. Löhneysen, T. Shibauchi, and Y. Matsuda, Phys. Rev. X 5 031022 (2015).
- (52) S. Rößler, C. Koz, L. Jiao, U. K. Rößler, F. Steglich, U. Schwarz, and S. Wirth, Phys. Rev. B 92, 060505(R) (2015).
- (53) C. Koz, Ph.D. thesis, Technische Universität, Dresden, Germany (2015).
- (54) C. S. Yadav and P. L. Paoulse, New J. Phys. 11, 103046 (2009).
- (55) C. P. Bean, Phys. Rev. Lett. 8, 250 (1962).
- (56) C. P. Bean, Rev. Mod. Phys. 36, 31 (1964).
- (57) Y. J. Song, J. B. Hong, B. H. Min, Y. S. Kwon, K. J. Lee, M. H. Jung, and J. S. Rhyee, J. Korean Phys. Soc. 59, 312 (2011).
- (58) H. Lei, R. Hu, and C. Petrovic, Phys. Rev. B 84, 014520 (2011).
- (59) T. Ozaki, K. Deguchi, Y. Mizuguchi, Y. Kawasaki, T. Tanaka, T. Yamaguchi, H. Kumakura, and Y. Takano, J. Appl. Phys. 111, 112620 (2012).
- (60) Q. P. Ding, S. Mohan, Y. Tsuchiya, T. Taen, Y. Nakajima, and T. Tamegai, Supercond. Sci. Technol. 25, 025003 (2012).
- (61) H. Yang, H. Luo, Z. Wang and H. H. Wen, Appl. Phys. Lett. 93, 142506 (2008).
- (62) T. Taen, Y. Tsuchiya, Y. Nakajima and T. Tamegai, Phys. Rev. B 80, 092502 (2009).
- (63) T. M. McQueen, A. J. Williams, P. W. Stephens, J. Tao, Y. Zhu, V. Ksenofontov, F. Casper, C. Felser, and R. J. Cava Phys. Rev. Lett. 103, 057002 (2009).
- (64) M. D. Lumsden and A. D. Christianson, J. Phys.: Condens. Matter 22, 203203 (2010).
- (65) D. C. Johnston, Adv. Phys. 59, 803, (2010).
- (66) G. R. Stewart, Rev. Mod. Phys. 83, 1589 (2011).
- (67) J.-Haw. Chu, J. G. Analytis, K. D. Greve, P. L. McMahon, Z. Islam, Y. Yamamoto, I. R. Fisher, Science 329, 824 (2010).
- (68) I. R. Fisher, L. Degiorgi, and Z. X. Shen, Rep. Prog. Phys. 74, 124506 (2011).
- (69) R. M. Fernandes, A. V. Chubukov, and J. Schmalian, Nature Phys. 10, 97 (2014).
- (70) J. N. Millican, D. Phelan, E. L. Thomas, J. B. Leõ, and E. Carpenter, Solid State Commun. 149, 707 (2009).
- (71) S. -H. Baek, D. V. Efremov, J. M. Ok, J. S. Kim, J. van den Brink, and B. Büchner, Nature Mater. 14, 210 (2015).
- (72) M. C. Rahn, R. A. Ewings, S. J. Sedlmaier, S. J. Clarke, and A. T. Boothroyd, Phys. Rev. B 91, 180501(R) (2015).
- (73) Q. Wang, Y. Shen, B. Pan, Y. Hao, M. Ma, F. Zhou, P. Steffens, K. Schmalzl, T. R. Forrest, M. Abdel-Hafiez, D. A. Chareev, A. N. Vasiliev, P. Bourges, Y. Sidis, Huibo Cao, and Jun Zhao, Nature Mater. 15, 159 (2016).
- (74) Rong Yu and Qimiao Si, Phys. Rev. Lett. 115, 116401 (2015).
- (75) J. K. Glasbrenner, I. I. Mazin, H. O. Jeschke, P. J. Hirschfeld, R. M. Fernandes, and Roser Valentí, Nature Phys. 11, 953 (2015).
- (76) F. Wang, S. A. Kivelson, and D.-H. Lee, Nature Phys. 11, 959 (2015).
- (77) A. V. Chubukov, R. M. Fernandes, and J. Schmalian, Phys. Rev. B 91, 201105(R) (2015).
- (78) K. Nakayama, Y. Miyata, G. N. Phan, T. Sato, Y. Tanabe, T. Urata, K. Tanigaki, and T. Takahashi, Phys. Rev. Lett. 113, 237001 (2014).
- (79) Y. Suzuki, T. Shimojima, T. Sonobe, A. Nakamura, M. Sakano, H. Tsuji, J. Omachi, K. Yoshioka, M. Kuwata-Gonokami, T. Watashige, R. Kobayashi, S. Kasahara, T. Shibauchi, Y. Matsuda, Y. Yamakawa, H. Kontani, and K. Ishizaka, Phys. Rev. B 92, 205117 (2015).
- (80) S. V. Borisenko, D. V. Evtushinsky, Z.-H. Liu, I. Morozov, R. Kappenberger, S. Wurmehl, B. Büchner, A. N. Yaresko, T. K. Kim, M. Hoesch, T. Wolf, and N. D. Zhigadlo, Nature Phys. 12, 311 (2016).
- (81) H. Lei, D. Graf, R. Hu, H. Ryu, E. S. Choi, S. W. Tozer, and C. Petrovic, Phys. Rev. B 85, 094515 (2012).
- (82) Y. Sun, S. Pyon, and T. Tamegai, Phys. Rev. B 93, 104502 (2016).
- (83) M. A. Tanatar, A. E. Böhmer, E. I. Timmons, M. Schütt, G. Drachuck, V. Taufour, S. L. Budḱo P. C. Canfield, R. M. Fernandes, and R. Prozorov, arXiv:1511.04757 (2015).
- (84) J. Kang and Z. Tešanović, Phys. Rev. B 83, 020505(R) (2011).
- (85) P. J. Hirschfeld, M. M. Korshunov, and I. I. Mazin, Rep. Prog. Phys. 74, 124508 (2011).
- (86) P. J. Hirschfeld, C. R. Physique 17, 197 (2016).
- (87) I. I. Mazin, D. J. Singh, M. D. Johannes, and M. H. Du, Phys. Rev. Lett. 101, 057003 (2008).
- (88) K. Kuroki, S. Onari, R. Arita, H. Usui, Y. Tanaka, H. Kontani, and H. Aoki, Phys. Rev. Lett. 101, 087004 (2008).
- (89) F. Wang, H. Zhai, Y. Ran, A. Vishwanath, and D.-H. Lee, Phys. Rev. Lett. 102, 047005 (2009).
- (90) H. Kontani and S. Onari, Phys. Rev. Lett. 104, 157001 (2010).
- (91) A. Subedi, L. Zhang, D. J. Singh, and M. H. Du, Phys. Rev. B 78, 134514 (2008).
- (92) A. Audouard, F. Duc, L. Drigo, P. Toulemonde, S. Karlsson, P. Strobel, and A. Sulpice, Europhys. Lett. 109, 27003 (2015).
- (93) J. Bardeen, L. N. Cooper, and J. R. Schrieffer Phys. Rev. 108, 1175 (1957).
- (94) M. Abdel-Hafiez, J. Ge, A. N. Vasiliev, D. A. Chareev, J. Van de Vondel, V. V. Moshchalkov, and A. V. Silhanek, Phys. Rev. B 88, 174512 (2013).
- (95) R. Khasanov, M. Bendele, A. Amato, K. Conder, H. Keller, H.-H. Klauss, H. Luetkens, and E. Pomjakushina Phys. Rev. Lett. 104, 087004 (2010).
- (96) J. K. Dong, T. Y. Guan, S. Y. Zhou, X. Qiu, L. Ding, C. Zhang, U. Patel, Z. L. Xiao, and S. Y. Li Phys. Rev. B 80, 024518 (2009).
- (97) P. Bourgeois-Hope, S. Chi, D. A. Bonn, R. Liang, W. N. Hardy, T. Wolf, C. Meingast, N. Doiron-Leyraud, and L. Taillefer, arXiv:1603.06917 (2016).
- (98) C.-L. Song, Y.-L. Wang, P. Cheng, Y.-P. Jiang, W. Li, T. Zhang, Z. Li, K. He, L. Wang, J.-F. Jia, H.-H. Hung, C. Wu, X. Ma, X. Chen, and Q.-K. Xue, Science 332, 1410 (2011).
- (99) L. Jiao, C.-L. Huang, S. Rößler, C. Koz, U. K. Rößler, U. Schwarz, and S. Wirth, arXiv:1605.01908 (2016).
- (100) C.-L. Song, Y.-L. Wang, Y.-P. Jiang, Z. Li, L. Wang, K. He, X. Chen, J. E. Hoffman, X.-C. Ma, and Q.-K. Xue, Phys. Rev. Lett. 112, 057002 (2014).
- (101) M. Bendele, A. Amato, K. Conder, M. Elender, H. Keller, H.-H. Klauss, H. Luetkens, E. Pomjakushina, A. Raselli, and R. Khasanov, Phys. Rev. Lett. 104, 087003 (2010)
- (102) M. Bendele, A. Ichsanow, Yu. Pashkevich, L. Keller, Th. Strässle, A. Gusev, E. Pomjakushina, K. Conder, R. Khasanov, and H. Keller, Phys. Rev. B 85, 064517 (2012).
- (103) T. Terashima, N. Kikugawa, S. Kasahara, T. Watashige, T. Shibauchi, Y. Matsuda, T. Wolf, A. E. Böhmer, F. Hardy, C. Meingast, H. v. Löhneysen, and S. Uji, J. Phys. Soc. Jpn. 84, 063701 (2015).
- (104) T. Terashima, N. Kikugawa, A. Kiswandhi, D. Graf, E.-S. Choi, J. S. Brooks, S. Kasahara, T. Watashige, Y. Matsuda, T. Shibauchi, T. Wolf, A. E. Böhmer, F. Hardy, C. Meingast, H. v. Löhneysen, and S. Uji, Phys. Rev. B 93, 094505 (2016).
- (105) I. A. Zaliznyak, Z. Xu, J. M. Tranquada, G. Gu, A. M. Tsvelik, and M. B. Stone, Phys. Rev. Lett. 107, 216403 (2011).
- (106) C. Stock, E. E. Rodriguez, O. Sobolev, J. A. Rodriguez-Rivera, R. A. Ewings, J. W. Taylor, A. D. Christianson, and M. A. Green, Phys. Rev. B 90, 121113 (2014).
- (107) S. Ducatman, R. M. Fernandes, and N. B. Perkins, Phys. Rev. B 90, 165123 (2014).
- (108) W. Bao, Y. Qiu, Q. Huang, M. A. Green, P. Zajdel, M. R. Fitzsimmons, M. Zhernenkov, S. Chang, M. Fang, B. Qian, E. K. Vehstedt, J. Yang, H. M. Pham, L. Spinu, and Z. Q. Mao, Phys. Rev. Lett. 102, 247001 (2009).
- (109) S. Li, C. de la Cruz, Q. Huang, Y. Chen, J. W. Lynn, J. Hu, Y.-L. Huang, F.-C. Hsu, K.-W. Yeh, M.-K. Wu, and P. Dai, Phys. Rev. B 79, 054503 (2009).
- (110) E. E. Rodriguez, C. Stock, P. Zajdel, K. L. Krycka, C. F. Majkrzak, P. Zavalij, and M. A. Green, Phys. Rev. B 84, 064403 (2011).
- (111) S. Rößler, D. Cherian, W. Lorenz, M. Doerr, C. Koz, C. Curfs, Yu. Prots, U. K. Rößler, U. Schwarz, S. Elizabeth, and S. Wirth, Phys. Rev. B 84, 174506 (2011).
- (112) I. A. Zaliznyak, Z. J. Xu, J. S. Wen, J. M. Tranquada, G. D. Gu, V. Solovyov, V. N. Glazkov, A. I. Zheludev, V. O. Garlea, and M. B. Stone, Phys. Rev. B 85, 085105 (2012).
- (113) C. Koz, S. Rößler, A. A. Tsirlin, D. Kasinathan, C. Börrnert, M. Hanfland, H. Rosner, S. Wirth, and U. Schwarz, Phys. Rev. B 86, 094505 (2012).
- (114) C. Koz, S. Rößler, A. A. Tsirlin, S. Wirth, and U. Schwarz, Phys. Rev. B 88, 094509 (2013).
- (115) E. E. Rodriguez, D. A. Sokolov, C. Stock, M. A. Green, O. Sobolev, J. A. Rodriguez-Rivera, H. Cao, and A. Daoud-Aladine, Phys. Rev. B 88, 165110 (2013).
- (116) C. Koz, S. Rößler, A. A. Tsirlin, C. Zor, G. Armağan, S. Wirth, and U. Schwarz, Phys. Rev. B 93, 024504 (2016).
- (117) Y. Han, W. Y. Li, L. X. Cao, X. Y. Wang, B. Xu, B. R. Zhao, Y. Q. Guo, and J. L. Yang, Phys. Rev. Lett. 104, 017003 (2010).
- (118) Q. L. He, H. Liu, M. He, Y. H. Lai, H. He, G. Wang, K. T. Law, R. Lortz, J. Wang, and I. K. Sou, Nature Commun. 5, 4247 (2014).
- (119) E. Røst and S. Webjørnsen, Acta Chem. Scand. A 28, 361 (1974).
- (120) H. Ipser, K. L. Komarek, and H. Mikler, Monatsh. Chem. 105, 1322 (1974).
- (121) H. Ipser and K. L. Komarek, Monatsh. Chem. 105, 1344 (1974).
- (122) S. Chiba, J. Phys. Soc. Jpn. 10, 837 (1955).
- (123) H. Okamoto and L. E. Tanner, in Binary Alloy Phase Diagrams, edited by T. B. Massalski (ASM International, Cleveland, OH, 1990), Vol. 2, p. 1781.
- (124) Y. Mizuguchi, K. Hamada, K. Goto, H. Takatsu, H. Kadowaki, and O. Miura, Solid State Commun. 152, 1047 (2012).
- (125) F. Grønvold, H. Haraldsen and J. Vihovde, Acta Chem. Scand. 8, 1927 (1954).
- (126) D. Fruchart, P. Convert, P. Wolfers, R. Madar, J. P. Senateur, and R. Fruchart, Mater. Res. Bull. 10, 169 (1975).
- (127) B. C. Sales, A. S. Sefat, M. A. McGuire, R. Y. Jin, D. Mandrus, and Y. Mozharivskyj, Phys. Rev. B 79, 094521 (2009).
- (128) T. J. Liu, X. Ke, B. Qian, J. Hu, D. Fobes, E. K. Vehstedt, H. Pham, J. H. Yang, M. H. Fang, L. Spinu, P. Schiffer, Y. Liu, and Z. Q. Mao, Phys. Rev. B 80, 174509 (2009).
- (129) Y. Mizuguchi, K. Hamada, and O. Miura, Physics Procedia 27, 9 (2012).
- (130) J. Wen, G. Xu, G. Gu, J. M. Tranquada, and R. J. Birgeneau Rep. Prog. Phys. 74, 124503 (2011).
- (131) D. Cherian, G. M. Nagendra, and S. Elizabeth, J. Cryst. Growth 401, 338 (2014).
- (132) D. Cherian and S. Elizabeth, J. Supercond. Nov. Magn. 28, 1139 (2015).
- (133) E. E. Rodriguez, P. Zavalij, P. Y. Hsieh, and M. A. Green, J. Am. Chem. Soc. 132, 10006 (2010).
- (134) E. E. Rodriguez, C. Stock, P. Y. Hsieh, N. P. Butch, J. Paglione and M. A. Green, Chem. Sci. 2, 1782 (2011).
- (135) Y. Xia, D. Qian, L. Wray, D. Hsieh, G. F. Chen, J. L. Luo, N. L. Wang, and M. Z. Hasan, Phys. Rev. Lett. 103, 037002 (2009).
- (136) P. -H. Lin, Y. Texier, A. T.-Ibrahimi, P. L. Fev́re, F. Bertran, E. Giannini, M. Grioni, and V. Brouet, Phys. Rev. Lett. 111, 217002 (2013).
- (137) G. F. Chen, Z. G. Chen, J. Dong, W. Z. Hu, G. Li, X. D. Zhang, P. Zheng, J. L. Luo, and N. L. Wang, Phys. Rev. B 79, 140509(R) (2009).
- (138) Z. K. Liu, R.-H. He, D. H. Lu, M. Yi, Y. L. Chen, M. Hashimoto, R. G. Moore, S.-K. Mo, E. A. Nowadnick, J. Hu, T. J. Liu, Z. Q. Mao, T. P. Devereaux, Z. Hussain, and Z.-X. Shen, Phys. Rev. Lett. 110, 037003 (2013).
- (139) S. Rößler, D. Cherian, H. S. Nair, H. L. Bhat, S. Elizabeth, and S. Wirth, J. Phys.: Conf. Series 400, 022099 (2012).
- (140) A. M. Turner, F. Wang, and A. Vishwanath, Phys. Rev. B 80, 224504 (2009).
- (141) D. Cherian, S. Rößler, C. Koz, A. A. Tsirlin, U. Schwarz, S. Wirth, and S. Elizabeth, J. Appl. Phys. 115, 123912 (2014).
- (142) C. Stock, E. E. Rodriguez, M. A. Green, P. Zavalij, and J. A. Rodriguez-Rivera, Phys. Rev. B 84, 045124 (2011).
- (143) F. Ma, W. Ji, J. Hu, Z.-Y. Lu, and T. Xiang, Phys. Rev. Lett. 102, 177003 (2009).
- (144) S. Ducatman, N. B. Perkins, and A. Chubukov, Phys. Rev. Lett. 109, 157206 (2012).
- (145) M. Enayat, Z. Sun, U. R. Singh, R. Aluru, S. Schmaus, A. Yaresko, Y. Liu, C. Lin, V. Tsurkan, A. Loidl, J. Deisenhofer, P. Wahl, Science 345, 653 (2014).
- (146) Ph. Materne, C. Koz, U. K. Rößler, M. Doerr, T. Goltz, H. H. Klauss, U. Schwarz, S. Wirth, and S. Rößler, Phys. Rev. Lett. 115, 177203 (2015).
- (147) D. Parshall, G. Chen, L. Pintschovius, D. Lamago, Th. Wolf, L. Radzihovsky, and D. Reznik, Phys. Rev. B 85, 140515 (2012).
- (148) D. Fobes, I. A. Zaliznyak, Z. Xu, R. Zhong, G. Gu, J. M. Tranquada, L. Harriger, D. Singh, V. O. Garlea, M. Lumsden, and B. Winn, Phys. Rev. Lett. 112, 187202 (2014).
- (149) H. Okada, H. Takahashi, Y. Mizuguchi, Y. Takano, and H. Takahashi, J. Phys. Soc. Jpn. 78, 083709 (2009).
- (150) M. Bendele, A. Maisuradze, B. Roessli, S. Gvasaliya, E. Pomjakushina, S. Weyeneth, K. Conder, H. Keller, and R. Khasanov, Phys. Rev. B 87, 060409(R) (2013).
- (151) T. J. Liu, J. Hu, B. Qian, D. Fobes, Z. Q. Mao, W. Bao, M. Reehuis, S. A. J. Kimber, K. Prokeš, S. Matas, D. N. Argyriou, A. Hiess, A. Rotaru, H. Pham, L. Spinu, Y. Qiu, V. Thampy, A. T. Savici, J. A. Rodriguez, and C. Broholm, Nature Mater. 9, 718 (2010).
- (152) Z. Du, X. Yang, H. Lin, D. Fang, G. Du, J. Xing, H. Yang, X. Zhu, and H.-H. Wen, Nature Commun. 7, 10565 (2016).
- (153) L. Zhao, A. Liang, D. Yuan, Y. Hu, D. Liu, J. Huang, S. He, B. Shen, Y. Xu, X. Liu, L. Yu, G. Liu, H. Zhou, Y. Huang, X. Dong, F. Zhou, K. Liu, Z. Lu, Z. Zhao, C. Chen, Z. Xu, and X. J. Zhou, Nature Commun. 7, 10608 (2016).
- (154) M. M. Qazilbash, J. J. Hamlin, R. E. Baumbach, Lijun Zhang, D. J. Singh, M. B. Maple and D. N. Basov, Nature Phys. 5, 647 (2009).
- (155) Q. Si and E. Abrahams, Phys. Rev. Lett. 101, 076401 (2008).
- (156) Q. Si, R. Yu, and E. Abrahams, Nature Rev. Mater. 1, 16017 (2016).
- (157) M. Aichhorn, S. Biermann, T. Miyake, A. Georges, and M. Imada, Phys. Rev. B 82, 064504 (2010).
- (158) Z. P. Yin, K. Haule, and G. Kotliar Nature Mater. 10, 932 (2011).
- (159) T. Machida, K. Kogure, T. Kato, H. Nakamura, H. Takeya, T. Mochiku, S. Ooi, Y. Mizuguchi, Y. Takano, K. Hirata, and H. Sakata, J. Phys. Soc. Jpn. 81, 074714 (2012).
- (160) A. Sugimoto, R. Ukita, and T. Ekino, Physics Procedia 45, 85 (2013).