An Optical and Near-Infrared Study of the Type Ia/IIn Supernova PS15si
Abstract
We present optical/near-infrared spectroscopy and photometry of the supernova (SN) PS15si. This object was originally identified as a Type IIn SN, but here we argue that it should be reclassified as a Type Ia SN with narrow hydrogen lines originating from interaction with circumstellar matter (CSM; i.e., SN Ia/IIn or SN Ia-CSM). Based on deep nondetections before discovery, we infer that this SN was discovered around or slightly before optical maximum, and we estimate the approximate time that it reached -band maximum based on comparison with other SNe Ia/IIn. In terms of spectral morphology, we find that PS15si can be matched to a range of SN Ia spectral types, although SN 1991T-like SNe Ia provides the most self-consistent match. While this observation agrees with analysis of most other SNe Ia/IIn, we find that the implied CSM luminosity is too low to account for the overall luminosity of the SN at a time when the CSM should outshine the underlying SN by a few magnitudes. We infer that the similarity between PS15si and the hot, overluminous, high-ionisation spectrum of SN 1991T is a consequence of a spectrum that originates in ejecta layers that are heated by ultraviolet/X-ray radiation from CSM interaction. In addition, PS15si may have rebrightened over a short timescale in the and bands around after discovery, perhaps indicating that the SN ejecta are interacting with a local enhancement in CSM produced by clumps or a shell at large radii.
keywords:
circumstellar matter — supernovae: general — supernovae: individual (PS15si)1 INTRODUCTION
The increasing number of targets from high-cadence surveys has revealed enormous variety in spectroscopic and photometric signatures of supernovae (SNe) including the subclass of Type Ia SNe (SNe Ia). While some variations in SN Ia spectra and light curves have long been recognised, such as the width-luminosity or Phillips relation (Phillips, 1993), recent focus on ejecta velocities (Wang et al., 2009), spectral variation with time (Patat et al., 2007), and polarization signals (Kasen et al., 2003; Patat et al., 2009; Porter et al., 2016) suggest a wide variety of SN Ia subtypes. Peculiar trends in these measurements contribute to the ambiguity in the underlying mechanism(s) for SNe Ia. Despite the success of the C/O white dwarf (WD) thermonuclear explosion model in explaining the explosion mechanism of SNe Ia (Hoyle & Fowler, 1960; Arnett, 1968; Nomoto, 1986), it is still unclear whether a dominant evolutionary channel exists to ignite these explosions. Two models predict different channels through which ignition might occur — a single-degenerate model, involving a WD that accretes from a nondegenerate companion star, and a double-degenerate model, involving the merger of two WDs. Various lines of evidence from spectroscopic and photometric signatures of various SNe Ia sub-types seem to argue in favor of both models. For example, it has been suggested that helium in peculiar SNe Iax (Foley et al., 2013) originates from nondegenerate companion stars, and signatures of circumstellar matter (CSM) in thermal X-ray emission and spectropolarimetry in some SNe Ia also point toward mass loss from a nondegenerate companion (Wang et al., 1996; Immler et al., 2006; Patat et al., 2012). At the same time, so-called super-Chandrasekhar SNe exhibit high luminosity and low ejecta velocities, and point toward massive () WD progenitors, possibly from WD mergers (Howell et al., 2006; Hicken et al., 2007; Silverman et al., 2011). While illuminating the diversity of SNe Ia, these systems generate additional questions. Do they represent the extremes along a continuum of SN Ia explosion scenarios? What similarities do these SNe Ia share with each other and the more common classifications?
In particular, one new class of SN Ia-like events exhibits the spectroscopic signatures of both SNe Ia and SNe IIn (IIn for narrow lines of hydrogen) in the form of broad Fe, Ca, S, and Si absorption combined with strong, narrow H emission, consistent with a SN Ia explosion encountering dense CSM. The dominant hydrogen feature seen in this subclass contrasts with the majority of SNe Ia where H searches have yielded null results to deep limits of (e.g., SNe 2005am, 2005cf, and 2011fe as in Leonard, 2007; Shappee et al., 2013). The first SN identified with both SN Ia and SN IIn features, SN 2002ic (Hamuy et al., 2003), exhibited absorption features characteristic of SN 1991T-like SNe Ia (Filippenko et al., 1992; Phillips et al., 1992; Filippenko, 1997), but was identified as having both broad and narrow H profiles as early as after maximum light. SN 2002ic and SNe with similar spectroscopic signatures have been denoted as SNe Ia/IIn, IIa, and sometimes Ia-CSM111Hereafter, we refer to this class of objects as SNe Ia/IIn, since the name SN Ia-CSM mixes an interpretation of a physical mechanism with a spectral classification. (Deng et al., 2004; Kotak et al., 2004; Silverman et al., 2013a) owing to their spectroscopic overlap with both SNe Ia and IIn. Subsequent to the discovery of SN 2002ic, two SNe IIn — SNe 1997cy and 1999E (Hamuy et al., 2003; Wood-Vasey et al., 2004) — were reclassified as SN 2002ic-like. More recently, several SNe Ia/IIn, such as SN 2005gj and PTF11kx (Aldering et al., 2006; Prieto et al., 2007; Dilday et al., 2012), were spectroscopically identified soon after explosion. It is now estimated that this class represents as many as of all SNe Ia (Dilday et al., 2012).
In addition to their unique spectroscopic properties, the light curves of SNe Ia/IIn also exhibit traits that overlap with both SNe Ia and SNe IIn. SNe Ia/IIn consistently have -band peak luminosities brighter than , and their light curves evolve slowly with a linear decay that can last for several weeks. For the first after peak, SNe Ia/IIn light curves are generally consistent with “normal” SNe Ia (Hamuy et al., 2003; Prieto et al., 2007). After this point, SNe Ia/IIn decline much more slowly than SNe Ia, and the residual flux is assumed to be due to CSM interaction. In this model, the freely expanding, 56Ni-powered SN can be observed mostly at early times and the optically thick CSM interaction is dominant at later times (Chugai & Yungelson, 2004), perhaps followed by a return to the 56Ni-powered decay line.
While the general trend of slow decay is observed, it is still an open question why some SNe Ia/IIn exhibit strong SN Ia-like absorption in early-time spectra (e.g., Hamuy et al., 2003; Silverman et al., 2013a) while others appear to be diluted by a thermal continuum (e.g., Aldering et al., 2006). During the period when H emission fades (generally 70–300 days), the spectrum further evolves as the thermal continuum becomes less apparent and the SN Ia-like component enters the nebular phase. This epoch in SN Ia/IIn evolution is critical for determining the characteristics of both the CSM and the intrinsic SN emission where competing models of the progenitor system can be evaluated (Chugai et al., 2004). This phase also probes the CSM out to large radii where observations may reveal complex structure in the surrounding medium.
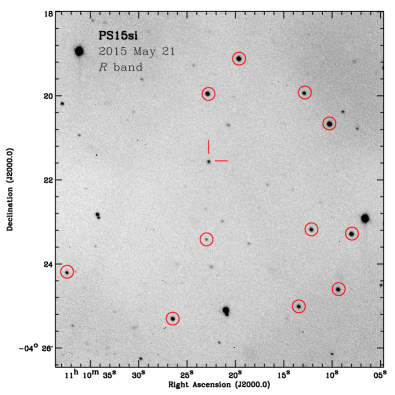
In this paper we discuss PS15si, discovered by the Pan-STARRS Survey for Transients (Smith et al., 2015) on 2015 Mar. 23 (all dates presented herein are UT) and located 16 from the center of the galaxy 2dFGRS N166Z116 (hereafter N166Z116). The target was originally classified after discovery as a SN IIn, with narrow hydrogen lines indicating redshift (Walton et al., 2015). In this paper, we argue that PS15si is a SN Ia/IIn. We adopt a Milky Way line-of-sight reddening of (Schlafly & Finkbeiner, 2011), a distance to N166Z116 of , and (Colless et al., 2003). From the light curve and prediscovery images222The target was provided from the Pan-STARRS NEO survey and made public via star.pst.qub.ac.uk/ps1threepi/., we infer that the SN was discovered around or slightly before optical maximum given the discovery magnitude (Sloan ) on 2015 Mar. 23 (see Huber et al., 2015). Assuming a line-of-sight mag, the peak apparent magnitude indicates PS15si had an absolute -band magnitude of .
2 OBSERVATIONS
We took optical imaging photometry of PS15si using the Super-LOTIS (Livermore Optical Transient Imaging System; Williams et al., 2008) 0.6 m telescope at Kitt Peak National Observatory between 2015 May 8 and Jun. 20. Standard reductions, including flat-fielding and bias subtraction, were carried out using a semi-automatic routine. We then performed differential photometry using stars in the field and APASS standards. A Super-LOTIS image including the SN from 2015 May 21 is shown in Figure 1. We transformed and -band standards from APASS and magnitudes as described by Jester et al. (2005).
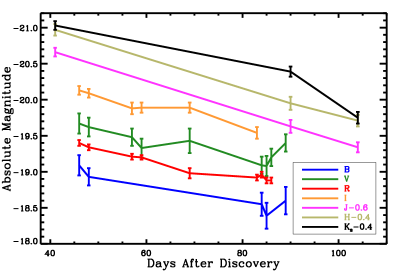
We took near-infrared (NIR) observations with the 3.8 m United Kingdom Infrared Telescope (UKIRT) on Mauna Kea using WFCAM2 (2015 May 3, Jun. 21, Jul. 5)333Our observing campaign for PS15si ended at this point due to solar conjunction.. observations were pipeline reduced by the Cambridge Astronomical Survey Unit (CASU). We performed aperture photometry on all images using a diameter aperture to reduce contamination from the host galaxy, and we calibrated the instrumental magnitudes using 2MASS NIR standard stars present in the field. For both optical and NIR magnitudes, we calculated uncertainties by adding in quadrature photon statistics and zero-point deviation of the standard stars for each epoch. We detail the optical and NIR magnitudes for PS15si in Table 1 and Figure 2.
| UT Date | day444Since discovery on 2015 Mar. 23. | ||||
|---|---|---|---|---|---|
| (y-m-d) | |||||
| 2015-05-08 | 46 | 17.620.14 | 17.040.14 | 17.310.04 | 16.580.06 |
| 2015-05-10 | 48 | 17.780.12 | 17.090.13 | 17.370.04 | 16.620.06 |
| 2015-05-19 | 57 | … | 17.230.12 | 17.500.04 | 16.830.08 |
| 2015-05-21 | 59 | … | 17.380.13 | 17.510.03 | 16.820.07 |
| 2015-05-31 | 69 | … | 17.280.17 | 17.730.07 | 16.820.07 |
| 2015-06-14 | 83 | … | … | 17.790.04 | 17.170.08 |
| 2015-06-15 | 84 | 18.160.16 | 17.620.12 | 17.750.04 | … |
| 2015-06-16 | 85 | 18.320.18 | 17.630.14 | 17.830.04 | … |
| 2015-06-17 | 86 | … | 17.510.12 | 17.830.04 | … |
| 2015-06-20 | 89 | 18.110.19 | 17.310.12 | … | … |
| UT Date | day | ||||
| (y-m-d) | |||||
| 2015-05-03 | 41 | 16.650.06 | 16.140.08 | 16.080.06 | |
| 2015-06-21 | 90 | 17.680.09 | 17.160.09 | 16.720.07 | |
| 2015-07-05 | 104 | 17.970.07 | 17.400.08 | 17.360.08 |
We obtained 2 epochs of moderate-resolution optical spectra with the Bluechannel spectrograph on the Multiple Mirror Telescope (MMT) on 2015 Apr. 30 and 2015 Jun. 12. Each MMT Bluechannel observation was taken with a 1.0 slit and the grating with a central wavelength of 6350 Å and s exposures. The spectral range we used covers approximately 5800–7000 Å. Standard reductions were carried out using IRAF555IRAF, the Image Reduction and Analysis Facility, is distributed by the National Optical Astronomy Observatory, which is operated by the Association of Universities for Research in Astronomy (AURA) under cooperative agreement with the National Science Foundation (NSF). including bias subtraction, flat fielding, and optimal extraction of the spectra. Flux calibration was achieved using spectrophotometric standards observed at an airmass similar to that of each science frame, and the resulting spectra were median combined into a single 1D spectrum for each epoch.
In addition, we retrieved the spectrum used for the original spectroscopic identification of PS15si by the Public ESO Spectroscopic Survey of Transient Objects (PESSTO; see Smartt et al., 2013; Valenti et al., 2014) from WISeREP666wiserep.weizmann.ac.il/ (Yaron & Gal-Yam, 2012); it had been obtained with the Faint Object Spectrograph and Camera (EFOSC2) on the European Southern Observatory’s New Technology Telescope (ESO-NTT) on 2015 Mar. 28 (Walton et al., 2015). The slit width, observed spectral range, and resolution are given in Table 2.
| UT Date | day777Since discovery on 2015 Mar. 23. | Telescope/Instrument | Slit Width | Range | |
|---|---|---|---|---|---|
| (y-m-d) | (arcsec) | (Å) | |||
| 2015-03-28 | 5 | ESO-NTT/EFOSC2 | 1.0 | 355 | 3640–9235 |
| 2015-05-01 | 39 | MMT/Bluechannel | 1.0 | 4500 | 5727–7012 |
| 2015-06-13 | 82 | MMT/Bluechannel | 1.0 | 4500 | 5727–7012 |
| 2015-06-16 | 85 | Keck/LRIS | 1.0 | 600 | 3200–10200 |
We obtained the final spectral epoch of PS15si on 2015 Jun. 16 with the Low Resolution Imaging Spectrometer (LRIS; Oke et al., 1995) at the Keck Observatory. We used the 1.0 slit rotated to the parallactic angle to minimise the effects of atmospheric dispersion (Filippenko, 1982, in addition, LRIS has an atmospheric dispersion corrector and the object was at low airmass, ). In our LRIS configuration, coverage in the blue with the 600/4000 grism extends over 3200–5600 Å. We used the 5600 Å dichroic and our coverage in the red with the 400/8500 grating extends over 5600–10,200 Å. We obtained one 200 s exposure, and reduced it using routines written specifically for LRIS in the Carnegie Python (CarPy) package. We performed standard reductions on the two-dimensional (2D) images including flat-fielding, correction for distortion along the slit axis, wavelength calibration with arc-lamp spectra, and cosmic ray cleaning before extracting the 1D spectrum of PS15si. We flux calibrated the extracted spectrum using a sensitivity function derived from a standard star obtained the same night in the same instrument configuration. We also used the standard-star spectrum to remove the telluric sky absorption features.
The final spectra are shown in Figure 3. The resolution at H in each spectrum (in chronological order) is roughly and . These data have been dereddened for Milky Way Galaxy reddening assuming as reported by Schlafly & Finkbeiner (2011). We have also removed the recession velocity given the observed wavelength of narrow H emission, which is consistent with the host-galaxy redshift.
3 RESULTS
3.1 Photometry
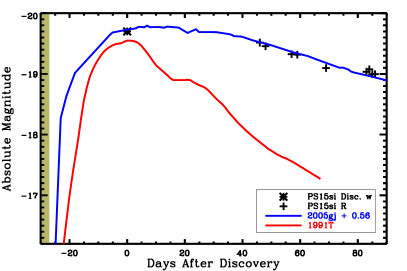
To analyze our photometry of PS15si, we compare our data to light curves of other SNe Ia in the literature, especially those of SNe Ia/IIn after optical maximum. In Figure 2 (left), we overplot light curves from an overluminous SN 1991T-like template (Stern et al., 2004) and SN 2005gj as a SN Ia/IIn template (Prieto et al., 2007) along with our -band observations and the discovery -band magnitude of PS15si. The light curve of SN 2005gj is fit to our data of PS15si assuming that both light curves follow the same shape, and that PS15si is fainter than SN 2005gj (i.e., shifted in magnitude without any stretch). This brightness allows us to match the shape of the SN 2005gj light curve to prediscovery constraints detailed in Section 4.1.
As we demonstrate in Figure 2 (right), the -band magnitude of PS15si appears to be in a phase of linear decay and at a rate of , although later epochs in the and bands may be decaying more slowly or even rebrightening. We explore this behaviour in Section 4.3.
3.2 Spectroscopy
3.2.1 Comparison to Other SNe Ia/IIn and Spectral Line Identification
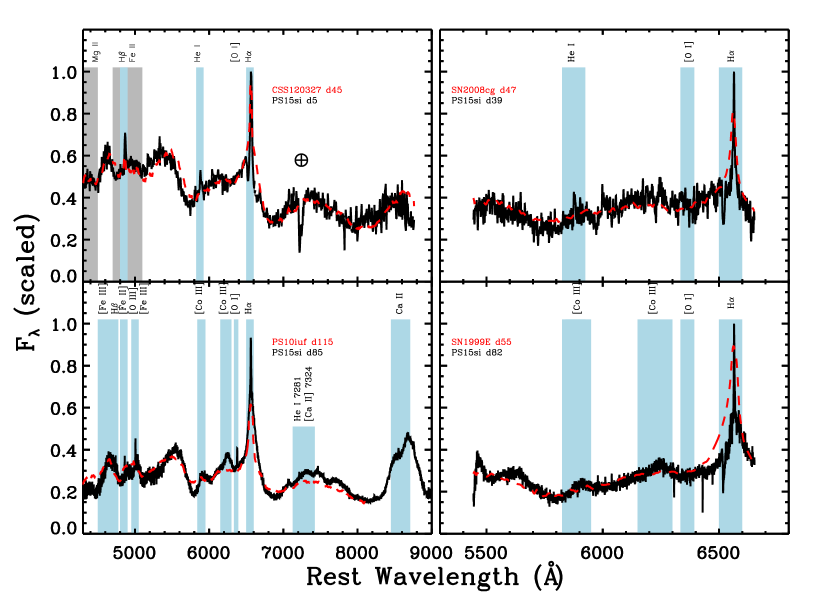
In Figure 3 we compare spectra from each available epoch of PS15si to spectra of known SNe Ia/IIn. We note several features in absorption (grey) and in emission (blue) present in each spectral epoch. The comparison spectra were sampled from all of the SNe Ia/IIn spectra presented in Silverman et al. (2013a). For each epoch, the time (in days) since discovery is indicated for PS15si and the comparison spectra, including CSS120327:110520–015205 (hereafter, CSS120327; identified as a SN Ia/IIn in Drake et al., 2012), SN 2008cg (identified as a SN Ia/IIn in Filippenko et al., 2008), SN 1999E (identified as a SN Ia/IIn in Deng et al., 2004), and PTF10iuf (identified as a SN Ia/IIn in Silverman et al., 2013a). The PS15si spectra are scaled such that , and the comparison spectra are corrected for redshift and Galactic reddening using values from Silverman et al. (2013a) (Tables 1, 2, 4, and 5 therein) and scaled to minimise the root-mean square (RMS) of the difference spectrum except for H (i.e., 6500–6600 Å).
The correspondence between H, He i 5876, Mg ii around 4400 Å, and Fe ii 4700–5100 Å in the first spectral epoch of PS15si and the spectrum of CSS120327 indicates the similarities between these objects. In our two moderate resolution epochs (Figure 3, right panels), H is narrower in the PS15si spectra than in the SN 2008cg and SN 1999E spectra. This discrepancy could be due to the difference in spectral resolution of the PS15si epochs and comparison spectra, especially as the comparison spectra appear to peak at a lower flux density relative to the continuum level. If the discrepancy is real, however, it could also be due to the relative difference in epochs between PS15si and the comparison spectra or an intrinsic difference in the strength of post-shock CSM. That is, the intermediate-width component of H, which begins to appear 82 days after discovery in PS15si, is significantly weaker in PS15si than in the comparison spectra. This feature presumably arises from the shell of post-shock CSM entrained in the ejecta (Chevalier & Fransson, 1994; Zhang et al., 2012), and therefore indicates the relative epoch of PS15si and the comparison spectra assuming similar CSM profiles.
In the final epoch, there are additional differences in the comparison to PTF10iuf. Broad emission features are generally well-matched to PTF10iuf, although the continuum level appears slightly higher in the comparison spectrum. Emission around 5900 Å and especially 6200 Å is also stronger in PS15si than in PTF10iuf. These features are of particular interest because they correspond to known Co features in the nebular spectra of SNe Ia (i.e., [Co iii] 5890, 5908 and [Co iii] 6197 as described in Bowers et al. (1997); Liu et al. (1997)). In addition to [Co iii] 6578 (which is obscured by H in SNe Ia/IIn), these Co lines are generally the strongest Co features in optical spectra of SNe Ia. We interpret this line identification as independent confirmation that PS15si is likely a SN Ia/IIn and results from a thermonuclear SN; SNe IIn generally do not have strong Co emission in their late-time spectra but are instead dominated by narrow lines of H, O, and He as well as a quasicontinuum of forbidden and permitted Fe lines (as in SNe 1988Z, 1998S, 2006gy Turatto et al., 1993; Mauerhan & Smith, 2012; Kawabata et al., 2009). The presence of strong Co emission in addition to the quasicontinuum of Fe lines at bluer wavelengths strongly suggests that the underlying SN is of Type Ia.
One strong similarity between PS15si and other SNe Ia/IIn in the final epoch is the presence of narrow [O iii] 5007 emission, which is also accompanied by narrow [O i] 6364. PS15si represents the first time [O i] emission has been identified from a SN Ia/IIn. The emission from these features cannot be due to host galaxy contamination given the lack of any such emission in the first spectral epoch. Therefore, we infer that the [O i] and [O iii] emission arise from either the SN ejecta or the surrounding medium. In spectra from SN 2005gj, Aldering et al. (2006) found that [O iii] around past explosion exhibited an inverted P Cygni profile with emission around and absorption around . Our spectral resolution in the final epoch () cannot resolve any P Cygni feature in [O iii] or [O i] if it exists. This line may also be obscured by strong Fe emission at similar wavelengths888We mark [Fe ii] 4890 and [Fe iii] 5011 in Figure 3 for reference..
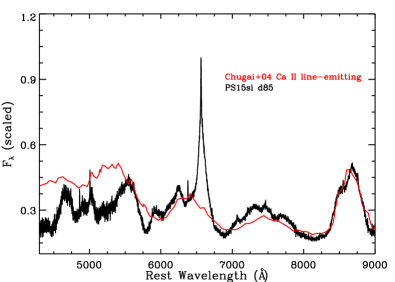
The Ca ii IR triplet feature appears to be one of the dominant spectral lines in the final spectral epoch of PS15si. For SN 2002ic, Chugai et al. (2004) argued that Ca ii emission around 8500 Å points to a Ca-rich layer in the shocked SN ejecta arising from an outer layer of Fe-poor material. In Figure 4, we show that their model of a Ca ii line-emitting shell closely matches the profile observed toward PS15si in the latest epoch. However, that quasicontinuum, Fe-dominated model around 4300–6000 Å is poorly matched to PS15si. Strong Ca ii emission is a sign that incomplete burning up to Fe-peak products may accompany some SNe Ia/IIn (Marion et al., 2003), which can occur in thermonuclear SNe in general999However, note that Mazzali et al. (2005) discuss abundance enhancement versus density enhancement in combination with SN-CSM interaction to explain Ca II IR absorption features in some normal SNe Ia.. This prominent, broad Ca ii profile is common for SNe Ia/IIn; indeed, it appears in virtually all SNe of this type with spectra available after optical maximum (e.g., SNe 1999E, 2002ic, 2008J, 2011jb, PTF11kx, 2012ca in Rigon et al., 2003; Wang et al., 2004; Silverman et al., 2013a, b; Fox et al., 2015). This feature contrasts with spectra of “normal” SNe Ia in which Ca ii is generally weak during the nebular phase (Bowers et al., 1997), although it has been observed at very late times (e.g., in SN 2011fe as in Graham et al., 2015).
3.2.2 Fitting PS15si to Spectral Templates with Added Blackbody Emission
Apart from strong, narrow H emission, the presence of luminous, optically thick continuum is one of the defining characteristics of SNe Ia/IIn that led to their interpretation as CSM interaction events (Hamuy et al., 2003; Aldering et al., 2006; Leloudas et al., 2015). Strong continuum emission tends to “dilute” the SN Ia spectrum, as emission and absorption features lose contrast relative to the continuum level. This is seen in core-collapse SNe IIn with strong CSM interaction as well (e.g., SN 2006gy as in Smith et al., 2010). Assuming the continuum emission is dominated by thermal emission from CSM interaction, we can constrain the temperature of the ejecta-CSM region and subtract this component to examine the underlying SN Ia-like features. This analysis is based on the assumption that the SN itself is typical of SNe without signatures of CSM interaction at varying epochs. In the case of PS15si, we simultaneously fit a blackbody continuum and SNe templates to the spectrum at each epoch. These templates include SN 1994D-like (SN Ia-norm; 0–90 days after explosion), SN 1991T-like (overluminous SN Ia; 0–93 days), SN 1991bg-like (underluminous SN Ia; 0–113 days) and SN 1999ex-like (SN Ib/c; 0–85 days) spectra (Nugent et al., 2002; Hamuy et al., 2002; Stern et al., 2004)101010c3.lbl.gov/nugent/nugent_templates.html. While we have established that PS15si is spectroscopically similar to other SNe Ia/IIn and has spectral features typical of SNe Ia, we use a SN Ib/c template in our analysis as an additional check on the hypothesis that PS15si is more similar to SNe Ia than other types.
The template spectra () we obtained were in arbitrary units, and we normalized them by taking . For each PS15si spectrum , we simultaneously fit a template spectrum and a blackbody continuum spectrum normalized to unity at its peak () such that with variable temperature and the relative weights of the template and blackbody and , respectively. Thus, we searched for parameters, to minimise the RMS of the difference spectrum
| (1) |
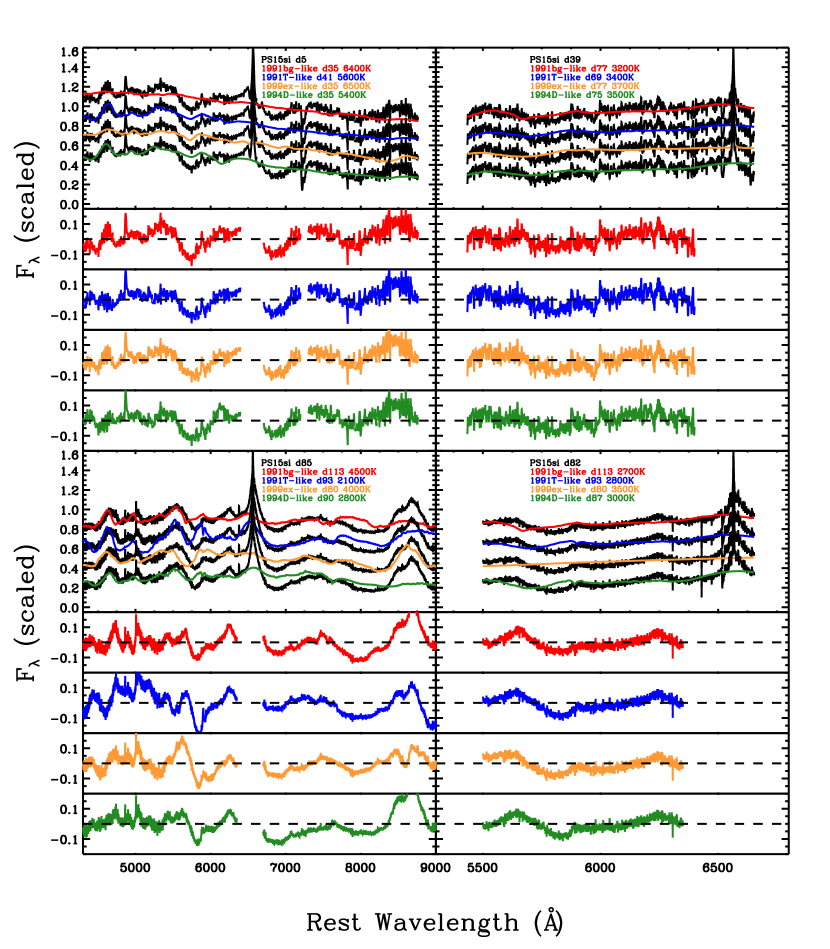
Our results from spectral fits at all four epochs of PS15si are presented in red, blue, orange, and green for each template in Figure 5. The template spectra are labeled with the epoch in days relative to explosion along with the temperature of the blackbody continuum added to the fit. Below the best-fit spectrum from each template, we plot the residuals for all four templates (i.e., ). The RMS of for each spectral fit is given in Table 4. In calculating the RMS, we ignore wavelength ranges that may be fit to features not present in the template spectra, such as H (6400–6700 Å) as well as the telluric feature in the first epoch (7200–7300 Å). We consider other features to be too weak to skew our fitting routine significantly and thus we include, for example, the wavelength range around H, which also contains Fe ii features. In this way, the statistic that we use to fit template spectra to epochs of PS15si, the RMS of , is useful primarily to compare different templates and fitting parameters within a single epoch and not as an overall “quality of fit” parameter. In Section 3.2.3, we assess the overall quality of our spectral fitting and alternative statistics in order to determine which spectral template best matches PS15si.
We report the best-fit values and for each epoch of PS15si and set of template spectra (SN Ia 1991bg-like, SN Ia 1991T-like, SN Ib/c 1999ex-like, and SN Ia-norm 1994D-like) in Table 3. We also include the ratio of the weighted template spectrum to blackbody emission ( to ) in the band (i.e., 5028–5868 Å), which we refer to as (see Leloudas et al., 2015). For each of the three fitting parameters, we approximate an uncertainty by fixing two parameters at their best-fit values and varying the third parameter until the RMS of (given in Table 4) increases by a factor of .
| Template | Par.111111 and in units of Å-1, in units of K. | 2015-03-28 | 2015-05-01 | 2015-06-13 | 2015-06-16 |
|---|---|---|---|---|---|
| 91bg-like | |||||
| 91T-like | |||||
| 99ex-like | |||||
| 94D-like | |||||
3.2.3 Quality of Spectral Fitting and the SN Ia Spectrum Underlying PS15si
As Figure 5 and Table 3 demonstrate, the statistical leverage in identifying PS15si comes mostly from the first and last epochs given the much wider spectral range. Indeed, the spectral identification, including type and epoch, as well as the intensity and temperature of blackbody emission in the other two (high-resolution) epochs is highly uncertain. While we include these spectral epochs in most of our analysis, they do not contribute significantly to our conclusions regarding spectral fitting.
The analysis described above is similar to the Monte Carlo simulation used by Leloudas et al. (2015) to fit SNe Ia/IIn spectra. Similarities between these analyses are that the template spectrum spans a range of types including SNe Ia-norm, SN 1991T-like, SN 1991bg-like, and SNe Ib/c, the variables and account for the blackbody radius and temperature, respectively, and we fix the spectral resolution of the template and blackbody to that of the input PS15si spectrum. Unlike the Leloudas et al. (2015) analysis, we do not explicitly fit the line spectrum associated with CSM interaction or artificially inject noise into our comparison spectra, we fix the reddening to the value noted above for PS15si (i.e., we use a dereddened PS15si spectrum as input), and we do not use human classifiers but rather rely solely on statistical analysis to identify the best-fit spectra.
A key parameter in the Leloudas et al. (2015) analysis is , which we describe in Section 3.2.2 and include for each PS15si epoch and template spectrum in Table 3. One of the central arguments in Leloudas et al. (2015) is that, when is large (e.g., ), dilution from the CSM emission is low enough that spectral identification is more accurate. Given that CSM emission is dominant at late times after explosion, this analysis would suggest that earlier spectra are more reliable when identifying the underlying SN.
Our analysis reveals some curious trends in matching PS15si to SN templates of varying types. In general, the SN Ib/c 1999ex-like spectra yield poor fits to PS15si with the SN emission dominant over the CSM emission () in all epochs. This trend and the large uncertainties on fitting parameters for the SN Ib/c template suggest this spectrum is unlikely to describe the underlying SN emission from PS15si.
In addition to our analysis in Section 3.2.1, from the fact that PS15si does not exhibit a clearly broad H component from emission in its ejecta and the poor fit between PS15si and SN Ib/c templates, we infer that PS15si must be a better match to SN Ia templates. This appears to be the case, as in each spectral epoch the SN Ia templates yield lower RMS values and the best fits to PS15si overall. While there is no clear preference in the RMS values for any particular template, the values and uncertainties on the fitting parameters suggest that the SN 1991bg-like template is not physically plausible. For example, in the first spectral epoch when emission from the underlying SN should be most dominant, for the SN 1991bg-like template makes it clear that the template is fitted poorly to the PS15si spectrum. The RMS value for this spectral fit supports the hypothesis that the SN 1991bg-like template is the poorest fit to PS15si in this epoch. In the final epoch, however, PS15si is better fit to the SN 1991bg-like template, although that may be due to the relative lack of continuum emission in underluminous SN 1991bg-like SNe Ia or else the fact that the available epochs of the SN 1991T template (0–93 days) do not cover as large a range as the SN 1991bg templates (0–113 days). As we discuss below for the SN 1991T-like template, it is difficult to decompose a SNe Ia/IIn into its constituent SN and CSM spectrum given the degeneracy between these components.
One might expect that if SN 1991bg-like SNe Ia are a better match to SNe Ia/IIn than SN 1991T-like SNe Ia (or vice versa), then SNe Ia-norm should fall between the two in terms of quality of fit. This trend appears to be the case in both the first and last epochs when PS15si matches the 1994D-like template about as well as the SN 1991T-like and SN 1991bg-like templates, respectively. The value of is comparable to what Leloudas et al. (2015) find for post-maximum SNe Ia/IIn templates, although it barely decreases between the best-fit values for the first and last epochs of the 1994D-like template, contrary to the observation that SNe Ia fade much more rapidly than CSM emission. Again, there are problems in that the decomposition does not fully recover the relative contribution of these components in a physically consistent manner.
Based on the uncertainties and the self-consistent evolution of the temperature across all four epochs, SN 1991T appears well-fit to PS15si. However, in the final epoch there are some differences on the blue end of the spectrum that suggest there is extra CSM emission diluting the continuum between emission features as well as much weaker emission around 5800–6000 Å, which in SN 1991T was identified in nebular spectra as [Co iii] (Schmidt et al., 1994). Overall, SN 1991T is the poorest fit to PS15si in this epoch and the fit to SN 1991T involves an extremely large value of () for this late epoch, although both of these effects might be explained by the poor approximations involved in decomposing a SN Ia/IIn spectrum into a SN Ia and CSM emission. For example, SN 1991T-like SN Ia spectra are associated with overluminous and hot SNe with significant 56Ni production and whose spectra exhibit high-ionisation lines (Filippenko et al., 1992). Perhaps the high luminosity that is associated with 56Ni production in SN 1991T-like SNe Ia instead comes almost entirely from CSM interaction in SN Ia/IIn, which would explain the poor fit to [Co iii] in the final epoch of PS15si as well as the poor fit to continuum emission between spectral lines and the unusually large ratio. We discuss further ramifications of this idea in Section 4.2.
| UT Date | 91bg-like | 91T-like | 99ex-like | 94D-like |
|---|---|---|---|---|
| (y-m-d) | ||||
| 2015-03-28 | 0.067 | 0.062 | 0.065 | 0.063 |
| 2015-05-01 | 0.048 | 0.051 | 0.052 | 0.050 |
| 2015-06-13 | 0.039 | 0.043 | 0.045 | 0.041 |
| 2015-06-16 | 0.049 | 0.081 | 0.065 | 0.049 |
4 DISCUSSION
4.1 PS15si Explosion Date and Maximum -Band Magnitude
Comparison between our photometry and light curves from other SNe Ia/IIn provides a method to infer the phase of PS15si. We acknowledge that this analysis assumes that the shape of the PS15si light curve near maximum, which is not well-constrained by our data, follows that of other SNe Ia/IIn. Recent analysis comparing several SNe Ia/IIn (SNe 2005gj, PTF11kx, 2002ic, 1999E, 1997cy in Inserra et al., 2016, and Figure 4 therein) found that light curves from most SNe Ia/IIn have a similar shape and bolometric luminosity from early times to as late as after optical maximum except for the unusual case of PTF11kx, whose bolometric luminosity fades much more quickly and is very similar to SN 1991T. For the majority of SNe Ia/IIn, variations in CSM profiles for each object may cause bolometric light curves to diverge significantly after . SN Ia/IIn absolute magnitudes also span at least in the band at maximum brightness (Silverman et al., 2013a), so calibrating a light curve to these objects will have similarly large systematic uncertainties.
In Figure 2, we compare the available -band light curve of PS15si to the exponential decay (i.e., in flux versus time) phase of SN 2005gj (Prieto et al., 2007). Estimating the -band maximum brightness of PS15si involves a degeneracy between the maximum brightness and the epoch of observation. For example, we fit the SN 2005gj light curve to PS15si assuming these objects have the same absolute magnitude in , but PS15si could have reached optical maximum earlier with a brighter maximum. From our -band photometry in Figure 2, SN 2005gj appears to be declining at a rate of , which is close to the decay rate observed in our photometry of PS15si. This rate is also significantly slower than the observed for 56Co decay in normal SNe Ia during the epoch after explosion (see, e.g., Phillips et al., 1999; Förster et al., 2013), although it is consistent with the decline rates observed in the band for other interaction-powered SN light curves (e.g., SNe 2005cp and 2005db as in Kiewe et al., 2012).
Assuming the PS15si light curve follows the same general shape as SN 2005gj in and PS15si had a maximum -band absolute magnitude of , we find that the time (in days since discovery) of optical maximum for PS15si was
| (2) |
Therefore, an -band maximum brightness equivalent to that of SN 2005gj () implies that PS15si reached maximum light at or on 2015 Mar. 5. This phase roughly agrees with that of Walton et al. (2015), in which the spectral fits to SN IIn models predicted that PS15si was after optical maximum on 2015 Mar. 28.
However, nondetections were reported toward PS15si in the band to deep limits of (i.e., ) on 23 and 24 Feb. 2015121212These data are available from the Pan-STARRS Survey for Transients at star.pst.qub.ac.uk/ps1threepi/ as described in Huber et al. (2015), before discovery, implying that the SN had not yet exploded. Assuming PS15si needed between 18 and 45 days to rise to maximum (e.g., the minimum and maximum rise times found for SNe Ia/IIn by Silverman et al., 2013a), then comparison to SN 2005gj via Equation (2) implies that PS15si reached -band maximum approximately 18 to 45 days after the last nondetection and with a magnitude in the range . Figure 2 demonstrates these constraints and shows a comparison of PS15si to the SN 2005gj light curve. In this scenario, PS15si was discovered on 23 Mar. 2015 (the -band measurement in Figure 2), before -band maximum, and had a maximum brightness of . In this model, we assume that PS15si took to rise in the band (i.e., it exploded before discovery), which matches the behaviour of SN 2005gj (Prieto et al., 2007).
4.2 Luminosity of the CSM and Underlying SN
For CSM-interacting SNe at late times and for a high wind-density parameter , the overall luminosity of the radiative forward shock wave with velocity will be (Chugai & Yungelson, 2004); this is the rate at which the shock sweeps up mass () times the energy per unit mass in the shock ().
Following the treatment presented in Ofek et al. (2014), we assume that , which implies , where we have implicitly assumed that , and , which holds for a momentum-conserving “snowplough” SN131313Ofek et al. (2014) find , where , for . (Svirski et al., 2012).
Assuming the CSM component of the -band data in Table 1 and Figure 2 follows a power-law with , i.e., (with in days since discovery), we subtract the -band luminosity from a SN 1991T-like template from our observed -band magnitudes to determine the contribution to the luminosity from CSM emission (i.e., ). We find that the residual magnitude is well-fit by , which implies . This trend in luminosity implies . The inferred power-law is relatively insensitive to the explosion time. For example, if we model the -band luminosity versus time since explosion (by adding days according to our analysis in Section 4.1), then we find , which implies and . Clearly, the density profile implied by our photometry and this model is very steep. Indeed, the self-similar CSM treatment of Chevalier (1982) breaks down for , although similar results have been reported in the much later () optical light curve of SN 2010jl (Ofek et al., 2014).
From our spectral fitting to SN 1991T-like templates, we find that a thermal continuum component fit to the spectrum of PS15si at our first and last epochs implies best fits with and , although as we discuss below, the latter temperature may be an underestimate. The second and third (higher-resolution) epochs have highly uncertain temperatures, which we do not include in this analysis. Assuming the SN has expanded to by after discovery (i.e., after explosion given the model in Section 4.1 and with an expansion velocity of ), a spherical shell emitting at will have a luminosity of about or mag. This value is far too small to account for the luminosity observed during the final epoch () when emission from the CSM should dominate the SN. There is some inconsistency in the overall shape of the spectrum at late times, especially as features from the SN are easily visible at a time when the CSM should outshine the SN emission by a few magnitudes (e.g., Figure 2 herein, and Figure 7 in Prieto et al., 2007).
However, ultraviolet/X-ray light from the reverse shock may contribute significantly to emission from the ejecta, producing a quasicontinuum with distinct spectral features. We have found that PS15si can be fit by overluminous SN 1991T-like SNe Ia spectra. This underlying SN type is consistent with other SNe Ia/IIn, but there are some remaining inconsistencies in terms of the continuum level and the relative strength of the [Co iii] feature in the final epoch. Perhaps some of the continuum emission that comes from CSM interaction in SNe Ia/IIn is misinterpreted as the hot, luminous continuum emission observed in SN 1991T-like SNe Ia. At the same time, some of the light from the CSM interaction in SNe Ia/IIn could be reprocessed by the ejecta, changing the ionisation state near the interaction region and heating new layers of ejecta as the SN evolves. This hypothesis would also explain why the spectral continuum of some SNe Ia/IIn appears to evolve from thermal to nonthermal, as in SN 2002ic (Chugai et al., 2004) and SN 2005gj (Aldering et al., 2006). In the former, the continuum emission was well-fit around 244 days after optical maximum by a quasicontinuum model composed of cool shocked ejecta emitting in lines of Fe-peak elements. Varying the mixture of elements in models of the line-emitting shocked ejecta layer may simultaneously reproduce the observed continuum level, SN Ia-like absorption features, and anomalous line strengths such as the Ca ii emission we noted in Section 3.2.
One consequence of this hypothesis would be that, with an added source of ultraviolet/X-ray emission, we would expect to observe an increased fraction of high-ionisation lines in the ejecta. Indeed, the correlation between most SNe Ia/IIn and SN 1991T-like spectra may largely be due to the added radiation from the CSM interaction, as SN 1991T exhibited a blue spectrum dominated by Fe iii absorption around maximum (Filippenko et al., 1992; Ruiz-Lapuente et al., 1992) and [Fe iii] and [Co iii] emission dominant in its nebular spectrum (Schmidt et al., 1994).
This hypothesis may explain the spectral morphology of SNe Ia/IIn, although the difficulty in identifying the characteristics of the underlying SN remains. For example, one might expect that the underlying SN Ia spectrum should be correlated with the amount of radiation produced by the CSM interaction and thus the peak luminosity of the SN. Studies suggest that SNe Ia/IIn with relatively low and high peak luminosities (e.g., SN 2008J and PTF10iuf in Taddia et al., 2012; Leloudas et al., 2015) have been associated with SN 1991T-like spectra. Are there added effects due to the distribution of the CSM, viewing angle, or dilution of the underlying spectrum from the CSM quasicontinuum? In addition, the outer layers of the SN ejecta will receive most of the added radiation from the CSM interaction, and the composition of the visible ejecta layers is largely dependent on the underlying thermonuclear explosion. While it is worth speculating on these questions, it may be impossible to disentangle the relative importance of these effects without detailed hydrodynamic and radiative-transfer models of CSM-interacting SNe.
4.3 Late-Time Rebrightening and Spectral Fitting of SNe Ia/IIn
PS15si appeared to be rebrightening in the band (increase of with significance) and the band (increase of with significance). This trend was observed in the last four epochs of our optical photometry (Table 1) in and , between and after discovery. Either the rebrightening was not as apparent in NIR observations or the trend occurred over a relatively short period of time and the SN was no longer increasing in brightness by after discovery. Our final spectral epoch corresponds to the beginning of this trend in the photometry.
The flux from a CSM-interacting SN light curve may look more like a power law at late times as opposed to exponential decay. This may cause the slope of the decay curve to change where the light curve appears to be leveling off as the CSM cools radiatively as in Section 4.2. This hypothesis does not fully explain the behaviour in , however, where the light curve is systematically brightening over the final three epochs by as much as in luminosity ().
This behaviour supports the conjecture that the CSM density profile around SNe Ia/IIn can be dense and clumpy, perhaps with steep density gradients associated with these clumps (e.g., as suggested by spectropolarimetry of H toward SN 2002ic; Wang et al., 2004). Several other SNe Ia/IIn, such as SN 1997cy (Inserra et al., 2016), have exhibited variations in their bolometric light curves over short timescales. This behaviour contrasts with rebrightening seen in the mid-IR toward SN 2005gj (Fox & Filippenko, 2013) where the increase in luminosity was observed predominantly at longer wavelengths (), over longer timescales (), and starting at least a year after the SN was discovered. In this latter case, rebrightening was thought to be due to reprocessed light from a dust shell surrounding the SN. For PS15si, interaction between the SN ejecta and clumps or a thin shell in the CSM can account for the short timescale over which the rebrightening occurred. As with core-collapse SNe IIn (e.g., SNe 2001em and 2006gy as in Schinzel et al. (2009) and Smith et al. (2008), respectively), late-time X-ray and radio-wavelength studies of SNe Ia/IIn may reveal much about the CSM profile.
5 CONCLUSION
Spectra of PS15si are well fit by spectra of other SNe Ia/IIn observed previously (Silverman et al., 2013a). Comparisons to these examples and some SN Ia subtypes, however, reveal new underlying diversity in this class of SNe, as follows.
-
1.
PS15si is best fit by spectra of overluminous SNe Ia (e.g., SN 1991T) if we add extra thermal continuum, but there are inconsistencies in the continuum level at different epochs as well as the strength of [Co iii] emission in the final epoch. This spectral morphology matches the interpretation of other SNe Ia/IIn, although we interpret this similarity as an indication of the added continuum emission and changes in the ionisation state of the visible ejecta layers brought on by CSM interaction. Detailed radiative-transfer models of shocked ejecta illuminated by CSM interaction are needed in order to satisfactorily reproduce SN Ia/IIn spectra, but PS15si illustrates that the similarity to overluminous SNe Ia is incidental to spectra of SNe Ia/IIn and not indicative of the underlying SN.
-
2.
PS15si appears to have rebrightened over a short timescale at around after discovery. Similar behaviour was also observed by Inserra et al. (2016) for SN 1997cy and in other SNe Ia/IIn where the mechanism was assumed to be clumpiness or steep density gradients in the CSM. Especially at late times, SN Ia/IIn environments are poorly fit by models assuming uniform CSM. SNe Ia/IIn may be good candidates for late-time radio and X-ray observations, which can probe the properties of the CSM out to large distances from the progenitor.
ACKNOWLEDGMENTS
We thank the staffs at the MMT and Keck Observatories for their assistance with data acquisition. Observations using Steward Observatory facilities were obtained as part of the large observing program AZTEC: Arizona Transient Exploration and Characterization. Some observations reported here were obtained at the MMT Observatory, a joint facility of the University of Arizona and the Smithsonian Institution. Some of the data presented herein were obtained at the W. M. Keck Observatory, which is operated as a scientific partnership among the California Institute of Technology, the University of California, and NASA; the observatory was made possible by the generous financial support of the W. M. Keck Foundation. The authors wish to recognise and acknowledge the very significant cultural role and reverence that the summit of Mauna Kea has always had within the indigenous Hawaiian community. We are most fortunate to have the opportunity to conduct observations from this mountain.
This work is also based in part on observations collected at the European Organisation for Astronomical Research in the Southern Hemisphere, Chile as part of PESSTO (the Public ESO Spectroscopic Survey for Transient Objects) ESO programs 188.D-3003 and 191.D-0935. Operation of the Pan-STARRS1 telescope is supported by NASA under Grant No. NNX12AR65G and Grant No. NNX14AM74G issued through the NEO Observation Program.
C.D.K.’s research is supported by NASA through Contract Number 1255094 issued by JPL/Caltech. N.S.’s research receives support from NSF grants AST-1312221 and AST-1515559. The supernova research of A.V.F.’s group at U.C. Berkeley is supported by Gary & Cynthia Bengier, the Richard & Rhoda Goldman Fund, the Christopher R. Redlich Fund, the TABASGO Foundation, and NSF grant AST-1211916.
References
- Aldering et al. (2006) Aldering G., et al., 2006, ApJ, 650, 510
- Arnett (1968) Arnett W. D., 1968, Nature, 219, 1344
- Bowers et al. (1997) Bowers E. J. C., Meikle W. P. S., Geballe T. R., Walton N. A., Pinto P. A., Dhillon V. S., Howell S. B., Harrop-Allin M. K., 1997, MNRAS, 290, 663
- Chevalier (1982) Chevalier R. A., 1982, ApJ, 259, 302
- Chevalier & Fransson (1994) Chevalier R. A., Fransson C., 1994, ApJ, 420, 268
- Chugai & Yungelson (2004) Chugai N. N., Yungelson L. R., 2004, Astronomy Letters, 30, 65
- Chugai et al. (2004) Chugai N. N., Chevalier R. A., Lundqvist P., 2004, MNRAS, 355, 627
- Colless et al. (2003) Colless M., et al., 2003, VizieR Online Data Catalog, 7226, 0
- Deng et al. (2004) Deng J., et al., 2004, ApJ, 605, L37
- Dilday et al. (2012) Dilday B., et al., 2012, Science, 337, 942
- Drake et al. (2012) Drake A. J., et al., 2012, The Astronomer’s Telegram, 4081, 1
- Filippenko (1982) Filippenko A. V., 1982, PASP, 94, 715
- Filippenko (1997) Filippenko A. V., 1997, ARA&A, 35, 309
- Filippenko et al. (1992) Filippenko A. V., et al., 1992, ApJ, 384, L15
- Filippenko et al. (2008) Filippenko A. V., Silverman J. M., Mostardi R., Griffith C. V., 2008, Central Bureau Electronic Telegrams, 1420
- Foley et al. (2013) Foley R. J., et al., 2013, ApJ, 767, 57
- Förster et al. (2013) Förster F., González-Gaitán S., Folatelli G., Morrell N., 2013, ApJ, 772, 19
- Fox & Filippenko (2013) Fox O. D., Filippenko A. V., 2013, ApJ, 772, L6
- Fox et al. (2015) Fox O. D., et al., 2015, MNRAS, 447, 772
- Graham et al. (2015) Graham M. L., Nugent P. E., Sullivan M., Filippenko A. V., Cenko S. B., Silverman J. M., Clubb K. I., Zheng W., 2015, MNRAS, 454, 1948
- Hamuy et al. (2002) Hamuy M., et al., 2002, AJ, 124, 417
- Hamuy et al. (2003) Hamuy M., et al., 2003, Nature, 424, 651
- Hicken et al. (2007) Hicken M., Garnavich P. M., Prieto J. L., Blondin S., DePoy D. L., Kirshner R. P., Parrent J., 2007, ApJ, 669, L17
- Howell et al. (2006) Howell D. A., et al., 2006, Nature, 443, 308
- Hoyle & Fowler (1960) Hoyle F., Fowler W. A., 1960, ApJ, 132, 565
- Huber et al. (2015) Huber M., et al., 2015, The Astronomer’s Telegram, 7153, 1
- Immler et al. (2006) Immler S., et al., 2006, ApJ, 648, L119
- Inserra et al. (2016) Inserra C., et al., 2016, MNRAS, 459, 2721
- Jester et al. (2005) Jester S., et al., 2005, AJ, 130, 873
- Kasen et al. (2003) Kasen D., et al., 2003, ApJ, 593, 788
- Kawabata et al. (2009) Kawabata K. S., Tanaka M., Maeda K., Hattori T., Nomoto K., Tominaga N., Yamanaka M., 2009, ApJ, 697, 747
- Kiewe et al. (2012) Kiewe M., et al., 2012, ApJ, 744, 10
- Kotak et al. (2004) Kotak R., Meikle W. P. S., Adamson A., Leggett S. K., 2004, MNRAS, 354, L13
- Leloudas et al. (2015) Leloudas G., et al., 2015, A&A, 574, A61
- Leonard (2007) Leonard D. C., 2007, ApJ, 670, 1275
- Liu et al. (1997) Liu W., Jeffery D. J., Schultz D. R., 1997, ApJ, 483, L107
- Marion et al. (2003) Marion G. H., Höflich P., Vacca W. D., Wheeler J. C., 2003, ApJ, 591, 316
- Mauerhan & Smith (2012) Mauerhan J., Smith N., 2012, MNRAS, 424, 2659
- Mazzali et al. (2005) Mazzali P. A., Benetti S., Stehle M., Branch D., Deng J., Maeda K., Nomoto K., Hamuy M., 2005, MNRAS, 357, 200
- Nomoto (1986) Nomoto K., 1986, Annals of the New York Academy of Sciences, 470, 294
- Nugent et al. (2002) Nugent P., Kim A., Perlmutter S., 2002, PASP, 114, 803
- Ofek et al. (2014) Ofek E. O., et al., 2014, ApJ, 781, 42
- Oke et al. (1995) Oke J. B., et al., 1995, PASP, 107, 375
- Patat et al. (2007) Patat F., et al., 2007, A&A, 474, 931
- Patat et al. (2009) Patat F., Baade D., Höflich P., Maund J. R., Wang L., Wheeler J. C., 2009, A&A, 508, 229
- Patat et al. (2012) Patat F., Höflich P., Baade D., Maund J. R., Wang L., Wheeler J. C., 2012, A&A, 545, A7
- Phillips (1993) Phillips M. M., 1993, ApJ, 413, L105
- Phillips et al. (1992) Phillips M. M., Wells L. A., Suntzeff N. B., Hamuy M., Leibundgut B., Kirshner R. P., Foltz C. B., 1992, AJ, 103, 1632
- Phillips et al. (1999) Phillips M. M., Lira P., Suntzeff N. B., Schommer R. A., Hamuy M., Maza J., 1999, AJ, 118, 1766
- Porter et al. (2016) Porter A. L., et al., 2016, preprint, (arXiv:1605.03994)
- Prieto et al. (2007) Prieto J. L., et al., 2007, preprint, (arXiv:0706.4088)
- Rigon et al. (2003) Rigon L., et al., 2003, MNRAS, 340, 191
- Ruiz-Lapuente et al. (1992) Ruiz-Lapuente P., Cappellaro E., Turatto M., Gouiffes C., Danziger I. J., della Valle M., Lucy L. B., 1992, ApJ, 387, L33
- Schinzel et al. (2009) Schinzel F. K., Taylor G. B., Stockdale C. J., Granot J., Ramirez-Ruiz E., 2009, ApJ, 691, 1380
- Schlafly & Finkbeiner (2011) Schlafly E. F., Finkbeiner D. P., 2011, ApJ, 737, 103
- Schmidt et al. (1994) Schmidt B. P., Kirshner R. P., Leibundgut B., Wells L. A., Porter A. C., Ruiz-Lapuente P., Challis P., Filippenko A. V., 1994, ApJ, 434, L19
- Shappee et al. (2013) Shappee B. J., Stanek K. Z., Pogge R. W., Garnavich P. M., 2013, ApJ, 762, L5
- Silverman et al. (2011) Silverman J. M., Ganeshalingam M., Li W., Filippenko A. V., Miller A. A., Poznanski D., 2011, MNRAS, 410, 585
- Silverman et al. (2013a) Silverman J. M., et al., 2013a, ApJS, 207, 3
- Silverman et al. (2013b) Silverman J. M., et al., 2013b, ApJ, 772, 125
- Smartt et al. (2013) Smartt S. J., et al., 2013, The Messenger, 154, 50
- Smith et al. (2008) Smith N., et al., 2008, ApJ, 686, 485
- Smith et al. (2010) Smith N., Chornock R., Silverman J. M., Filippenko A. V., Foley R. J., 2010, ApJ, 709, 856
- Smith et al. (2015) Smith K. W., et al., 2015, The Astronomer’s Telegram, 7280, 1
- Stern et al. (2004) Stern D., et al., 2004, ApJ, 612, 690
- Svirski et al. (2012) Svirski G., Nakar E., Sari R., 2012, ApJ, 759, 108
- Taddia et al. (2012) Taddia F., et al., 2012, A&A, 545, L7
- Turatto et al. (1993) Turatto M., Cappellaro E., Danziger I. J., Benetti S., Gouiffes C., della Valle M., 1993, MNRAS, 262, 128
- Valenti et al. (2014) Valenti S., et al., 2014, MNRAS, 437, 1519
- Walton et al. (2015) Walton N., et al., 2015, The Astronomer’s Telegram, 7308, 1
- Wang et al. (1996) Wang L., Wheeler J. C., Li Z., Clocchiatti A., 1996, ApJ, 467, 435
- Wang et al. (2004) Wang L., Baade D., Höflich P., Wheeler J. C., Kawabata K., Nomoto K., 2004, ApJ, 604, L53
- Wang et al. (2009) Wang X., et al., 2009, ApJ, 699, L139
- Williams et al. (2008) Williams G. G., Milne P. A., Park H. S., Barthelmy S. D., Hartmann D. H., Updike A., Hurley K., 2008, in Galassi M., Palmer D., Fenimore E., eds, American Institute of Physics Conference Series Vol. 1000, American Institute of Physics Conference Series. pp 535–538 (arXiv:0803.0021), doi:10.1063/1.2943525
- Wood-Vasey et al. (2004) Wood-Vasey W. M., Wang L., Aldering G., 2004, ApJ, 616, 339
- Yaron & Gal-Yam (2012) Yaron O., Gal-Yam A., 2012, PASP, 124, 668
- Zhang et al. (2012) Zhang T., et al., 2012, AJ, 144, 131