Variation of transition temperatures and residual resistivity ratio in vapor-grown FeSe
Abstract
The study of the iron-based superconductor FeSe has blossomed with the availability of high-quality single crystals, obtained through flux/vapor-transport growth techniques below the structural transformation temperature of its tetragonal phase, C. Here, we report on the variation of sample morphology and properties due to small modifications in the growth conditions. A considerable variation of the superconducting transition temperature , from 8.8 K to 3 K, which cannot be correlated with the sample composition, is observed. Instead, we point out a clear correlation between and disorder, as measured by the residual resistivity ratio. Notably, the tetragonal-to-orthorhombic structural transition is also found to be quite strongly disorder dependent ( K), and linearly correlated with .
I Introduction
Among the Fe-based superconductors, the binary FeSe has the simplest crystallographic structure and some of the most intriguing properties. FeSe in its tetragonal, PbO-type structure, is superconducting with a K at ambient pressureHsu et al. (2008), which is enhanced four-fold up to 37 K under pressureMedvedev et al. (2009). Furthermore, FeSe exhibits an intensively studied nematic (i.e., orthorhombic and paramagnetic) phase that, unusually, extends from a tetragonal-to-orthorhombic structural transition at K down to at ambient pressureMcQueen et al. (2009); Watson et al. (2015). FeSe also features a rather elusive, small-moment magnetically ordered phaseBendele et al. (2010, 2012); Sun et al. (2015); Kothapalli et al. (2016) induced by pressure. Extremely small Fermi surfaces, related to strong orbital selective electronic correlationsMaletz et al. (2014), place superconductivity in FeSe in the vicinity of the interesting BCS-BEC crossover regimeKasahara et al. (2014). The detailed study of all these properties was facilitated, and in some cases only made possible, by the availability of high-quality single crystals. Notably, single-crystal preparation is complicated by the rather complex binary Fe-Se composition-temperature phase diagramOkamoto (1991). In particular, the superconducting tetragonal PbO-type phase of FeSe has only a very narrow range of stability and undergoes a phase transformation on warming above 457∘C. In consequence, any preparation procedure above this temperature yields samples not formed in the tetragonal phase, that structurally transform upon cooling to room temperature. This inevitably leads to impurity phases and internal strains, thus reducing crystal quality.
Early studies of FeSe used polycrystalline material prepared by solid state synthesisHsu et al. (2008); Mizuguchi et al. (2008); Margadonna et al. (2008); Pomjakushina et al. (2009); McQueen et al. (2009). In particular, the detailed investigation in Ref. McQueen et al., 2009 shows how the properties of these polycrystalline samples are affected by annealing at temperatures between 300∘C-450∘C. There are also several early studies of the growth of tetragonal FeSe using Cl-salt-based flux techniquesZhang et al. (2008); Braithwaite et al. (2009); Hu et al. (2011) and chemical vapor transportPatel et al. (2009); Hara et al. (2010). In many of these studies, it was observed that crystals (which formed at C) have a (partially) hexagonal habit and are composed of both hexagonal and tetragonal phases, a consequence of the phase transformation described above. AlCl3 has been known for many years as a transport agent for metals, selenides and sulfides Moh and Taylor (1971); Lutz et al. (1974). A breakthrough came with the use of a eutectic mix of KCl and AlCl3 salts with low melting temperature to obtain FeSe directly in its tetragonal phase in fluxChareev et al. (2013) or vapor transportBöhmer et al. (2013) techniques below 450∘C. This significantly improved the crystal quality, as shown by an approximately ten-fold increase in residual resistivity ratio with respect to the previously available samplesKasahara et al. (2014). In this report, we describe how changes in the conditions of the sample growth influence the morphology and the properties of the obtained material and point out a correlation between residual resistivity ratio, , and .
II Experimental details
Single crystals of FeSe were prepared by a chemical vapor transport technique using elemental Fe and Se and a eutectic mix of the chlorine salts, KCl and AlCl3 (molar ratio 1:2), in a constant temperature gradient. The furnace was tilted at an angle of to enhance convection (see Fig. 1). The Fe:Se ratio, the temperature conditions and the amount of starting materials were varied. A total of more than 20 batches were studied. Powder x-ray diffraction was performed using a Rigaku Miniflex II diffractometer with Cu Kα radiation. The compositions of crystals from three batches were refined using wave-length dispersive x-ray spectroscopy (WDS). Magnetization was measured using a Quantum Design MPMS SQUID in a field of 20 Oe under zero-field cooled conditions and with arbitrary orientation of the often very small single crystals. Multiple pieces were checked for each batch. Electrical resistance was measured using a LR-700 resistance bridge and contacts were made with silver epoxy and silver paint.
III Results of growth experiments
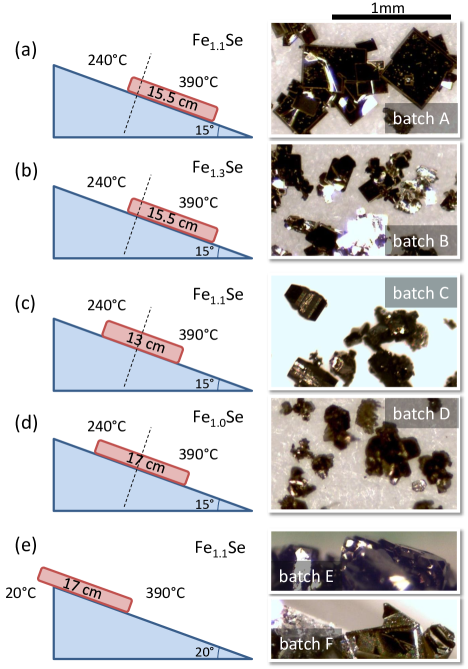
A series of growths with a small amount of starting materials (20 mg Fe powder) diluted in 1 g of KCl/AlCl3 were studied. The study of this series was instigated by the need to optimize and reproducibly grow crystals of isotopically pure 57FeSe for synchrotron Mössbauer spectroscopyKothapalli et al. (2016). Such growths had to be performed in a small batches due to the cost of 57Fe. The starting materials were sealed in a silica ampoule of 13-17 cm length and 14 mm inner diameter. The ampoules were placed in a two-zone furnace with two heater coils of 10 cm length each located 4 cm apart from each other. The growth time was typically 10-14 days. Results from a few selected experiments are presented in Fig. 1 (a)-(d). As shown in Fig. 1 (a), we successfully obtained tetragonal plate-like single crystals using this small-scale experiment with a ratio of Fe to Se powder of 1.1:1 and with the two zone temperatures set to 240∘C and 390∘C (batch A). To test the sensitivity to the starting composition, batch B was prepared with an Fe:Se ratio of 1.3:1 (Fig. 1 (b)). Still, well-defined platelet-like single crystals, albeit smaller than for batch A, were obtained. In contrast, by simply changing the position of the ampoule in the furnace as indicated in Fig. 1 (c), crystals of different morphology, namely rod-like with occasionally well-formed side facets, were obtained. This shift of the ampoule further into the 240∘C zone of the furnace most likely brings the actual temperature of the cold end closer to 240∘C. Powder x-ray diffraction confirms this batch C also to be in the PbO-type tetragonal phase. Finally, Fig. 1 (d) shows an experiment with a lower Fe:Se ratio of 1:1. A mixed phase batch is obtained, which contains samples of hexagonal and of tetragonal morphology. The hexagonal samples are attracted to a magnet at room temperature. As shown by the compositional analysis below, these are likely composed of the known ferrimagnetic Fe7Se8 phaseOkazaki (1961). These experiments show that a small Fe excess is important to suppress the formation of the hexagonal phase, even though the amount of excess Fe is less critical. The sensitivity to the ampoule position in the furnace further indicates that the growth is very sensitive to temperature conditions.
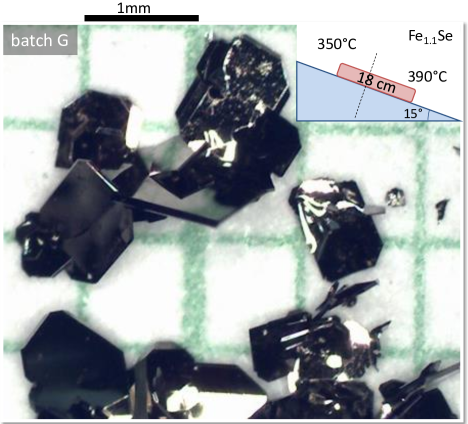
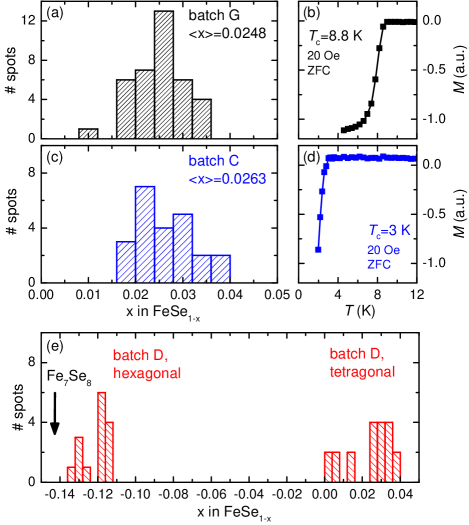
Fig 1 (e) shows batches E and F which were prepared using even more extreme, and far less controlled, temperature gradients in a 36 cm long tilted tube furnace with one end of the ampoules sticking out of the furnace and having temperatures of C-200∘C. For batch F, additionally, lump iron instead of Fe powder was used. In both cases, the amount of starting materials was larger with 250 mg of Fe, mixed with Se in a molar ratio of 1.1:1, and 5 g of KCl/AlCl3 mix. As shown below, these growths are examples of the largest variation of crystal quality.
Having observed that the size of the temperature gradient has a large effect on size and morphology of the single crystals grown, we prepared another batch (batch G, shown in Fig. 2) using a smaller and well-controlled temperature gradient, namely 350∘C and 390∘C in the tilted two-zone furnace. The amount of starting materials was 250 mg of Fe, mixed with Se in a molar ratio of 1.1:1 and 5 g of KCl/AlCl3. The single crystals from this batch have homogeneous properties and a morphology similar to the high-quality single crystals reported elsewhere (e.g., Refs. Kasahara et al., 2014; Watson et al., 2015; Sun et al., 2015). They were used for studies in Refs. Tanatar et al., 2015; Kaluarachchi et al., 2016; Kothapalli et al., 2016; Teknowijoyo et al., 2016 and have a structural transition at K, a superconducting transition temperature of K and a ratio between the resistance at 300 K and the resistance just above of . Here, batch G will serve as a reference for composition and physical properties. We note that samples in Refs. Böhmer et al., 2013; Böhmer, 2014 were prepared in a temperature gradient created by placing the ampoule with one end close to the opening of a single-zone furnace. Below, we compare the transition temperatures of these earlier samples with those of the batches G,E and F.
It has been reported in a study of polycrystalline samples that varies sensitively as a function of sample composition, in FeSe1-x (Ref. McQueen et al., 2009). In particular, it was shown that is highest for samples with the lowest degree of off-stoichiometry and the changes in composition have been related to the synthesis/annealing temperature. In Fig 3. (a)-(d), we show composition and superconducting transition of two contrasting batches, batch C and the reference batch G. We find that the of batch G is reproducibly K, however, samples from batch C have reproducibly a very low K. Using WDS, the composition of 4-5 samples of each batch (2-15 clean, flat spots on each sample) was determined and the histogram of the results is shown in Fig. 3 (a), (c). In contrast to the expectation, WDS yields the same composition for the two batches within error, namely Fe:Se=1:0.975(6). We note that the composition as determined by WDS may have a larger systematic error, which does not, however, affect the comparison between the two batches. For comparison, a different technique, namely full structural refinement of single-crystal four-circle x-ray data in Refs. Böhmer et al., 2013; Böhmer, 2014 yielded compositions closer to stoichiometry, Fe:Se = 0.995(5):1, for three vapor-grown single crystals with K and K.
The composition histogram for batch D, which contains samples both of tetragonal and hexagonal morphology, is shown in Fig. 3 (e). The two phases are also clearly distinguished from their composition. Samples of hexagonal morphology have a significant Se excess and are in composition close to the reported, room-temperature ferrimagnetic Fe7Se8 phaseOkazaki (1961), whereas samples with tetragonal morphology are similar in composition to the other batches. The superconducting transition temperature of the tetragonal samples of this batch varies considerably between K.
IV Resistance: Results and discussion
Being unable to relate the large variation to compositional changes within the of resolution of our measurements, we consider whether disorder might be the dominant factor in determining . It is well-known that is very sensitive to disorder in many unconventional superconductors. A simple measure for disorder is the residual resistivity ratio (RRR). Below, we use the ratio between the electrical resistance at K and the resistance just above for the RRR value. Since batches like C, prepared with only 20 mg of Fe powder, do not contain samples large enough for resistance measurements, we turn to two other batches (E and F, showing in Fig. 2 (e)), which were intentionally prepared as to contain ’lower-quality’ single crystals by using a large temperature gradient. For batch F, we additionally used lump Fe instead of Fe powder, which resulted in samples of significantly varying .
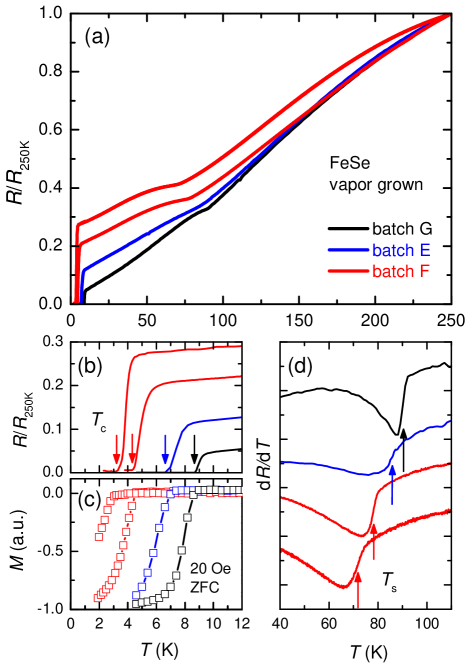
Fig. 4 shows resistivity curves of four samples, selected for their variation in properties from batches E, F and G. The superconducting transition is more clearly seen in the expanded temperature scale in Fig. 4 (b) and also in the zero-field cooled magnetization in Fig. 4 (c). We define as the temperature at which the resistivity reaches zero, coinciding with the onset of diamagnetic shielding. The structural transition is clearly seen as a kink in the resistivity data, which results in a step in the derivative (Fig. 4 (d)). This feature has frequently been overlooked in data on polycrystalline samples. As evident from the figure, samples with a lower value of their residual resistivity ratio have a lower and also a lower . Notably, the structural transition remains rather sharp, even when is decreased by almost 15 K in a sample from batch F.
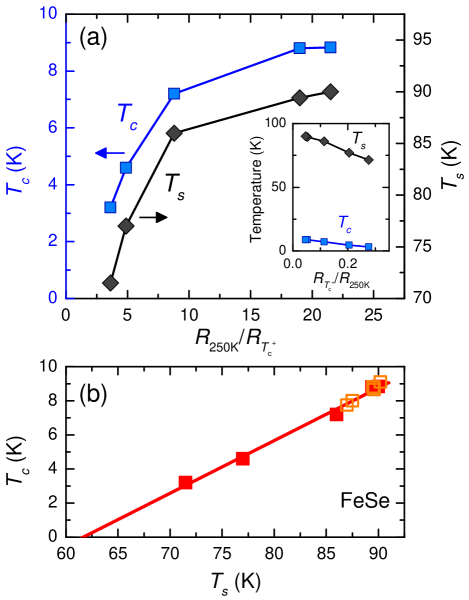
The correlation between the RRR value, and is summarized in Fig. 5. Both and have very similar dependences on RRR value and both seem to saturate around , suggesting that very pure samples would show K and K. Remarkably, there is a linear relation between and when the sample-to-sample variation is taken as an implicit parameter (Fig. 5 (b)). An extrapolation of this relation indicates that K corresponds to the complete suppression of superconductivity. Here, we also compare with samples from five different batches associated with Refs. Böhmer et al., 2013; Böhmer, 2014. For these samples, and were determined by high-resolution thermal expansion, which is a thermodynamic bulk probe and very reliable and sensitive in the detection of phase transitions. All data fall on the same curve indicating that the relation between and is robust. The inset in Fig. 5 (a) shows the transition temperatures as a function of the inverse, 1/RRR. 1/RRR, as a measure of disorder scattering, could be considered a ’tuning parameter’ here, which significantly decreases both and . A clear question, yet to be resolved, is the microscopic origin of this RRR variation.
It is interesting to compare the evolution of transition temperatures in the inset of Fig. 5 (a) with the effects of common tuning parameters. For example, chemical substitution with sulfur or tellurium also suppresses , but slightly increases for low substitution valuesMizuguchi et al. (2009). Similarly, hydrostatic pressure decreases and increases initially Miyoshi et al. (2014); Knöner et al. (2015); Kaluarachchi et al. (2016). Recently, it was shown that a dose of 2.5 MeV electron irradiation producing approximately Frenkel pairs per formula unit, decreases by 0.9 K and increases by 0.4 K (Ref. Teknowijoyo et al., 2016), similarly to the effects of pressure and Te or S substitution, but different from the sample-to-sample variation observed here. This indicates that origin of the variation of RRR, and in our samples is more complex than simple vacancy/interstitial-type defects, suggesting instead more extended defects such as dislocation lines.
Notably, the structural transition in FeSe is almost as sensitive to disorder as superconductivity. This is reminiscent of other Fe-based compounds. For example, of BaFe2As2 was found to increase from 136 K to 142 K on annealing Ishida et al. (2011). Such a strong disorder dependence is consistent with an electronically-driven structural transition, often referred to as electronic nematicity in this class of materials. It would be interesting to determine whether the pressure-induced magnetic transition of FeSeBendele et al. (2010, 2012); Kothapalli et al. (2016) is similarly sensitive to the sample-to-sample variation and correlates with and under these conditions. Finally, we note that our results stress the importance of carefully separating small changes of due to changes in preparation conditions from effects of chemical substitution.
V Summary
In summary, we studied the variation of sample morphology, transition temperatures and residual resistivity ratio with small modifications in the preparation conditions of vapor-grown FeSe single crystals. We find that some excess Fe in the starting composition suppresses the formation of the competing hexagonal Fe7Se8 phase, however, its exact amount is less important. The growth seems strongly influenced by the temperature conditions. We find that the highest and most uniform quality crystals are produced with an Fe:Se ratio of 1.1:1 and a small, well-controlled temperature gradient of 350∘C-390∘C. Both transition temperatures and are found to decrease sensitively with residual resistivity ratio, however, no correlation between and sample composition was found. In particular, the high sensitivity of to disorder is consistent with the structural transition being of electronic origin.
Acknowledgements
We are grateful to S. L. Bud’ko for the critical reading of the manuscript and his valuable comments. This work was carried out at the Iowa State University and supported by the Ames Laboratory, US DOE, under Contract No. DE-AC02-07CH11358. A.E.B. also acknowledges support from the Helmholtz association via PD-226.
References
- Hsu et al. (2008) F.-C. Hsu, J.-Y. Luo, K.-W. Yeh, T.-K. Chen, T.-W. Huang, P. M. Wu, Y.-C. Lee, Y.-L. Huang, Y.-Y. Chu, D.-C. Yan, and M.-K. Wu, Proceedings of the National Academy of Sciences 105, 14262 (2008).
- Medvedev et al. (2009) S. Medvedev, T. M. McQueen, I. A. Troyan, T. Palasyuk, M. I. Eremets, R. J. Cava, S. Naghavi, F. Casper, V. Ksenofontov, G. Wortmann, and C. Felser, Nature Mat. 8, 630 (2009).
- McQueen et al. (2009) T. M. McQueen, A. J. Williams, P. W. Stephens, J. Tao, Y. Zhu, V. Ksenofontov, F. Casper, C. Felser, and R. J. Cava, Phys. Rev. Lett. 103, 057002 (2009).
- Watson et al. (2015) M. D. Watson, T. K. Kim, A. A. Haghighirad, N. R. Davies, A. McCollam, A. Narayanan, S. F. Blake, Y. L. Chen, S. Ghannadzadeh, A. J. Schofield, M. Hoesch, C. Meingast, T. Wolf, and A. I. Coldea, Phys. Rev. B 91, 155106 (2015).
- Bendele et al. (2010) M. Bendele, A. Amato, K. Conder, M. Elender, H. Keller, H.-H. Klauss, H. Luetkens, E. Pomjakushina, A. Raselli, and R. Khasanov, Phys. Rev. Lett. 104, 087003 (2010).
- Bendele et al. (2012) M. Bendele, A. Ichsanow, Y. Pashkevich, L. Keller, T. Strässle, A. Gusev, E. Pomjakushina, K. Conder, R. Khasanov, and H. Keller, Phys. Rev. B 85, 064517 (2012).
- Sun et al. (2015) J. P. Sun, K. Matsuura, G. Z. Ye, Y. Mizukami, M. Shimozawa, K. Matsubayashi, M. Yamashita, T. Watashige, S. Kasahara, Y. Matsuda, J.-Q. Yan, B. C. Sales, Y. Uwatoko, J.-G. Cheng, and T. Shibauchi, ArXiv e-prints (2015), 1512.06951 .
- Kothapalli et al. (2016) K. Kothapalli, A. E. Böhmer, W. T. Jayasekara, B. G. Ueland, P. Das, A. Sapkota, V. Taufour, Y. Xiao, E. E. Alp, S. L. Bud’ko, P. C. Canfield, A. Kreyssig, and A. I. Goldman, ArXiv e-prints (2016), arXiv:1603.04135 .
- Maletz et al. (2014) J. Maletz, V. B. Zabolotnyy, D. V. Evtushinsky, S. Thirupathaiah, A. U. B. Wolter, L. Harnagea, A. N. Yaresko, A. N. Vasiliev, D. A. Chareev, A. E. Böhmer, F. Hardy, T. Wolf, C. Meingast, E. D. L. Rienks, B. Büchner, and S. V. Borisenko, Phys. Rev. B 89, 220506 (2014).
- Kasahara et al. (2014) S. Kasahara, T. Watashige, T. Hanaguri, Y. Kohsaka, T. Yamashita, Y. Shimoyama, Y. Mizukami, R. Endo, H. Ikeda, K. Aoyama, T. Terashima, S. Uji, T. Wolf, H. von Löhneysen, T. Shibauchi, and Y. Matsuda, Proceedings of the National Academy of Sciences 111, 16309 (2014).
- Okamoto (1991) H. Okamoto, Journal of Phase Equilibria 12, 383 (1991).
- Mizuguchi et al. (2008) Y. Mizuguchi, F. Tomioka, S. Tsuda, T. Yamaguchi, and Y. Takano, Applied Physics Letters 93, 152505 (2008).
- Margadonna et al. (2008) S. Margadonna, Y. Takabayashi, M. T. McDonald, K. Kasperkiewicz, Y. Mizuguchi, Y. Takano, A. N. Fitch, E. Suard, and K. Prassides, Chem. Commun. 43, 5607 (2008).
- Pomjakushina et al. (2009) E. Pomjakushina, K. Conder, V. Pomjakushin, M. Bendele, and R. Khasanov, Phys. Rev. B 80, 024517 (2009).
- McQueen et al. (2009) T. M. McQueen, Q. Huang, V. Ksenofontov, C. Felser, Q. Xu, H. Zandbergen, Y. S. Hor, J. Allred, A. J. Williams, D. Qu, J. Checkelsky, N. P. Ong, and R. J. Cava, Phys. Rev. B 79, 014522 (2009).
- Zhang et al. (2008) S. B. Zhang, Y. P. Sun, X. D. Zhu, X. B. Zhu, B. S. Wang, G. Li, H. C. Lei, X. Luo, Z. R. Yang, W. H. Song, and J. M. Dai, Superconductor Science and Technology 22, 015020 (2008).
- Braithwaite et al. (2009) D. Braithwaite, B. Salce, G. Lapertot, F. Bourdarot, C. Marin, D. Aoki, and M. Hanfland, Journal of Physics: Condensed Matter 21, 232202 (2009).
- Hu et al. (2011) R. Hu, H. Lei, M. Abeykoon, E. S. Bozin, S. J. L. Billinge, J. B. Warren, T. Siegrist, and C. Petrovic, Phys. Rev. B 83, 224502 (2011).
- Patel et al. (2009) U. Patel, J. Hua, S. H. Yu, S. Avci, Z. L. Xiao, H. Claus, J. Schlueter, V. V. Vlasko-Vlasov, U. Welp, and W. K. Kwok, Applied Physics Letters 94, 082508 (2009).
- Hara et al. (2010) Y. Hara, K. Takase, A. Yamasaki, H. Sato, N. Miyakawa, N. Umeyama, and S. Ikeda, Physica C: Superconductivity 470, Supplement 1, S313 (2010), proceedings of the 9th International Conference on Materials and Mechanisms of Superconductivity.
- Moh and Taylor (1971) G. Moh and L. Taylor, Neues Jahrbuch für Mineralogie - Monatshefte 10, 450 (1971).
- Lutz et al. (1974) H. D. Lutz, K.-H. Bertram, G. Wrobel, and M. Ridder, Monatshefte für Chemie 105, 849 (1974).
- Chareev et al. (2013) D. Chareev, E. Osadchii, T. Kuzmicheva, J.-Y. Lin, S. Kuzmichev, O. Volkova, and A. Vasiliev, CrystEngComm 15, 1989 (2013).
- Böhmer et al. (2013) A. E. Böhmer, F. Hardy, F. Eilers, D. Ernst, P. Adelmann, P. Schweiss, T. Wolf, and C. Meingast, Phys. Rev. B 87, 180505 (2013).
- Okazaki (1961) A. Okazaki, Journal of the Physical Society of Japan 16, 1162 (1961).
- Tanatar et al. (2015) M. A. Tanatar, A. E. Böhmer, E. I. Timmons, M. Schütt, G. Drachuck, V. Taufour, S. L. Bud’ko, P. C. Canfield, R. M. Fernandes, and R. Prozorov, ArXiv e-prints (2015), 1511.04757 .
- Kaluarachchi et al. (2016) U. S. Kaluarachchi, V. Taufour, A. E. Böhmer, M. A. Tanatar, S. L. Bud’ko, V. G. Kogan, R. Prozorov, and P. C. Canfield, Phys. Rev. B 93, 064503 (2016).
- Teknowijoyo et al. (2016) S. Teknowijoyo, K. Cho, M. A. Tanatar, J. Gonzales, A. E. Böhmer, O. Cavani, V. Mishra, P. J. Hirschfeld, S. L. Bud’ko, P. C. Canfield, and R. Prozorov, ArXiv e-prints (2016), arXiv:1605.04170 [cond-mat.supr-con] .
- Böhmer (2014) A. E. Böhmer, Competing Phases in Iron-Based Superconductors Studied by High-Resolution Thermal-Expansion and Shear-Modulus Measurements, Ph.D. thesis (2014), Karlsruhe, KIT, Diss., 2014.
- Mizuguchi et al. (2009) Y. Mizuguchi, F. Tomioka, S. Tsuda, T. Yamaguchi, and Y. Takano, Journal of the Physical Society of Japan 78, 074712 (2009).
- Miyoshi et al. (2014) K. Miyoshi, K. Morishita, E. Mutou, M. Kondo, O. Seida, K. Fujiwara, J. Takeuchi, and S. Nishigori, Journal of the Physical Society of Japan 83, 013702 (2014).
- Knöner et al. (2015) S. Knöner, D. Zielke, S. Köhler, B. Wolf, T. Wolf, L. Wang, A. Böhmer, C. Meingast, and M. Lang, Phys. Rev. B 91, 174510 (2015).
- Ishida et al. (2011) S. Ishida, T. Liang, M. Nakajima, K. Kihou, C. H. Lee, A. Iyo, H. Eisaki, T. Kakeshita, T. Kida, M. Hagiwara, Y. Tomioka, T. Ito, and S. Uchida, Phys. Rev. B 84, 184514 (2011).