Magnetic field strength in an intermediate-velocity ionized filament
in the First Galactic Quadrant
Abstract
We investigate the magnetic field in an intermediate-velocity filament for which the H intensity in the WHAM survey correlates with excess Faraday rotation of extragalactic radio sources over the length of the filament from to . The density-weighted mean magnetic field is G, derived from rotation measures and an empirical relation between H emission measure and dispersion measure from Berkhuijsen et al. (2006). In view of the uncertainties in the derived magnetic field strength, we propose an alternative use of the available data, rotation measure and emission measure, to derive a lower limit to the Alfvén speed, weighted by electron density . We find lower limits to the Alfvén speed that are comparable to, or larger than the sound speed in a plasma, and conclude that the magnetic field is dynamically important. We discuss the role of intermediate-velocity gas as a locus of Faraday rotation in the interstellar medium, and propose this lower limit to the Alfvén speed may also be applicable to Faraday rotation by galaxy clusters.
Subject headings:
polarization — ISM: magnetic fields — ISM: evolution1. Introduction
Structure in the interstellar medium (ISM) is in part created by ejection of matter from stars in the form of stellar winds and supernova explosions that transfer significant amounts of matter, energy and momentum to the surrounding gas. This stellar feedback accelerates, compresses and heats the surrounding gas on scales up to hundreds of pc (McKee & Ostriker, 1977). This turbulent energy is an essential part of the dynamo mechanism that forms large-scale magnetic fields in galaxies (e.g. Kulsrud, 1999). In return, a sufficiently strong magnetic field can restrict the dynamics of the ISM through its coupling to charged particles, even if the ionization fraction is low. The ratio of gas pressure to magnetic pressure, or the ratio of the sound speed to the Alfvén speed, is used to quantify the dynamical importance of the magnetic field.
The potential importance of magnetic fields for the topology of the ISM on small scales was recognized more than 50 years ago (Shajn, 1958), although it has become clear that the relation between filamentary structure and magnetic fields can be complex (Crutcher, 2012, for a review). A lot of work has focused on the effects of expanding super bubbles on scales of hundreds of parsecs (e.g. McKee & Ostriker, 1977; Ferrière et al., 1991; Tomisaka, 1998; Stil et al., 2009; Van Marle et al, 2015). In recent years, parsec-scale filamentary structure was revealed in the local ISM, associated with thin filaments of atomic hydrogen gas that are aligned with the local magnetic field revealed by polarization of starlight (McClure-Griffiths et al., 2006; Clark et al., 2014), and also in filaments of interstellar dust (Ade et al., 2014).
Faraday rotation of the plane of polarization of linearly polarized radio waves has proven to be an effective probe of the Milky Way’s global magnetic field, as well as small-scale structure down to parsec scales (Haverkorn, 2015, for a recent review). The polarization angle rotates by an amount that is proportional to the wavelength of the radio wave, according to the relation
| (1) |
where is the rotation measure derived from observations of linear polarization at multiple wavelengths. For a compact polarized source observed through a foreground screen, is independent of wavelength and equal to the Faraday depth between the source and the observer, defined as
| (2) |
with in , electron density in , magnetic field strength in , and path length in pc. The integral is evaluated along the entire path of the radiation from its source to the observer. Its sign depends on the (mean) direction of the magnetic field projected on the line of sight, positive values indicating that the magnetic field is directed towards the observer.
The distinction between the observed quantity and Faraday depth is not always made explicit. Faraday depth is a quantity that can be different for separate emission regions along the line of sight, or for regions that are not resolved by the beam of the telescope. If there is only a single Faraday depth in the problem, is a direct measure of Faraday Depth. In the general case of more than one Faraday depth, the vector superposition of the polarization of the different regions can only be approximated by Equation 1 as a first-order Taylor expansion over a short wavelength range. In this case it is possible that defined in Equation 1 is a function of wavelength, and different from the Faraday depth for any synchrotron emitting region along the line of sight. Although broad-band observations may reveal this effect, it is a source of error when equating Faraday depth to measured with a modest bandwidth (Farnsworth et al., 2011). Substituting is a good assumption in the case of emission of a compact polarized source with negligible internal Faraday rotation, that travels through a foreground Faraday screen. In this paper, the distinction between and is made mainly to emphasize how this assumption enters the derivation presented in Section 3.2.
Inversion of Equation 2 with to derive the magnetic field from observations is not straightforward. The mean magnetic field along the line of sight may be estimated by dividing by the dispersion measure , defined as
| (3) |
with units . can be measured directly with pulsars. For studies of the global magnetic field of the Milky Way, dispersion measures provide a 3-dimensional model for the electron density (Cordes & Lazio, 2002) that can be used to derive a dispersion measure in the direction of a radio source for which has been measured. For smaller structures in the ISM there is usually not enough information to derive directly. In this case, one can attempt to use emission measure,
| (4) |
as a proxy and use an empirical relation between and derived for pulsars (Berkhuijsen et al., 2006). This approach is restricted to situations where the Faraday rotating plasma is directly observable.
For a turbulent medium, or in situations when is correlated with the magnetic field, this estimate can provide magnetic field estimates that differ significantly from the actual magnetic field strength (Beck et al., 2003). Simulations of a supernova-driven ISM by de Avillez & Breitschwerdt (2005) do not show a strong global correlation between magnetic field strength and density. This does not exclude localized conditions in which the magnetic field strength is correlated with density.
Heiles & Haverkorn (2012) concluded that the Warm Ionized Medium, and possibly the Warm Partially Ionized Medium are responsible for most of the Faraday rotation in the ISM. In this paper, we examine the magnetic field in a nearby structure of ionized intermediate-velocity (IV) gas. Wakker (2004) defines IV gas observationally as gas with a velocity with respect to the Local Standard of Rest (LSR) that is between and outside the velocity range expected for Galactic rotation. In this paper we include in the term IV gas any part of the ISM along the line of sight that moves with a velocity more than with respect to its immediate surroundings.
The association of Faraday rotation with IV gas is significant because it is a kinematically defined component of the ISM that represents a modest fraction of the mass of both neutral and ionized phases of the ISM. Interstellar gas that has recently experienced acceleration, and possibly compression, by the passage of a shock, becomes IV gas until it is decelerated through interaction with its surroundings. Intermediate-velocity gas with this origin may have a higher density and stronger magnetic field, resulting in enhanced Faraday rotation. Whether or not this particular origin applies to the IV gas analyzed here is beyond the scope of this paper.
2. An IV filament in the local ISM
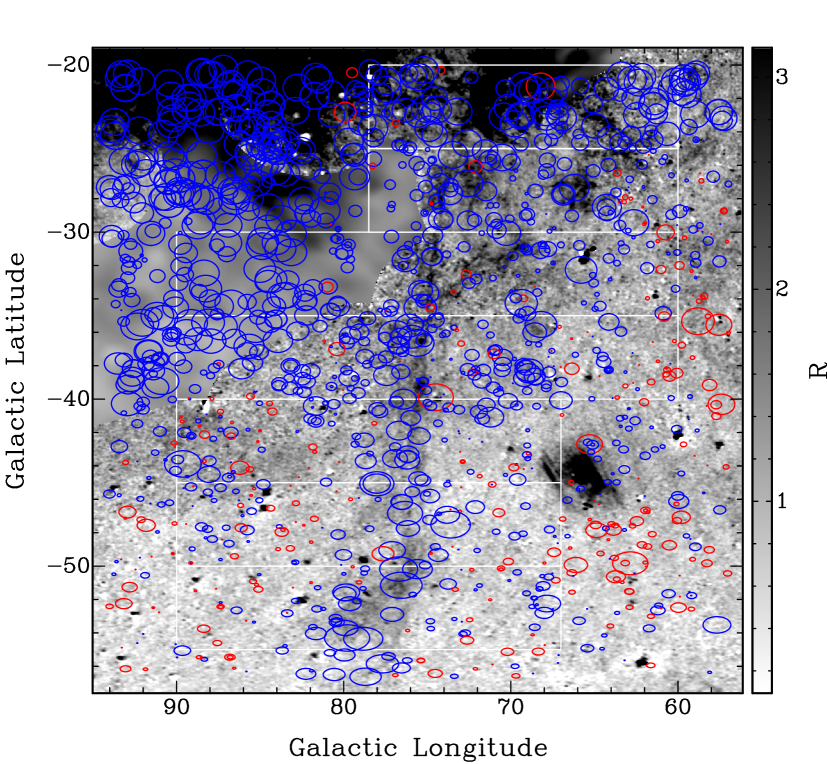
Figure 1 shows an image of H emission at from the WHAM survey (Haffner et al., 2003) in the direction South of the Galactic plane. A long vertical filament that is also visible in the velocity-integrated sky maps of Hill et al. (2008) extends from to (Ade et al., 2015). A detached cloud with the same velocity as the filament is centered at . This cloud was not mentioned by Ade et al. (2015), but it is almost certainly related because it has the same velocity. The region between this cloud and the filament contains faint H emission, intensities R per velocity channel, at near the detection limit of the WHAM survey. The brighter parts of this emission can be seen in Figures 1 and 3 in boxes 2 and 3, with fainter emission extending into the low-longitude side of box 4.
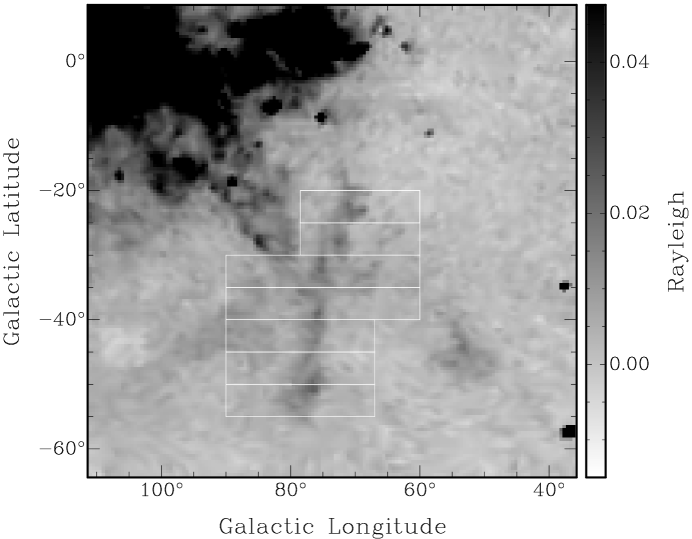
More diffuse emission extends from the filament to higher longitude. This emission has a somewhat lower velocity around and it is more blended with brighter, unrelated, emission centered around the Galactic plane. Bright emission around in Figure 1 is the wing of the bright main disk component with peak brightness per velocity channel, and center velocity between to .
Ade et al. (2015) reported polarized synchrotron emission adjacent to the H emission, but not co-located with it. These authors noted that the free-free opacity of the filament at 1.4 GHz is likely far too small to explain this minimum in synchrotron intensity by absorption. We do not investigate the polarized diffuse synchrotron emission here, but we will address this in a future paper with data from the GALFACTS survey (at 1.2-1.5 GHz Taylor et al., 2010), which will allow a detailed analysis of the diffuse polarized synchrotron emission.
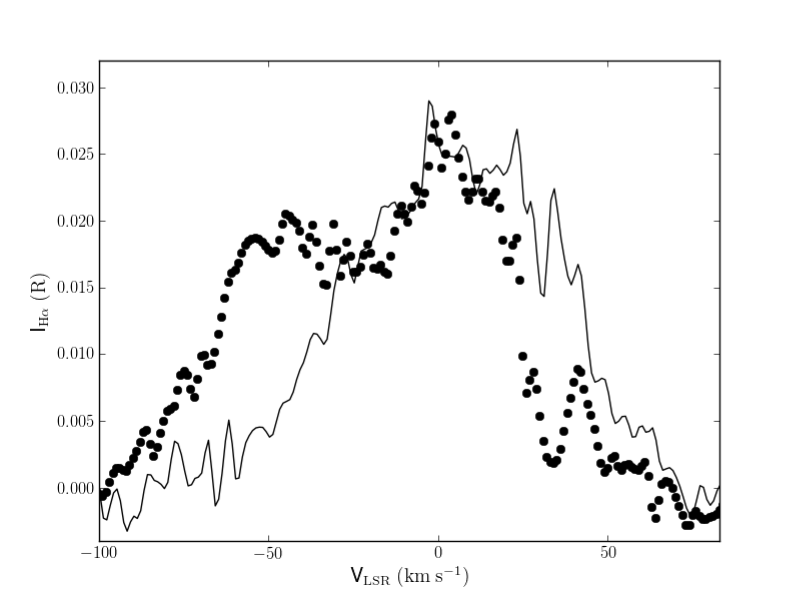
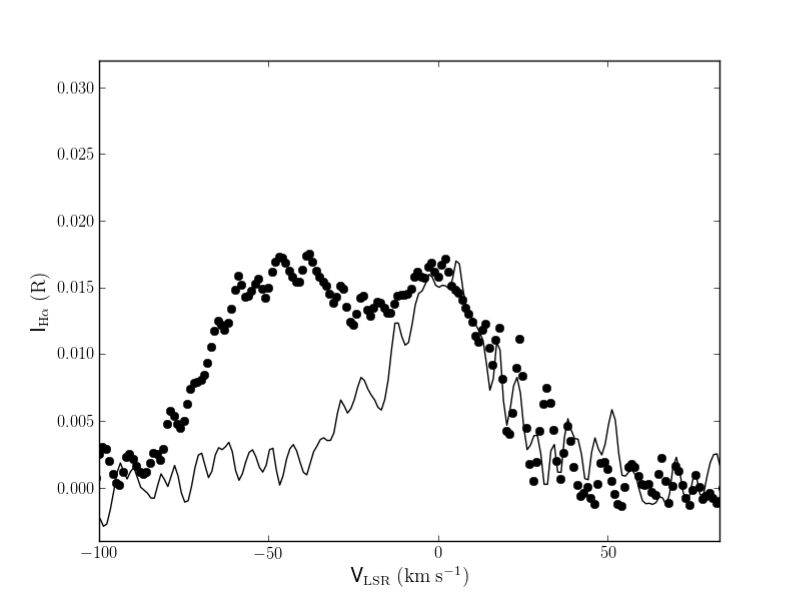
Figure 2 shows two sample spectra at positions coinciding with the filament, as well as spectra at nearby offset positions. The spectra show two major velocity components that are well-resolved at the velocity resolution of the WHAM survey. We estimate that the typical error in the velocity-integrated emission measure of the filament derived from the difference of an “on” spectrum with and “off” spectrum is approximately 10% to 20%. While the profile of the filament has a fairly constant peak brightness around per velocity channel, the brightness of the velocity component centered near decreases rapidly with distance from the Galactic plane. The contrast of the filament with its surroundings is stronger farther from the Galactic equator.
The large extent of the filament in Galactic latitude suggests it is a nearby structure. If the negative velocity is interpreted as Galactic rotation, assuming a flat rotation curve with and , the kinematic distance is 8 kpc. We reject this interpretation because of the lack of related emission at lower latitude. The scale height of kpc for the WIM corresponds with Galactic latitude at a distance of 8 kpc. The extinction maps of Schlegel et al. (1998) indicate a mean colour excess at and at in the longitude range . These reddening values correspond to and respectively. Assuming the brightness of the main disk emission is generally higher closer to the Galactic plane, the lack of detectable emission at these latitudes at cannot be attributed to interstellar extinction, but it is consistent with Galactic rotation.
We suggest the filament is either associated with an extended complex of neutral IV gas detectable in the 21-cm line, the Perseus-Pisces IV arch (Wakker, 2004) that has a similar velocity, or that it is associated with a set of cavities in the local ISM at the periphery of the Local Bubble, detected in extinction measurements of stars in the solar neighborhood by Lallement et al. (2014). The latter implies a distance of 200 to 400 pc. The distance of the Perseus-Pisces IV cloud is not very well constrained. Wakker (2001) lists an upper limit to the distance of 1.1 kpc () based on a single line of sight towards the star HD 215733 at , which is inside the area analyzed in this paper. We adopt the distance range 200 pc to 400 pc in this paper. The angular thickness of (FWHM) corresponds to 10 to 20 pc at a distance of 200 and 400 pc respectively, and the length of corresponds with a projected length of 120 to 240 pc respectively.
If the filament is associated with the Perseus-Pisces IV arch, it is interesting to note that this particular part of the larger IV complex is mostly ionized. There are a few distinct HI clouds with column density of a few in the Leiden-Dwingeloo survey (Hartmann & Burton, 1997) and the GALFA survey (Peek et al., 2011) with the same velocity that coincide with parts of the filament with peak brightness temperature in the range 1 to 2 K. The brightest HI co-located with the filament is found in clouds at and . The elongated morphology and low-surface-brightness emission in the Arecibo data of Peek et al. (2011) suggests this HI is associated with the filament. It will be analyzed in detail along with the GALFACTS data in a future paper.
Apparent filamentary structure can also arise from a 2-dimensional sheet observed on its edge. The presence of other features at the same velocity around the filament suggests that the IV gas as a whole is not located in an edge-on sheet. We consider it more plausible that the IV gas is located in a two-dimensional sheet observed at an intermediate angle with the line of sight. This explains the correlated line-of-sight velocities for different emission across the field. The simplest interpretation is then that the filament is a true filament embedded in this sheet. Instabilities may cause a sheet to bend in a more edge-on orientation locally, but the fact that the line-of-sight velocities of the gas are so uniform in two dimensions remains a problem if this is the case. We therefore favor the interpretation of this structure as a true filament.
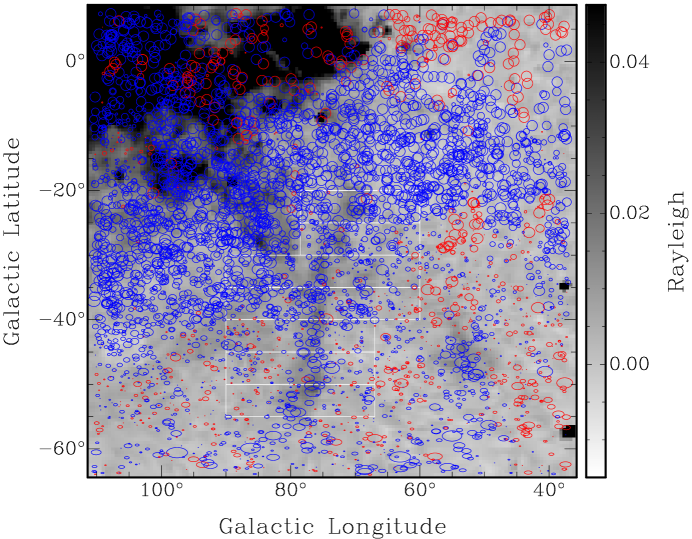
Figure 3 shows the same region as Figure 1, with circles indicating rotation measures from Taylor et al. (2009) with typical errors of . The size of the circles is proportional to for , saturating for higher . The filament stands out because of significant negative compared to its surroundings. Towards the Galactic plane, the contrast between the filament and the background is less, because of a strong gradient of the background in the direction of the Galactic plane.
Some extended low-surface-brightness H emission is visible in Figure 1 and Figure 3 just South of the boundary . This emission appears more blended with the wing of bright emission at normal velocities. Its velocity is approximately , slightly lower than the central velocity of the filament. Its association with the filament is not clear. There is some indication from the rotation measures that the filament extends beyond the detectable H emission, South of , and that it may curve back towards the Galactic plane. Any related H emission in this region is below the surface brightness threshold of the available H surveys. In this region of the survey, we see artifacts in the baseline of the WHAM spectrum that limits the accuracy of emission measures of some structures with a low surface brightness.
Figure 4 shows the same data as Figure 3 over the composite image from Finkbeiner (2003) that includes images from the VTSS survey (Dennison et al., 1998) with the much higher angular resolution of but a lower surface brightness sensitivity. The high-resolution image reveals substructure in the form of straight, thin filaments. However, the enhanced Faraday rotation is associated with the extended H emission with a surface brightness . The bright HII region at is a background object with velocity . The top part of Figure 4 lacks high-resolution VTSS images and is filled with WHAM images at a much lower resolution.
In this paper we investigate the magnetic field in this filament and the detached cloud. The analysis focuses on the WHAM data, because of the higher sensitivity to low-surface-brightness emission, and the ability to use the velocity dimension of the data to improve the background subtraction for the analysis in Section 3.2. The errors in individual rotation measures and background-subtracted emission measures are substantial. The analysis will therefore involve averages over the data in the boxes shown in Figures 1, 3, and 4.
3. Results and Analysis
3.1. Density-weighted mean magnetic field
In order to determine the strength of the magnetic field, we require a dispersion measure. Berkhuijsen et al. (2006) derived a relation between line-of-sight integrated and for 157 pulsars,
| (5) |
where (assuming a plasma temperature of 8000 K) is the emission measure that is derived from the extinction-corrected, velocity-integrated intensity, . In this sub-section we use the same integrated along the line of sight (all WHAM velocities), and the same extinction correction, in order to derive values for in a way that is consistent with the source of Equation 5. Any contribution from foreground or background is subtracted in the subsequent analysis. The values for that we find are in the lower half of the range for the sample of Berkhuijsen et al. (2006). The scatter around their relation suggests significant uncertainty, of the order of a factor 3.
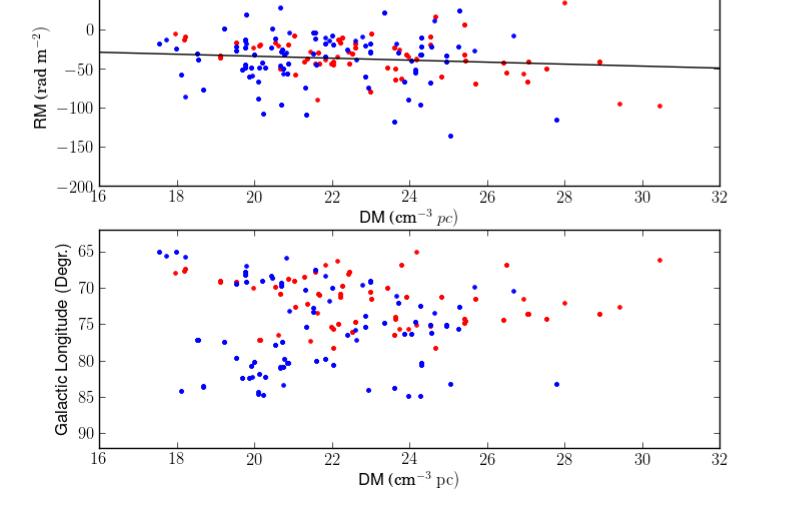
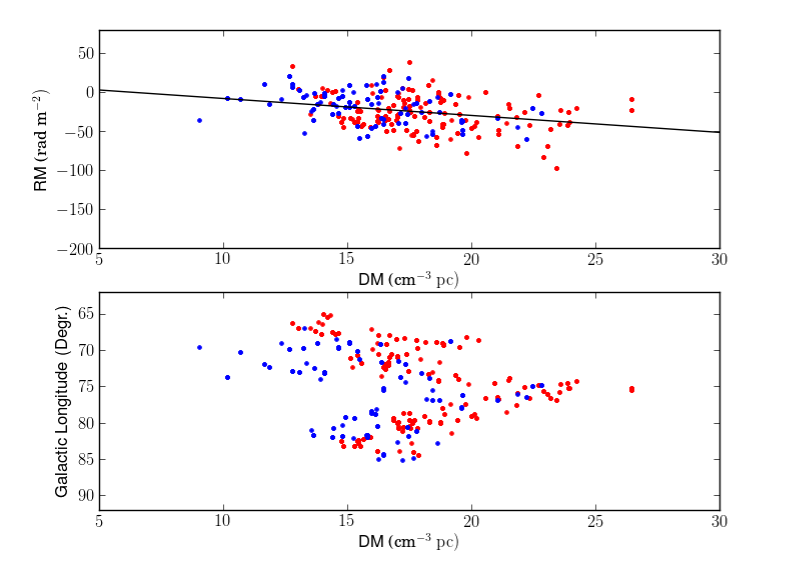
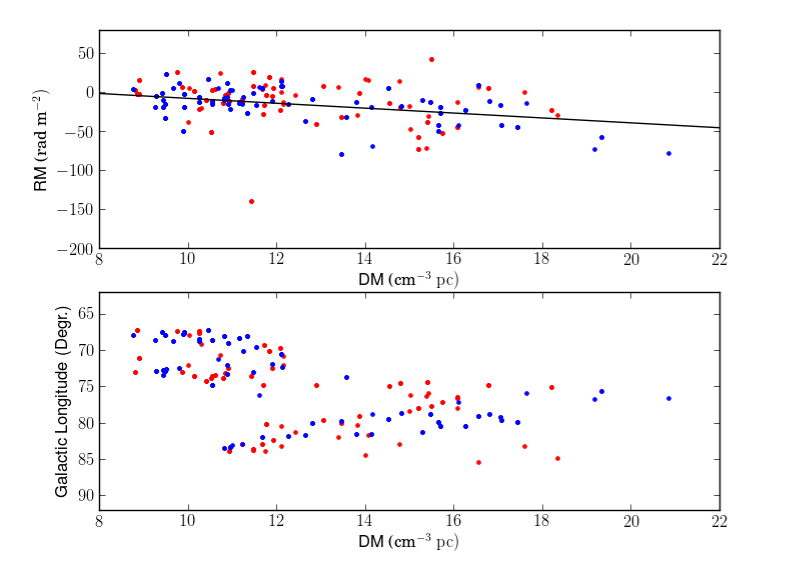
Figure 5 shows examples of the correlation between and , separately for boxes identified in Figure 1. Box 1 was included in our analysis for completeness, but it is not shown in Figure 5 because the contrast between the filament and its surroundings is small in this box. The scatter in the - relation arises from errors in the individual measurements, and from variance in that propagates into . Comparing with the corresponding longitude- diagram, we find that a substantial part of the scatter in the - relation is caused by variance in . If the scatter in the relation of Berkhuijsen et al. (2006) represents true differences between lines of sight, then this scatter propagates in the scale of the axis in this figure, and hence a systematic error in the derived magnetic field strength.
In order to derive the mean line-of-sight component of the magnetic field in the filament, we need to subtract the background and the background . If we fit a linear relation between and , the slope of this relation provides the required ratio of the “on” - “off” quantities. The fits presented here were made to the combined data of two adjacent boxes as shown in Figure 5. The resulting magnetic field strengths are listed in Table 1.
When fitting the relation between and , we leave the intercept as a free parameter and express it as the dispersion measure at , or , tabulated in Table 1. It is possible that is either positive or negative. A negative could indicate that the WHAM images do not include all plasma along the line of sight, e.g. because of disproportionate extinction of more distant gas. A positive can arise if turbulent plasma along the line of sight adds to the emission measure but not to the mean rotation measure. We find predominantly positive , because of positive in the offset positions where the mean nearly vanishes.
The density-weighted mean line-of-sight component of the magnetic field is G, with a standard deviation of G. The standard deviation is less than twice the formal error in the fits. The magnitude of is comparable to the strength of the large-scale Galactic magnetic field. The line of sight is oriented approximately in the direction of the large-scale Galactic magnetic field, assuming a pitch angle . There is no significant trend of with position along the filament. This is peculiar, because the angle with the line of sight changes by over the length of the filament, if it is a straight linear structure. A straight filament with a uniform magnetic field oriented along its axis, should show systematic variation of or , which is not observed. This may indicate that the filament is slightly curved, or that the magnetic field strength is not uniform, or that the magnetic field is not aligned with the axis of the filament.
At this point it is worth noting an interesting combination of observed quantities. First, the projection of the filament’s axis on the sky is nearly perpendicular to the Galactic equator. The filament itself may not be perpendicular to the Galactic plane, but only if its axis makes a significant angle with the line of sight.
Second, the line-of-sight velocity of the filament is approximately constant along the filament. This is remarkable considering the angular size of the filament. There may be a component of the velocity perpendicular to the line of sight, but it seems likely that the velocity vector has a significant component, more than 10 or 20 perpendicular to the axis of the filament, depending on the true angle between the line of sight and the axis of the filament. The time it takes for the filament to travel its own diameter perpendicular to its axis is therefore of the order of a Myr or less, while the time it takes a sound wave to travel along the filament is approximately an order of magnitude longer.
Third, the line-of-sight component of the magnetic field in the filament has the same direction and is similar in magnitude to the large-scale Galactic magnetic field. We do not know whether the mean magnetic field is oriented along the axis of the filament, but the thin, straight, filamentary substructure seen in Figure 4 would be consistent with plasma spreading along magnetic field lines oriented along the axis of the filament. Enhanced polarized synchrotron emission around the filament (Ade et al., 2015) is suggestive of a magnetic field component perpendicular to the line of sight, at least in the periphery of the H filament.
The combination of these three observations raises questions about the dynamical importance of the magnetic field in this filament and its interaction with its surroundings. A self-consistent model of this structure should incorporate the complex magnetic field, as well as the peculiar dynamics and morphology.
In the following section, we use the available data, rotation measure and emission measure, in a different way to place a lower limit to the Alfvén velocity in the filament.
3.2. Density-weighted mean Alfvén velocity
In view of the considerable uncertainty in some of the steps in the analysis in Section 3.1, the question rises whether the available and can be applied to derive a different quantity of interest related to the magnetized plasma. We explore the possibility to constrain the Alfvén velocity in the region of interest, rather than the magnetic field. As motivation for this approach we can restate Equation 2, now using SI units for all quantities, in the mathematically equivalent form
| (6) |
with the mean particle mass per free electron, the mass of a proton, the permeability of vacuum, a length scale that describes the dimension of the object along the line of sight, a dimensionless distance along the line of sight, and the mass density of the plasma in kg m-3. The reason for introducing the dimensionless distance coordinate will become clear later. For compact polarized radio sources behind a Faraday rotating screen we can substitute as before. The derivation in this section applies in this case, but not in a case where the polarized radio emission is generated inside the volume of the Faraday rotating plasma.
The Alfvén speed in the plasma is defined in SI units as
| (7) |
where is the (total) magnetic field strength. Define the density-weighted mean Alfvén speed as
| (8) |
The weighting with electron density is inspired by the integrand of Equation 6. If we use Equation 6 to find an upper bound for by replacing with under the integral, and then a further upper bound by replacing with , then we obtain the inequality
| (9) |
The integral in the denominator is not directly available from observations, but we notice its similarity to Equation 4. Define the dimensionless ratio
| (10) |
where is the length scale defined above and is the filling factor of plasma along the line of sight. The denominator of is proportional to . Use Equation 10 to eliminate the integral of from Equation 9. The trade-off to eliminate the unknown integral of with the measurable integral of is therefore the introduction of a mild dependence on the line-of-sight depth of the object, and the dimensionless factor of order unity that can be evaluated for any assumed density structure. Propose a density distribution along the line of sight of the form
| (11) |
where is a normalizing constant, and F(x) is a dimensionless profile function. The numeric value of can be evaluated for any proposed density profile. For a uniform density we find , and for a Gaussian density profile we have , if is the FWHM diameter of the density distribution. The difference between a constant density and Gaussian density distribution introduces uncertainty of in . Expressed in practical units, we find a lower limit for the density-weighted mean Alfvén velocity
| (12) |
The quantities and are directly observed. For the other factors, some assumptions need to be made. We discuss each factor in Equation 12 in sequence for the filament, to illustrate the conditions under which Equation 12 may provide an interesting lower limit. The small exponents of some of these factors mitigate the impact of the assumptions on the result.
The mean molecular weight per free electron, , depends on ionization fraction and chemical abundance of the plasma. Assuming hydrogen is 90% ionized (the lower limit for the WIM quoted by Haffner et al., 2009), and the plasma has approximately solar abundances, we apply . If hydrogen is fully ionized, , so the uncertainty in the ionization fraction is insignificant compared to other factors in the lower limit to .
The filling factor of the plasma enters Equation 12 in conjunction with the line-of-sight depth through the introduction of the factor . The global mean filling factor (Haffner et al., 2009) for the WIM is an average over distances of a few kpc. It is consistent with this global mean filling factor of the WIM to assume a higher filling factor, as high as , for the filament. A filling factor assumes that part of the volume of the filament is occupied by predominantly neutral gas. Although some faint -cm line emission is observed, we adopt here. A significantly lower value for could raise the lower limit to .
Some constraint on the filling factor comes from the lack of variance of added by the filament. The effective beam size for the measurements is the true angular size of the radio sources (). If the filling factor of the plasma is very small, the measurements would hit or miss regions with plasma, thus increasing the dispersion of . Instead, we find that is correlated with H intensity averaged over the beam of the WHAM survey, and that the enhancement of coincides with the diffuse emission in Figure 4. These observations are consistent with a high filling factor of the plasma in the filament.
The value of is not a major source of uncertainty compared with other factors in Equation 12. Its value can be constrained in the future with sensitive high-resolution H images. Figure 4 does not show a clear central increase of the surface brightness. For the present, we adopt .
Finally, the value of requires an assumption about the 3-dimensional shape of the object. As explained before, we favor the geometry of a filament. The FWHM cross section in the H image is , which corresponds to a diameter . If the axis of the filament makes an angle with the line of sight, the path length through the filament is . The median value for a random distribution is . Assuming the nominal distance , we find with an uncertainty of % because of the uncertainty in the distance that translates into an uncertainty of order 20% in the limit to . If we assume that the line of sight is more perpendicular to the axis of the filament, or if we assume a smaller distance, the lower limit to will be higher than stated.
Lower limits to are listed in Table 1. Box 4 was excluded from this analysis because of the patchy structure in this box. In this case we applied no extinction correction to the H emission, because here refers only to the nearby filament that should experience very little extinction. These lower limits to may be compared with the sound speed in a gas with mean molecular weight and temperature ,
| (13) |
The lower limits to therefore suggest that the Alfvén velocity is similar to or larger than the sound speed in the filament. The same is often expressed in terms of the plasma , the ratio of the thermal pressure to the magnetic pressure ,
| (14) |
The lower limit to from Equation 12 implies in the filament, and even in the boxes farthest from the Galactic plane, where the contrast in between the filament and its surroundings is higher. Values indicate that magnetic pressure dominates over gas pressure. The magnetic field will then restrict motion of the plasma perpendicular to the field lines. This favors the formation of filamentary structure aligned with the magnetic field, as seen in Figure 4.
4. Discussion
4.1. A lower limit to the Alfvén speed
The previous sections derived the density-weighted mean line-of-sight component of the magnetic field, and a lower limit to the density-weighted mean Alfvén speed in an ionized filament of IV gas in the local ISM. We propose the latter as an alternative quantity that can be derived from the available data instead of the mean magnetic field strength. If one used the mean magnetic field strength derived in Section 3.1 to derive a lower limit to the Alfvén velocity, deriving the density indirectly from and an assumption about , one would find
| (15) |
Substituting values from Table 1 and the preceding section leads to a lower limit . Equation 15 also refers to a density-weighted mean Alfvén velocity, but with a different density weighting Equation 9. Equation 15 is also more sensitive to assumptions about the line-of-sight depth and in particular the conversion from emission measure to dispersion measure. An implicit assumption in Equation 15 is that the relation of Berkhuijsen et al. (2006) applies equally to the filament as it does to the kpc scale lines of sight for which it was derived. This may be questionable when the object of interest is an individual WIM cloud, with its specific physical conditions. Another potential source of error is that the mean extinction correction applied for the complete line of sight is too large for the nearby filament.
If magnetic field strength is correlated with density, systematic errors in the value of can occur (Beck et al., 2003). The averaged quantity will be less correlated with density than itself if and are positively correlated. Equation 12 is also less sensitive to the filling factor of the Faraday rotating plasma than Equation 15.
Equation 12 assumes a constant filling factor and ionization fraction along the line of sight. The assumption of a constant ionization fraction is made when is pulled out of the integral in Equation 6. This means that Equation 12 should not be applied in situations where the ionized fraction varies significantly, for example over long line of sight distances through the ISM, or in other situations where different phases of the ISM are suspected to contribute to the total Faraday rotation. The present analysis focuses on a small-scale structure in the WIM, for which it is easier to justify a large filling factor of ionized gas and a constant ionization fraction. In applications where the filling factor or the ionization fraction is small, the lower limit derived from Equation 12 will be more uncertain accordingly.
With the preceding caveats in mind, we briefly consider other applications of Equation 9. Regions A and C in Simard-Normandin & Kronberg (1980) are extended structures identified in all-sky maps of Faraday rotation that are not associated with observable emission in excess of the smooth background emission. They appear at Galactic latitude as extended regions with a well-defined mean and emission measure . Without more information, we treat these regions as completely ionized. Equation 12 then results in a lower limit of for line-of-sight depths in the range 1 to 5 kpc. This limit is considerably weaker than the limits derived in Table 1. The main reason for this is not the long line of sight, but the ratio , which is much higher for the filament after subtraction of the background. We can therefore expect the limit to the Alfvén speed to be most useful for small-scale structures in the local WIM at high latitude, that can be identified with structure despite its small emission measure. Future surveys of Faraday rotation will increase the density of measurements. When combined with high-resolution, high-sensitivity H imaging, these surveys can provide more insight in the dynamical importance of magnetic fields in the ISM on scales of tens of pc.
A completely different application of Equation 12 is Faraday rotation of background sources by galaxy clusters. In this case, is derived from X-ray observations of thermal bremsstrahlung of the intra-cluster gas. We illustrate this with a numeric example. For in the range of 100 to 200 and impact parameter 0.5 Mpc from the cluster center (Clarke et al., 2001), electron density (Croston et al., 2008), , we expect and to lead to lower limits . These lower limits are well below the sound speed in a K plasma. However, if the observed is the sum of turbulent cells with a scale of 10 kpc, (the value adopted by Clarke et al., 2001), then the number of cells along the line of sight would be of order 100. The typical per cell would be approximately , for an of per cell (assuming again ). Applying Equation 12 to a single turbulent cell () would lead to , which is not much below the sound speed in a plasma with temperature several K. These numbers serve to illustrate that the limit to the density-weighted mean Alfvén velocity introduced here has the potential to be a used to constrain equipartition magnetic field strength in clusters of galaxies, although this estimate will depend somewhat on the assumed turbulent cell size.
4.2. Faraday rotation by IV gas
The results presented here suggest that IV gas may be a significant locus for Faraday rotation in the ISM. Heiles & Haverkorn (2012) reviewed possible contributions to Faraday rotation by different phases of the ISM, but these authors did not discuss IV gas, which is kinematically different but not related to one specific phase of the ISM. Considering that other large-scale structures at high latitude are associated with the IV Arch and the wall of the Orion-Eridanus superbubble (Stil et al., 2011), a possible correlation between structure and IV gas should be considered. The importance of magnetic fields in the dynamics of this gas and the way it interacts with its surroundings, is of interest for dynamo theories applied to disks of spiral galaxies (e.g. Parker, 1971). Association of Faraday rotation with such a specific part of the ISM would also be significant for models of the propagation of diffuse polarized synchrotron emission in galaxies (e.g. Sokoloff et al., 1998).
IV gas is readily identified when its line-of-sight velocity is outside the range predicted by Galactic rotation. Even at high Galactic latitude, it is not practical to get a complete sample of IV gas, if only because of the necessary projection of the velocity along the line of sight. A general correlation between IV gas along the line of sight and is therefore not easily established experimentally.
We may ask whether it is plausible that a significant part of structure on small angular scales can be produced by structures similar to the filament discussed here. Over larger distances, such structures would contribute to the standard deviation of of extragalactic sources. From the structure function images of Stil et al. (2011) we find that the variance of on angular scales of at latitude is approximately twice the variance on angular scales of at latitude . Expressed in terms of the standard deviation of this represents an increase from at to at . The diffuse H intensity increases from 0.5 - 1 R at to 3 - 5 R at , while the line of sight through the Galaxy triples. Assuming a scale height of 1 to 1.5 kpc for the WIM, the typical line-of-sight distance would increase from 1.3 to 2 kpc at to 4 to 6 kpc at . The angular scale of at a distance of 4 to 6 kpc corresponds with a size of 70 to 100 pc.
The implied and size scale agree well with the estimated size of the filament discussed here. This also appears consistent with the conclusion of Stil et al. (2011) that the variance of on angular scales of 10 degrees must originate in the local ISM, while the variance on angular scales of 1 degree arises on lines of sight that are so long that they reveal the eccentric position of the Solar system in the Milky Way.
The above is suggestive but not conclusive evidence that a substantial fraction of variance in the disk-halo interface could be explained if the typical line of sight at latitude intersects IV structures with size and Faraday depth similar to the filament discussed here. Denser sampling of from future polarization surveys, in particular POSSUM with the Australian Square Kilometre array (SKA) Pathfinder (ASKAP) and a dense RM grid from a future SKA survey will allow detailed investigation of more distant structures, and correlation with Galactic longitude and latitude in relation to tracers of star formation in the Milky Way.
5. Summary
The mean line-of-sight component of the magnetic field in a nearby ionized IV filament is found to be . In a nearby associated cloud the mean line-of-sight component of the magnetic field is . There magnetic fields were derived by estimating dispersion measure from the observed emission measure .
In view of the uncertainty in the conversion of to , we propose an alternative use of the available data to derive a lower limit to the Alfvén velocity in the plasma, weighted by density . The resulting lower limits are in the range to , indicating a low plasma .
Applications and limitations of this new lower limit to the Alfvén velocity are discussed. The derived limit provides the strongest constraints for small-scale structures in the local ISM that are completely ionized. It may also be applied to the turbulent gas in galaxy clusters to constrain equipartition magnetic field strengths.
Acknowledgments
This research has been made possible by a Discovery Grant from the Natural Sciences and Engineering council of Canada to Jeroen Stil. The National Radio Astronomy Observatory is a facility of the National Science Foundation operated under cooperative agreement by Associated Universities, Inc. The Virginia Tech Spectral-Line Survey (VTSS), the Southern H-Alpha Sky Survey Atlas (SHASSA), and the Wisconsin H-Alpha Mapper (WHAM) are supported by the National Science Foundation.
References
- Ade et al. (2014) Ade, P. A. R. Aghanim, N, & the Planck Collaboration 2014, arXiv:1411.2271
- Ade et al. (2015) Ade, P. A. R. Aghanim, N, & the Planck Collaboration 2015, arXiv:1506.06660v1
- Beck et al. (2003) Beck, R., Shukurov, A., Sokoloff, D. & Wielebinski, R. 2003, A&A, 411, 99
- Berkhuijsen et al. (2006) Berkhuijsen, E. M., Mitra, D., & Müller, P. 2006, Astronomische Nachrichten, 327, 82
- Clark et al. (2014) Clark, S. E., Peek, J. E. G., Putman, M. E. 2014, ApJ, 789,
- Clarke et al. (2001) Clarke, T. E., Kronberg, P. P., & Böhringer, H. 2001, ApJ, 547, L111
- Cordes & Lazio (2002) Cordes, J. M., & Lazio, T. J. 2002, astro-ph/0207156
- Croston et al. (2008) Croston, J. H., Pratt, G. W., Böhringer H., et al. 2008, A&A, 431, 443
- Crutcher (2012) Crutcher, R. M. 2012, ARA&A, 50, 29
- Dennison et al. (1998) Dennison, B., Simonetti, J. H., & Topasna, G. A. 1998, PASA, 15, 147
- de Avillez & Breitschwerdt (2005) de Avillez, M. A., & Breitschwerdt, D. 2005, A&A, 436, 585
- Farnsworth et al. (2011) Farnsworth, D., Rudnick, L. & Brown, S. 2011, AJ, 141, 191
- Ferrière et al. (1991) Ferrière, K. M., Mac Low, M.-M., Zweibel, E. G. 1991, ApJ, 375, 239
- Finkbeiner (2003) Finkbeiner, D. 2003, ApJS, 146, 407
- Haffner et al. (2003) Haffner, L. M., Reynolds, R. J., Tufte, S. L., Madsen, G. J., Jaehnig, K. P., & Percival, J. W. 2003, ApJS, 149, 40
- Haffner et al. (2009) Haffner, L. M., Dettmar, R.-J., Beckman, J. E., et al. 2009, Rev. Mod. Phys., 81, 969
- Hartmann & Burton (1997) Hartmann, D., Burton, W. B. 1997, Atlas of Galactic Neutral Hydrogen, Cambridge, UK: Cambridge University Press
- Haverkorn (2015) Haverkorn, M. 2015, in Magnetic Fields in Diffuse Media, ASSL Vol. 407, Berlin: Springer-Verlag, 483
- Heiles & Haverkorn (2012) Heiles, C., & Haverkorn, M. 2012, Space Sci. Rev., 166, 293
- Hill et al. (2008) Hill, A. S., Benjamin, R. A., Kowal, G. et al. 2008, ApJ, 686, 363
- Kulsrud (1999) Kulsrud, R. M. 1999, ARA&A, 37, 37
- Lallement et al. (2014) Lallement, R., Vergely, J.-L., Valette, B., et al. 2014, A&A, 561, A91
- McClure-Griffiths et al. (2006) McClure-Griffiths, N. M., Dickey, J. M., Gaensler, B. M., et al. 2006, ApJ, 652, 1339
- McKee & Ostriker (1977) McKee, C.F., & Ostriker, J.P. 1977, ApJ, 218, 148
- Parker (1971) Parker, E. N. 1971, ApJ, 163, 255
- Peek et al. (2011) Peek, J. E. G., Heiles, C., Douglas, K. A. et al. 2011, ApJS, 194, 20
- Schlegel et al. (1998) Schlegel, D. J., Finkbeiner, D. P., & Davis, M. 1998, ApJ, 500, 525
- Shajn (1958) Shajn, G. A. 1958, IAU Symp, 6, 182
- Simard-Normandin & Kronberg (1980) Simard-Normandin, M., & Kronberg, P. P. 1980, ApJ, 242, 74
- Sokoloff et al. (1998) Sokoloff, D. D., Bykov, A. A., Shukurov, A., Berkhuijsen, E. M., Beck, R., & Poezd, A. D. 1998, MNRAS, 299, 189
- Stil et al. (2009) Stil, J. M., Wityk, N. D., Ouyed, R. & Taylor, A. R. 2009, A&A, 701, 330
- Stil et al. (2011) Stil, J. M., Taylor, A. R., & Sunstrum, C. 2011, ApJ, 726, 4
- Taylor et al. (2009) Taylor, A. R., Stil, J. M., & Sunstrum, C. 2009, ApJ, 702, 1230
- Taylor et al. (2010) Taylor, A. R., & Salter C. J. 2010, ASP Conf. 438, in The Dynamic Interstellar Medium: A Celebration of the Canadian Galactic Plane Survey, ed. R. Kothes, T. Landecker and A. G. Willis, San Francisco: ASP, 402
- Tomisaka (1998) Tomisaka, K. 1998, MNRAS, 298, 797
- Van Marle et al (2015) Van Marle, A. J., Meliani, Z., Marcowith, A. 2015, A&A, 584, 49
- Wakker (2001) Wakker, B. P. 2001, ApJS, 136, 463
- Wakker (2004) Wakker, B. P. 2004, in High Velocity Clouds, Ed. H. G. Van Woerden, B. P. Wakker, & K. De Boer, 2004, Kluwer:Dordrecht, 36