Top-quark physics at the Large Hadron Collider
Abstract
This experimental review gives an overview of top-quark measurements performed by the two general purpose-detectors ATLAS and CMS during the first few years of running of the Large Hadron Collider. In the years each experiment collected of collision data at and at , allowing detailed studies of top-quark production and decays, and measurements of the properties of the top quark with unprecedented precision.
type:
Topical Reviewpacs:
13.85.-t, 13.90.+i, 14.65.HaAccepted for publication by: J. Phys. G: Nucl. Part. Phys.
1 Introduction
The top quark is the heaviest known elementary particle, and with its unique properties has long been suspected of potentially carrying key information that may lead to the solution of some of the paramount open questions in particle physics.
After the first observation of top quarks [1, 2] by the CDF and D0 collaborations at the Tevatron proton–antiproton collider at Fermilab in 1995, its properties were studied with up to of data at centre-of-mass energies of and . A comprehensive set of measurements confirmed that the new particle behaved according to the Standard Model (SM) predictions for the top quark, albeit with a precision that in most cases was limited by the available sample sizes and important backgrounds from +jets and multijet events.
With the start of the Large Hadron Collider (LHC) [3] at CERN in 2009, much larger samples of top-quark events have become available, produced in proton–proton collisions at centre-of-mass energies of and during the years 2009 to 2012, referred to as the LHC Run-1. This has allowed measurements of top pair and single-top production in much more detail than before, and studies of top-quark properties with unprecedented precision. The increased luminosity and higher have also opened up the possibility to observe much rarer processes such as associated production of top quarks and vector bosons.
However, the enigmatic top quark remains as puzzling as ever. The discovery of a Higgs boson during the LHC Run-1 [4, 5] completed the Standard Model, but did not answer pressing questions related to the top quark. Why is the top quark so much heavier than the other fermions? It is times heavier than the bottom quark, at a mass scale similar to the , and Higgs bosons. Does the top quark play a special role in the mechanism of electroweak symmetry breaking? Why is the mass of the Higgs boson so much lighter than the GUT scale, without a symmetry that can protect the Higgs potential against destabilizing radiative corrections, mostly due to top quarks? A new question emerged with the discovery of the Higgs boson: why do the Higgs-boson mass and the top-quark mass have exactly the values they have, in a small window allowing the electroweak potential of the Standard Model to be stable up to high energy scales and predicting a meta-stable state for the Universe? For more details we refer to several excellent recent reviews about the phenomenology of top quarks [6, 7].
The Standard Model does not give answers to any of these questions. But since the top quark as main destabilizer of the Higgs potential and main offender in the unexplained mass hierarchy plays a central role in this puzzle, it may well be that indications of possible answers in the form of new physics phenomena can be found in the top-quark sector. Thus, it is essential to study top-quark production, decays, couplings and other properties in detail with the best possible precision.
Other recent experimental reviews exist that include or focus specifically on legacy results of the Tevatron experiments [8, 9, 10], or cover a specific area of top-quark physics at the LHC [11, 12, 13, 14, 15]. Earlier general reviews of experimental LHC top-quark results include Refs. [16, 17, 18, 19].
In this experimental review we summarize top physics measurements performed by the LHC experiments (ATLAS [20], CMS [21] and LHCb [22]) during Run-1, including all results submitted to journals before June 2016. At this point more than one hundred LHC Run-1 top physics measurements have been published. A few analyses are still in progress, including for example some of the measurements of the top-quark mass at , expected to be completed soon.
2 Top-quark pair production
2.1 Inclusive cross-sections
The measurement of the inclusive production cross-section of a top quark–antiquark pair () is an important test of the theory of quantum chromodynamics (QCD). Calculations of the cross-section are performed at next-to-next-to-leading order (NNLO) including the resummation of soft gluon terms (NNLL) [23, 24, 25, 26, 27, 28], the main uncertainties stemming from scales, parton distribution functions (PDFs) and the strong coupling constant .
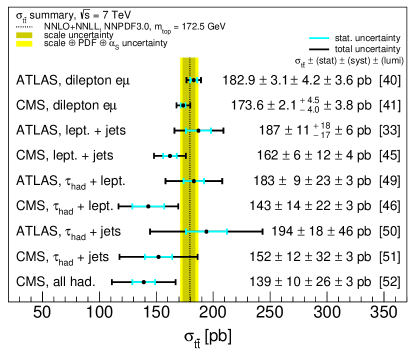
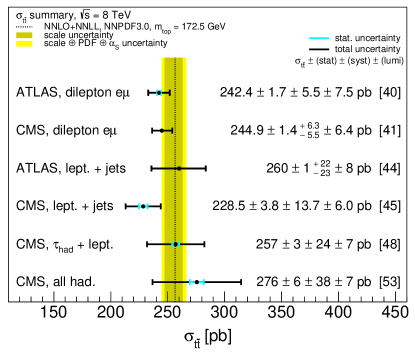
Top quarks decay almost exclusively via the flavour-changing charged current decay . Several final states are available for the measurement of , depending on the decay of each of the bosons from the top quarks. It is customary to distinguish three boson decay categories: (jets), (leptonic), where stands for electrons and muons, including those from the leptonic decays of tau leptons, and (tau), where indicates a hadronically decaying tau lepton. Thus the events are classified as dilepton, single-lepton, all-hadronic and categories with tau leptons. In general these are complementary as they are affected by different systematic uncertainties and possible inconsistencies between the cross-sections would point to new physics contributions. The most precise measurements of the inclusive cross-section in each channel by each of the general-purpose LHC experiments are shown in Figure 1.
First measurements of production were reported with of data at by CMS [29] and ATLAS [30] and established basic event reconstruction and selection criteria, as well as data-driven background estimation techniques for the +jets and +jets processes and the contribution of events with at least one fake (i.e. non-prompt or misidentified) lepton. The latter originate from events where at least one lepton is not produced from a or boson decay from the hard process, but in secondary processes such as semileptonic hadron decays, photon conversions, or misidentified jets. Both the single-lepton and dilepton channels were used for these first measurements, the former being the more precise one. With the complete 2010 dataset () the inclusive cross-section was then determined with better precision in the dilepton [31, 32] and single-lepton channels [33, 34, 35]. Taking advantage of the larger sample size the cross-section extraction techniques were refined, including the use of kinematic likelihood discriminants and the information of jets identified as coming from -flavoured hadrons (-tagging). These measurements were further improved using (ATLAS [36]) and of collisions (CMS [37, 38]), respectively. With a partial dataset of CMS [39] extracted the inclusive cross-section at employing all three dilepton channels.
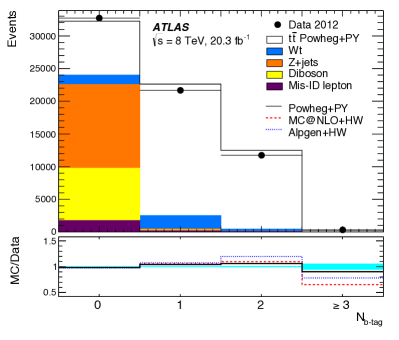
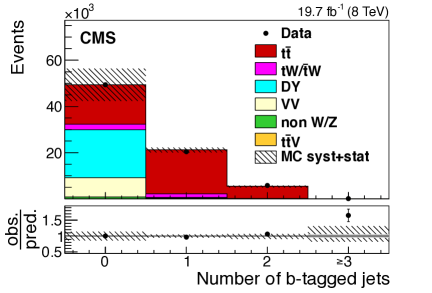
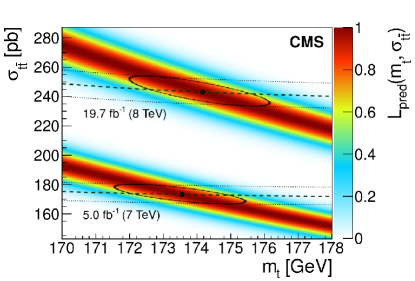
With more data the dilepton channel, and in particular the final state, being essentially background free, allowed for the most precise measurements. In order to reduce the systematic uncertainty, ATLAS extracted simultaneously the cross-section and the efficiency to reconstruct and tag -jets [40] from the number of opposite charge events with exactly one and exactly two -tagged jets (Figure 2, left). Backgrounds with fake leptons were estimated from the measured number of events with two same-sign leptons and from simulation, while the process was estimated from comparing in data and simulation. In a reanalysis of the Run-1 dataset, CMS [41] also analysed the channel but with a slightly different approach. In this case events with any number of -jets were retained in the selection (Figure 2, right), and a template fit to multi-differential binned distributions related to the number of -jets and the transverse momentum () and multiplicity of other jets was performed to extract the number of signal and background events. Both ATLAS and CMS obtain the most precise inclusive cross-section measurements in the channel by using this method on the complete and datasets, reaching a relative precision of , similar to the uncertainty of the most accurate theoretical predictions. Measurements of the cross-section in the dilepton channel have also been used to extract the top-quark pole mass (see Section 4), to determine [42], and to search for pairs of supersymmetric top squarks with masses close to the top-quark mass. Furthermore, the ATLAS dilepton sample was used for a more comprehensive test of the Standard Model by measuring simultaneously the production of , and [43]. Measurements at are available in the single-lepton channel as well, albeit with larger uncertainties [44, 45].
The inclusive cross-section has also been measured by the two experiments in events with one identified hadronically decaying tau lepton, both in the channels + [46, 47, 48, 49] and +jets [50, 51]. Beyond verifying the consistency of the cross-section measurements in different channels, the particular interest here also comes from the fact that hypothetical charged Higgs bosons could be produced in top-quark decays, further decay through , and thus modify the apparent branching fractions. Top-quark branching ratios were determined explicitly in Ref. [49] and found to be in good agreement with SM predictions, with a precision of % depending on the decay channel.
In the all-hadronic channel there are no high- neutrinos that escape detection and there is a larger yield of events compared to the other channels. However, since there are at least six jets expected, an overwhelming background of multijet production and the many possible jet combinations make the reconstruction challenging. By employing kinematic fits or neural-network-based selections CMS measured the inclusive cross-section in the all-hadronic channel at [52] and [53].
With the precision measurements of the cross-section at both centre-of-mass energies of Run-1, the ratio of cross-section at 8 and is a powerful test of perturbative QCD, as the systematic uncertainties partially cancel, while this ratio can be predicted with uncertainties below 1%, dominated by PDF uncertainties. The experimental determinations have uncertainties of about 5%, with better precision in the channel [40, 41] than in the single-lepton channel [45].
2.2 Production of with additional jets
At LHC Run-1 energies about half of the events are expected to be produced in association with one or more extra jets with . As these jets are due to initial and final state QCD radiation, the measurement of +jets events allows higher-order QCD calculations to be tested. Such calculations are available for up to two extra jets at NLO [54, 55].
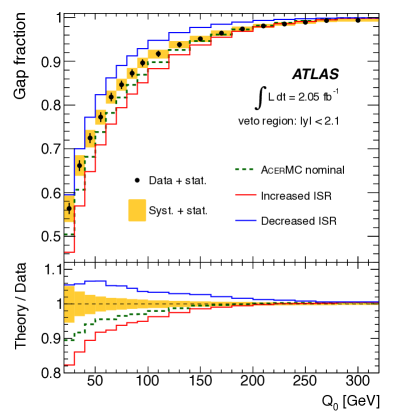
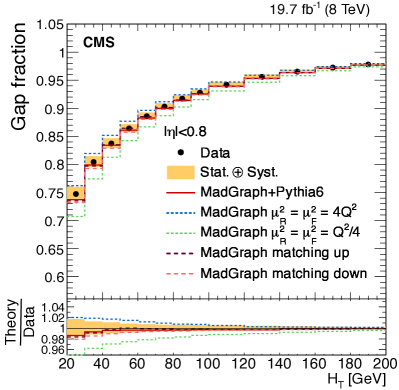
The jet activity in events can be probed by studying the gap fraction variable [56, 57, 58] in dilepton events. Events with a dilepton topology with exactly two -tagged jets are selected, and the fractions of such events that do not contain an additional jet within a given central rapidity region, above a certain threshold (), or for which the scalar sum of the of all additional jets is not larger than a certain threshold , are extracted. The data were fully corrected for detector effects and presented in a fiducial region at particle level, defined using the same event selection criteria applied to the reconstructed data, to avoid extrapolation to regions that are not experimentally accessible. The gap fraction as a function of the threshold is compared with different simulation settings and can help to constrain their allowed variations, as for instance the amount of initial state radiation, QCD scales or parton-shower matching parameters (Figure 3).
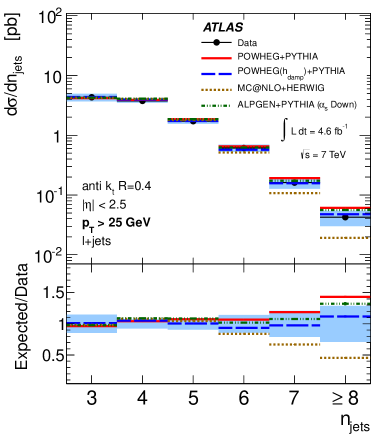
Measurements of the number of reconstructed extra jets in events have been performed both in the dilepton and single-lepton channel and compared to expectation [57, 62]. They provide important tests of higher-order QCD effects, and serve as inputs for the validation and development of generators and NLO QCD calculations of +jets matched to parton-shower algorithms. In order to compare with predictions from different generators, parton-shower models and parameter settings, the spectra were extracted at particle level, by correcting the data for detector efficiency and resolution effects. By defining the fiducial volume as close as possible to the reconstructed objects these corrections are kept small, reducing the associated uncertainties. As a result of these studies ATLAS and CMS disfavour the MC@NLO [63]+Herwig [64] model with the tuning that was used, as it predicts too few events with many high- jets, while the allowed parameter space for Alpgen [65], Powheg [66] and MadGraph in combination with Pythia or Herwig can be constrained (Figure 4, left).
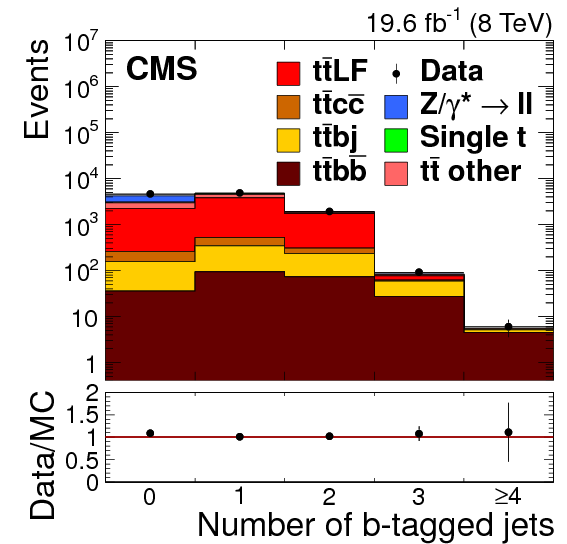
The production of additional quarks in events has also been studied. The final state is an irreducible non-resonant background to the process and is difficult to model in simulation because of ambiguities in matching matrix-element calculations to the parton shower. From a fit to the vertex mass distribution of the extra -tagged jets beyond the two associated to the process in dilepton events, evidence of production of in association with - or -jets has been reported by ATLAS at [68]. With the dataset CMS measured the total cross-section and the quantity in the dilepton channel [67] in the full phase space at parton level, in order to compare with theoretical calculations. Events with two well-identified -jets and at least two additional jets were required. The -tagging algorithm discriminator of the third and fourth jet were used to separate events from the background, including , with a template fit (Figure 4, right).
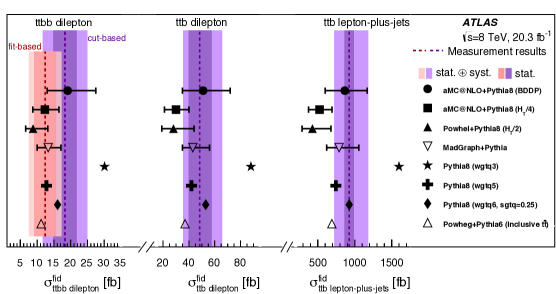
ATLAS performed four measurements of heavy-flavour production in top-quark pair events [69] in a fiducial volume at : a fit-based and a cut-based measurement of in the dilepton channel, and cut-based measurements of in the dilepton and single-lepton channels. The fit-based analysis used very tight selection criteria, including the requirement of four -tagged jets, relied on simulation for the background determination and featured a high signal-to-background ratio. A looser selection was applied in the second analysis where the signal was extracted from a fit to the multivariate -jet identification discriminant. The ratio was determined at particle level to be with comparable systematic and statistical uncertainties. More events are produced in the single-lepton channel; however this channel is affected by additional backgrounds, where a boson can produce a quark, resulting in a similar sensitivity to the dilepton channel. The measurements were also presented after subtracting the expected contributions from electroweak processes (, and ) in order to allow for comparison with NLO QCD predictions. Measurements were compared to predictions using different splitting rates in the parton shower: one of the two most extreme Pythia 8 [70] models is disfavoured by the measurements (Figure 5, left). Measurements were also compared to different LO multileg and NLO generators, showing that the production of extra heavy-flavoured jets is underestimated by up to a factor of two.
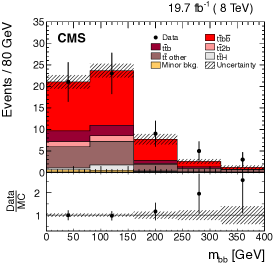
Differential cross-sections in the fiducial phase space of the system and the additional -jets as a function of the and of the leading and subleading additional -jets, the angular distance between them and the invariant mass of these two -jets have been measured at in the dilepton channel by CMS [58]. The overall relative normalization of processes with a and at least one -jet in the final state with respect to expectations from simulation (MadGraph+Pythia) was determined to be using a template fit, identifying the -jets not associated to the decay with a boosted decision tree. The distributions considered were well modelled by simulation (Figure 5, right).
Within the Standard Model, production is very small, with a cross-section of [71, 72, 73] at Run-1 energies, but could be significantly enhanced in extended models. By selecting events with pairs of leptons with the same electric charge using data CMS and ATLAS placed upper limits on the Standard Model production cross-section at the 95% confidence level of [74] and [75], respectively. In the single-lepton channel the very rare signal is difficult to discern from the overwhelming production and therefore multivariate techniques have been employed. Using the full dataset CMS and ATLAS obtained stronger limits of [76] and [77], respectively.
Associated production of with heavy bosons (, and ) is starting to be within reach of the LHC experiments and this is of particular interest as it allows to probe directly the couplings of the top quark to the and Higgs bosons. These studies are discussed in more detail in Section 7.
2.3 Differential cross-sections
With the large top-quark samples available at the LHC after Run-1, it is possible to study differential distributions in detail. On one hand this allows for more thorough tests of perturbative QCD, to constrain the parameters of the Monte-Carlo simulation programs and the proton PDFs, on the other hand it allows for a better understanding of a major background in Higgs boson physics, rare processes and searches for beyond-the-SM (BSM) effects. The strategy for differential measurements is to start with a tight event selection to obtain a high purity sample, often enhanced with dedicated event reconstruction techniques. After the estimated background is subtracted, the effects of detector acceptance and resolution are accounted for by means of unfolding. Distributions of various kinematic quantities of the top quark are then presented at parton or particle level, and compared to predictions from various simulation programs or perturbative QCD calculations.
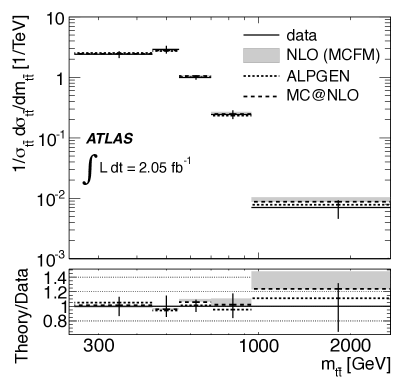
ATLAS measured differential distributions with of data [78] using a kinematic likelihood fit to reconstruct the top quarks in the single-lepton channel. In this first differential analysis, the bin size for the unfolding procedure was optimized to reduce the total uncertainties and a simple matrix inversion was preferred to a regularized unfolding in order to preserve the sensitivity to potential isolated deviations in any single bin from the Standard Model expectation. The typical measurement uncertainties ranged between and , already dominated by systematic effects. Results were presented as normalized cross-sections as a function of kinematic quantities of the pair, namely the invariant mass, (Figure 6, left), the transverse momentum, and the rapidity , and compared to calculations at NLO+NNLL [79], predictions by MCFM [80] at NLO, and the generators MC@NLO and Alpgen with particular choices of parameter settings.
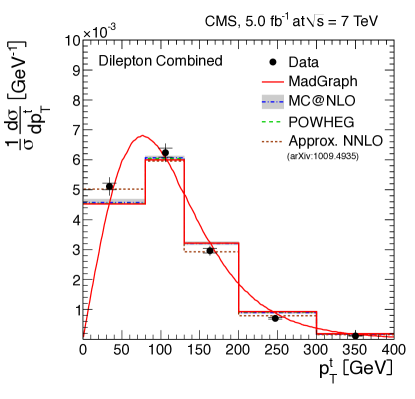
Differential measurements using the full dataset were performed by CMS in the single-lepton and dilepton channels [81] and by ATLAS in the single-lepton channel [82]. The kinematic properties of the top quarks were obtained using kinematic likelihood fits (single-lepton channel) and kinematic reconstruction (dilepton channel) algorithms. The data was corrected for detector effects and acceptance by using a regularized unfolding procedure with a bin width that was optimized to keep bin-to-bin migrations small. The results for the top-quark and distributions were presented at parton level and extrapolated to the full phase space. CMS also presented directly measured observables at particle level (leptons, -jets) in a fiducial volume as function of the transverse momentum, (pseudo)rapidity, and invariant mass.
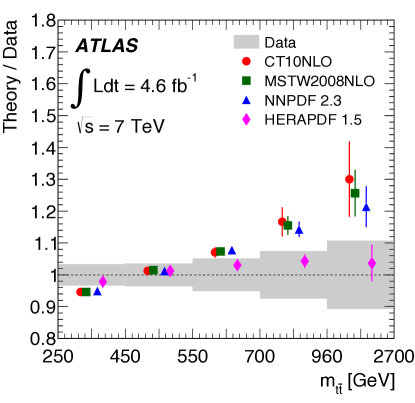
The normalized cross-section distributions were compared to various generators and parton-shower programs, while the top-quark and distributions were also compared with calculations beyond NLO accuracy. The measurements among the different decay channels are in agreement with each other and with Standard Model predictions in all distributions that were studied, with one exception: the top-quark transverse momentum (Figure 6, right) is poorly described by any of the MC simulations that were considered. ATLAS compared various NLO PDF sets to the extracted distributions, indicating that the data can be used to improve the precision of future PDF fits, with HERAPDF1.5 [83] being able to describe the and distributions best, as shown in Figure 7 (left).
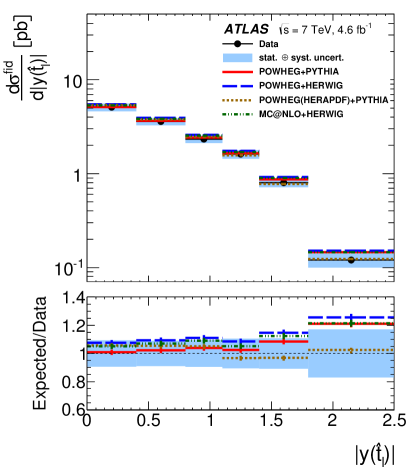
In a new approach, top-quark proxies (pseudo-top-quarks) were built from the reconstructed objects or final state particles [84]. The definition is chosen such that the experimental observable is strongly correlated with the top-quark parton and suffers from a smaller model dependence. The differential distributions of the kinematic properties of the pseudo-top-quarks, separately reconstructed in the leptonic and hadronic leg, were compared with MC@NLO, Powheg (Figure 7, right) and Alpgen, coupled to different parton-shower choices. The observables investigated with the dataset showed highest sensitivity to the PDF set and parton-shower model employed.
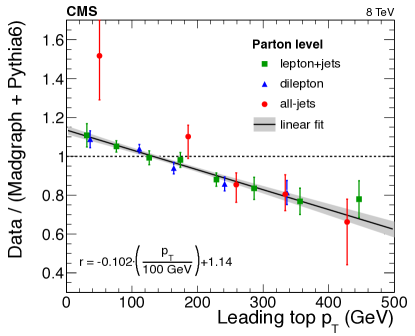
The top-quark transverse momentum was consistently found to be softer in data than in the MC samples based on LO or NLO generators interfaced to parton showers. While this was also confirmed later in the dataset, the agreement between the data and the Powheg+Herwig simulation for this variable is substantially better than other simulations. In subsequent CMS analyses a systematic uncertainty was added corresponding to the difference between the CMS data and simulation in the top-quark distribution. Since in all ATLAS top-quark measurements a comparison between Powheg+Pythia and Powheg+Herwig is performed, this discrepancy is considered to be covered by the modelling systematics.
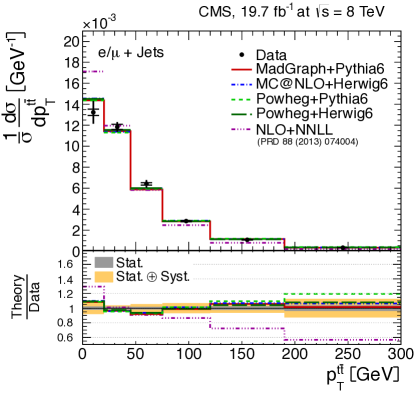
Most of the analyses were repeated at with the larger sample of events available at that energy, allowing almost an order of magnitude more events to be selected. The statistical precision together with improvements in kinematic reconstruction algorithms and extended systematic studies, lead to a significant reduction of the total uncertainties. CMS analysed the full dataset in the single-lepton and dilepton channels [85], as well as in the all-hadronic channel [53]. The strategy largely followed earlier analyses, with additional extracted distributions: the of the top quark and anti-quark in the rest frame, of the leading and subleading top (anti-)quark, , as well as the -jet pair system quantities and . Figure 8 (top) illustrates that, with the precision of these measurements, differences can be seen when comparing different models. For example the NLO+NNLL calculation [86] does not describe the transverse momentum distribution of the pair. The top-quark transverse momentum compared to the default MC simulation prediction MadGraph+Pythia 6 shows the same slope as was found in , now confirmed in all three decay channels.
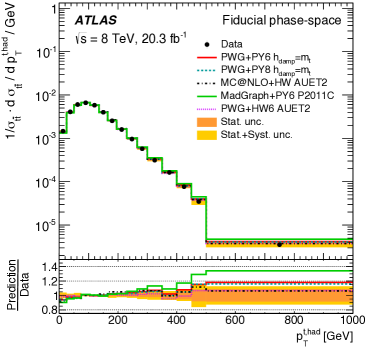
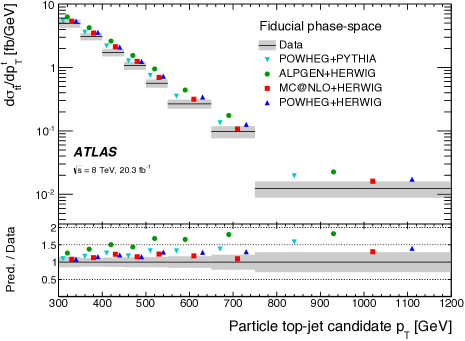
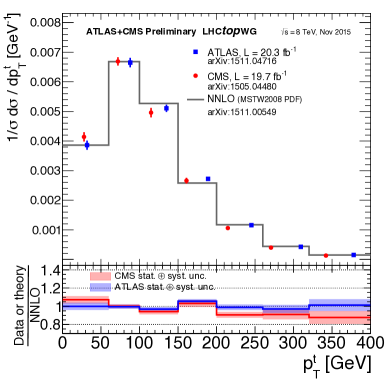
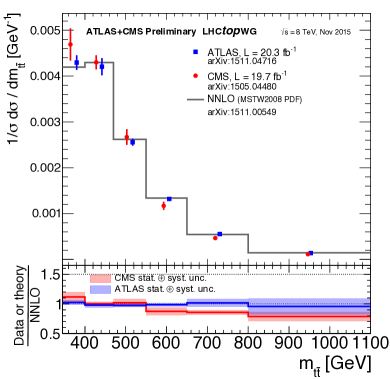
Differential cross-sections at were also measured by ATLAS in the single-lepton channel, as a function of the hadronic top-quark transverse momentum (Figure 8, bottom) and rapidity, and as a function of the mass, transverse momentum, and rapidity of the system. In addition, a new set of observables was included, describing the hard-scattering interaction (, ) and sensitive to the emission of radiation along with the pair (, , , ) [87]. In general, the Monte Carlo predictions agree with data in a wide kinematic region. The rapidity distributions are not well modelled by any generator under consideration, using the current settings and parton distribution functions. The level of agreement is improved when more recent sets of parton distribution functions are employed, where NNPDF 3.0 NLO [89] is found to provide the best description. Figure 9 shows comparisons of some differential distributions obtained by ATLAS and CMS to the full NNLO calculation [90]. ATLAS data appear to be well modelled by the full NNLO calculation, while the CMS data show a small residual difference.
The high top-quark region has been the target of further detailed studies, since a possible discrepancy could hint at physics effects beyond the Standard Model and studies allow for an improved understanding of the proton PDF. When top quarks are produced with large Lorentz boost their decay products tend to be more collimated and might escape standard reconstruction techniques, which typically assume a minimum angular separation of the final state products in the detector. In high- studies, the hadronically decaying top quark is reconstructed as a single large radius-parameter () jet. Jet substructure techniques are employed to identify such large- jets and tested for compatibility with top-quark decays. A detailed discussion on high- top-quark reconstruction can be found in Ref. [91]. Measurements have been performed with the full dataset by ATLAS [88] and CMS [92]. Large- jets, compatible with hadronic top-quark decays were selected and differential cross-sections as a function of the top-quark and rapidity were measured, both at particle level in a fiducial region and at parton level. The measurements have a threshold of to and extend beyond . Experimental uncertainties at particle level are of the order of and are dominated by the jet energy scale uncertainty of large- jets. Discrepancies between data and simulations observed at low- appear to be confirmed in the boosted regime. Different PDF and parton-shower parameter settings are shown to improve the agreement between data and simulation considerably (Figure 8 bottom).
Recently top-quark events were also observed in the forward region () by the LHCb experiment [93] using Run-1 data. Measurements in this phase space help constraining the gluon PDF at large Bjorken-, and to test differential NNLO calculations in an extended region. A significant excess of events over the Standard Model prediction with a high- muon and a high- -jet was found. Single top-quark and production cannot be distinguished and thus inclusive cross-sections were extracted in a fiducial region at and with uncertainties of . Differential event counts and a charge asymmetry as a function of the of the -jet system were also reported, the latter being sensitive to physics beyond the SM.
3 Single top-quark production
Single top quarks are mostly produced via charged-current electroweak interactions. Three channels can be defined, based on the virtuality of the boson: -channel, -channel and associated channel. Measurements of the cross-sections are useful to directly extract the CKM matrix element , to verify QCD calculations, and to compare to PDFs. Extensions of the Standard Model might affect the three channels in different ways and thus it is important to establish them separately.
3.1 -channel
At the LHC, single top-quark production via the -channel has the largest production cross-section. The final state is characterized by the presence of a light quark recoiling against the top quark and an additional low- quark, from gluon splitting, which often is outside the acceptance of the detectors. Because of the smaller number of jets and the smaller cross-section with respect to production, backgrounds are generally more important than in the case of . To suppress multijet events, only semileptonically decaying top quarks are considered. At least one jet is required to be -tagged, in order to reduce the +jets background, at the cost of an increased sensitivity to the correct modelling of heavy-flavour production associated with bosons. Finally it is of particular importance to efficiently reject quarks from jet or decays and thus the -tagging algorithms were often specifically tuned to achieve this.
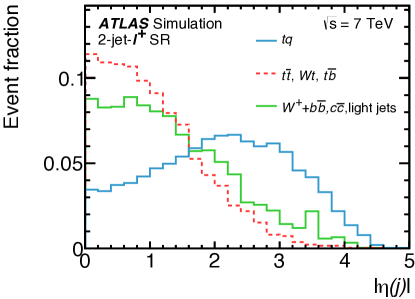
With only of data CMS found evidence of -channel production at the level, complementing a two-dimensional maximum likelihood fit with a multivariate analysis [94]. The two discriminating variables are based on the angle between the lepton and the light jet in the top-quark rest frame, effectively probing the polarization of the top-quark, which is predicted to be almost 100% for signal, and on the pseudorapidity of the light jet, which is expected to be produced more forward than the jets from the background processes. For the second analysis a boosted decision tree was trained with nearly 40 variables, including , , , and . Figure 10 shows the distributions of two of the discriminating variables. The signal was modelled with MadGraph+Pythia, and background shapes were taken from simulation, and, in the case of +jets, rescaled according to data-to-simulation comparisons in control regions. The results of the two analyses were statistically combined to obtain an overall measurement of the cross-section with an uncertainty of , compatible with predictions based on NLO+NNLL perturbative QCD calculations [95].
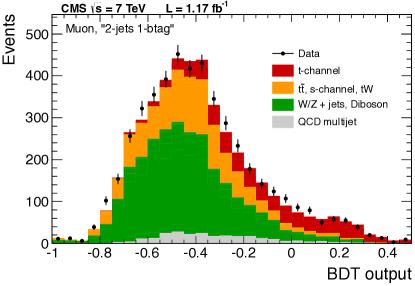
With to times more data, still at , both ATLAS and CMS determined the inclusive cross-section, reducing the uncertainties to [98] and [99], respectively. In the ATLAS analysis a neural network (NN) was trained and the result was cross-checked with a cut-based analysis. The signal was modelled using the AcerMC generator. The larger amount of data allowed the signal in the two regions to be separated, depending on the number of reconstructed jets: at leading order two jets are expected, while a third jet may arise from higher-order processes. The backgrounds with fake leptons were estimated using a selection of jets that satisfy a subset of the electron identification requirements. The normalizations of the +jets and +heavy-flavour processes were directly determined in the fit of the NN discriminant. Two NNs were trained in the - and -jet regions separately. The optimization resulted in using 12 and 18 variables, respectively, based on invariant masses, such as or , the properties of the highest untagged jet, and , the spatial separation of reconstructed objects in the detector, and the global energy deposition in the detector (, ). The cut-based analysis used a subset of the variables and separated the sample further, based on the charge of the reconstructed lepton: due to the difference in PDF of the incident u and d quarks involved in the hard scattering, the ratio is expected to be . Systematic uncertainties dominated the total uncertainty. The limited knowledge of initial and final state radiation and of the calibration of the -tagging efficiency sum up to uncertainty on the final measurement. The CMS analysis drew from the previous experience. The two-dimensional likelihood was reduced to the usage of to minimize reliance on the SM assumption for top-quark polarization and after imposing a requirement on a neural network was trained in addition. The final result was quoted as a combination of the three results. The single top-quark -channel signal was modelled with Powheg. Events were classified in six signal regions, based on the number of jets and -jets, including those with 4 jets, allowing a better constraint of the systematic uncertainties that were implemented as nuisance parameters in the fit. For the neural network about 40 variables were selected for the training, with the following being ranked as the most discriminating: , the reconstructed transverse boson mass , of the leading jets, and the total transverse energy of the event. The experimental uncertainties and background estimates were both marginalised in the fit, while the theoretical uncertainties were not. The combination improved on the single multivariate result, reducing the total uncertainty to . Some of the discriminant output distributions for BDTs and NNs are shown in Figure 11.
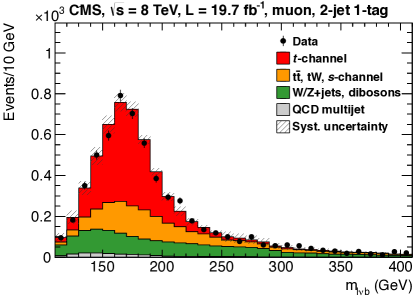
The full dataset has been exploited by CMS [97] to extract the single top-quark and anti-quark cross-sections, the ratios and , and to compare these results with QCD calculations [100, 101] and with different PDF predictions. The analysis only considered the distribution in the 2-jets 1--tag region to extract information on the single-top -channel. Here the template from simulation was corrected with the help of data measured at higher jet and -tag multiplicities. The extracted values of were compared with different PDFs, as shown in Figure 12 (left).
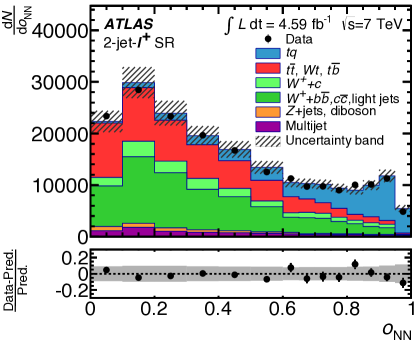
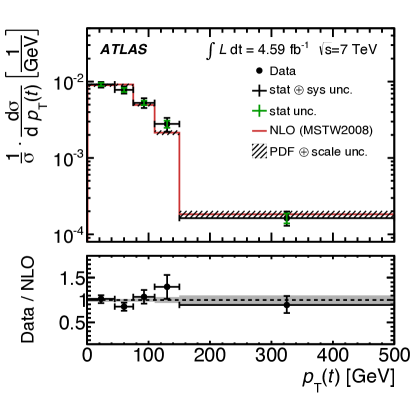
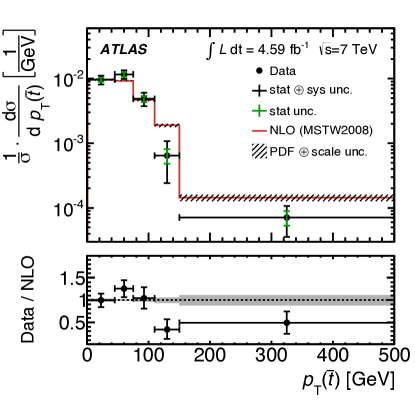
With the full dataset ATLAS [96] obtained measurements of the cross-sections and cross-section ratios (Figure 12, right). A similar strategy of training a NN was adopted, additionally taking advantage of the difference in single top-quark and anti-quark production. First single-top -channel differential cross-sections were measured as a function of the top quark and anti-quark and rapidity after unfolding to the parton level and compared to MCFM predictions at NLO (Figure 13).
3.2 channel
Associated production is an interesting channel to study, as well, as its sensitivity to new physics is complementary to the other channels and it represents an important background in studies of the Higgs boson. The associated production of a single top-quark and a boson involves the interaction of a gluon and a quark, emitting an on-shell boson. The final state is thus the same as in , but with one fewer -jet. At NLO the and diagrams interfere, but the effect is small and considered as a modelling uncertainty by comparing two algorithms to avoid the double counting of generated events [102, 103]. The predicted cross-section is calculated at approximate NNLO, with soft gluon resummation at NNLL [104].
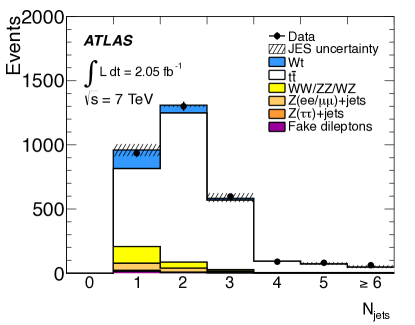
The first evidence of production was reported by ATLAS with of data [105] where only leptonic decays of the bosons were considered, yielding final states . The signal, which was modelled with the AcerMC generator, resides mostly in the 1-jet bin after a dilepton event selection, as can be seen in Figure 14. The contribution from +jets and events with fake leptons was estimated with data-driven methods. The large dilepton background is difficult to suppress and therefore a BDT using 22 input variables was constructed for each of the channels , and , separately. The most discriminating variables were the magnitude of the vectorial sum of the transverse momenta of the jet, the leptons and , and this variable normalized to the scalar sum of the same transverse momenta. These variables were also used to construct BDTs in the 2-jet and 3 or more jet regions, in order to constrain the background normalization. A template fit was then performed to the three BDT output distributions, allowing the yield to be extracted, and mitigating the effect of systematic uncertainties affecting extra jet production, such as the jet energy scale and resolution, as well as the modelling of initial and final state radiation. The result of the measurement has a significance of and the measured cross-section is compatible with the prediction.
This result was confirmed by CMS with the full dataset, at the level [107]. The analysis strategy was similar, with the addition of further refining the categorization based on the -tagging information from the selected jets, and correcting the +jets simulation to match the observed distribution with a data sideband region to reduce mismodelling. The BDTs were trained with four input variables only, and the analysis was cross-checked with a cut-based approach, using the channel, only, obtaining comparable results.
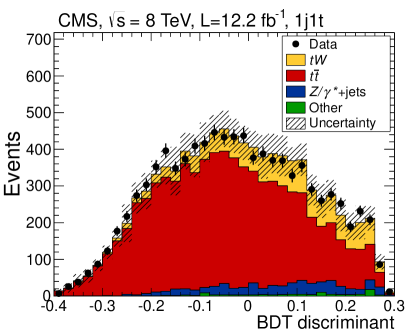
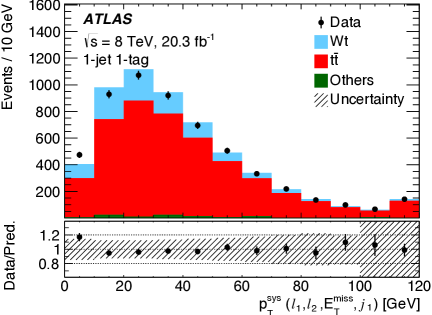
The definitive observation of this process was only possible with the dataset. Using a partial dataset of CMS reported a significance of [106] pursuing the same analysis strategy as at . The BDT output distribution in the signal region with one extra jet is shown in Figure 14. The most recent and most precise measurement was performed by the ATLAS collaboration, using the complete Run-1 dataset at [108], with a significance of and a measurement of the total cross-section in agreement with the prediction and with an uncertainty of , dominated by systematic uncertainties, for instance the amount of additional radiation. The template fit has been replaced by a profile likelihood fit to the BDT classifier output. Figure 15 (left) shows the most sensitive variable in the signal region with one central -tagged jet. The measurement has been also performed in a fiducial region, including and contributions, with a relative precision of . This analysis treats and as signal so that it can be compared to full NLO calculations in the future [109].
3.3 -channel
Production of single top-quarks in the -channel is strongly suppressed relative to the backgrounds at the LHC, since it proceeds through quark-antiquark annihilation, requiring a sea antiquark in the initial state. The distinctive signature for this process is the presence of a top and a bottom quark in the final state. The apparent cross-section could be strongly modified by the presence of a charged Higgs boson or an exotic boson that would yield the same final state particles. The single-top -channel process has been calculated at NLO+NNLL [111, 112].
At , using a BDT analysis, ATLAS placed an upper limit of times the Standard Model prediction [113] with a significance of ( expected, assuming the SM rate). The quoted cross-section uncertainty was dominated by systematic effects, mainly the scale uncertainties in and the jet energy. Events with exactly two -tagged jets were selected and a BDT was trained to reduce the impact of the large remaining background. A similar BDT analysis was performed by CMS with the 7 and datasets [114], obtaining a combined significance of ( expected).
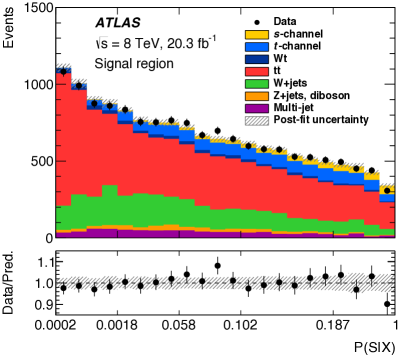
The ATLAS dataset has been reanalysed with improved event selections, simulation, calibration and employing a matrix element (ME) method to separate the signal from the dominant and boson production with heavy flavour [110]. Theoretical calculations were used to compute a per-event signal probability. For each event, likelihoods were computed for signal and each background process under consideration. The likelihoods were determined using the corresponding partonic cross-sections and transfer functions, that map the measured final state to the partons, taking into account permutations, reconstruction efficiencies and resolution effects. A discriminant was then built as a ratio of these likelihood probabilities. The distribution of this discriminant for the signal region is shown in Figure 15 (right). The analysis obtained a significance of ( expected) and a measured cross-section with a relative uncertainty of . Approximately half of the improvement was due to the change in method from BDT to ME. The ME approach is statistically powerful and is less affected by the limited size of MC samples available for training and calibrating the analysis.
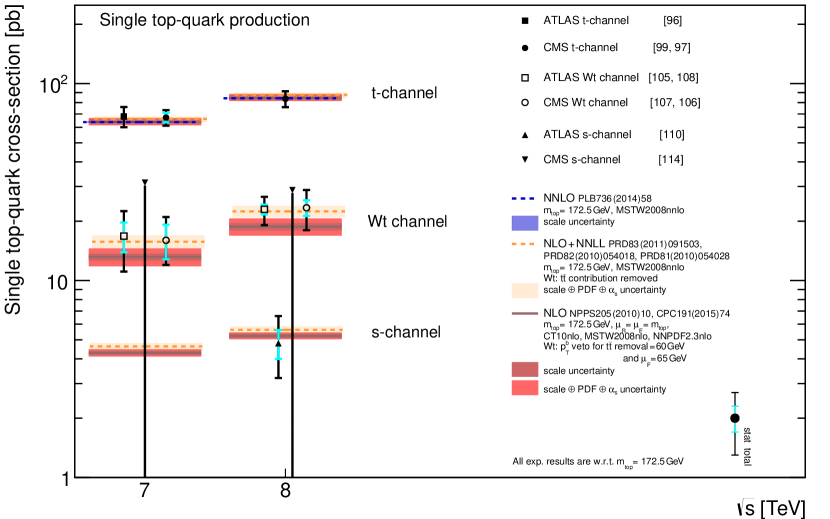
The most precise single-top cross-section measurements in each channel and experiment at and are summarized in Figure 16 and compared to predictions.
3.4 Determination of from single top-quark measurements
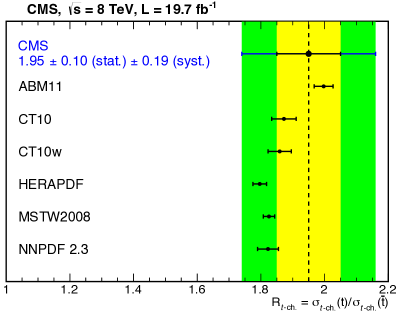
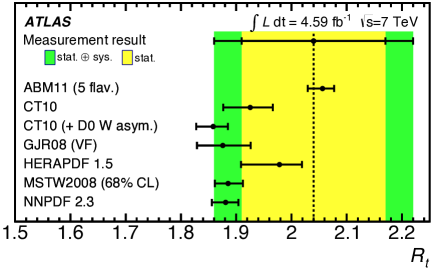
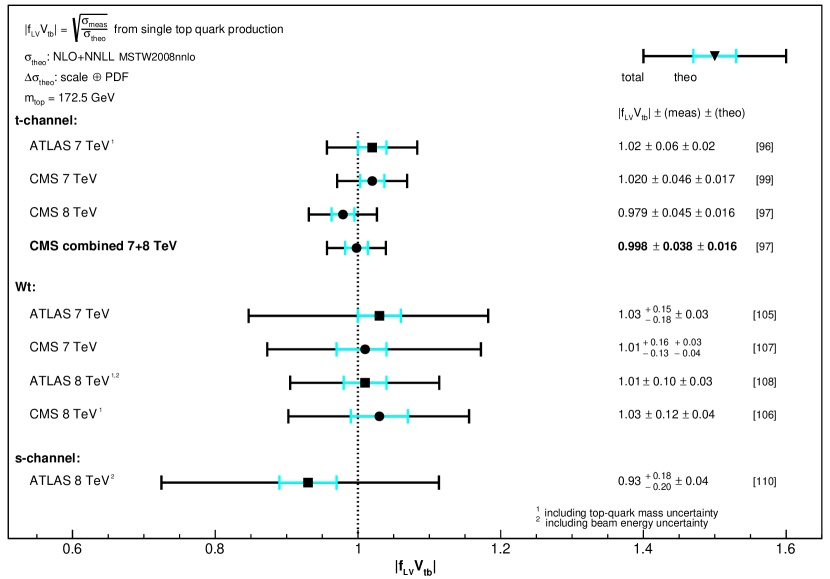
The three single top-quark production channels discussed in this section, are directly related to the Cabibbo-Kobayashi-Maskawa (CKM) matrix element , as the predicted cross-section is proportional to . For the extraction the assumption is that and that the interaction is purely left-handed as predicted by the Standard Model. The measurements are independent on the assumption about the number of quark generations and about the unitarity of the CKM matrix. The measured single-top cross-sections in the different channels were thus divided by the respective theoretical prediction to extract . The most precise measurements are obtained in the -channel with uncertainties of , followed by the channel with uncertainties of , and finally the -channel with an uncertainty of . The measurements from single-top inclusive cross-section measurements at and are summarized in Figure 17.
4 Top-quark mass
Arguably the most distinctive property of the top quark is its mass, about 40 times larger than the mass of the second-heaviest known fermion, the quark. As for all other fermion masses, it is a free parameter of the Standard Model. Its value is therefore not predicted by the theory but can be inferred from experimental measurements, either through direct measurements of the invariant mass of its decay products, or indirectly through predicted relations with other measured observables, such as the production cross-section at a given centre-of-mass energy.
4.1 Early mass measurements at the LHC
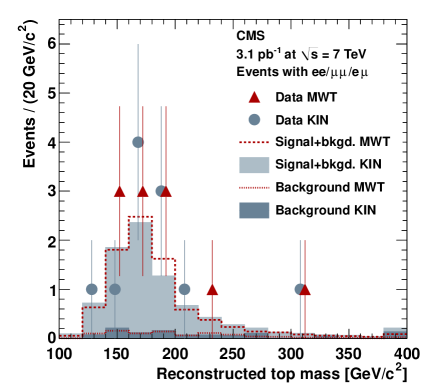
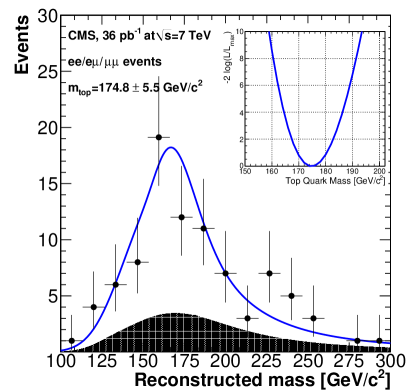
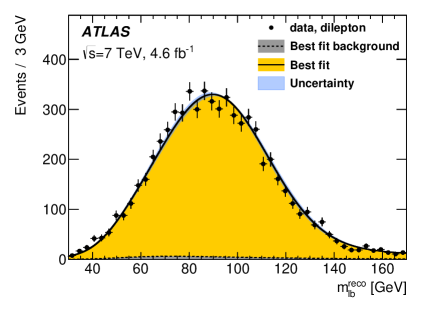
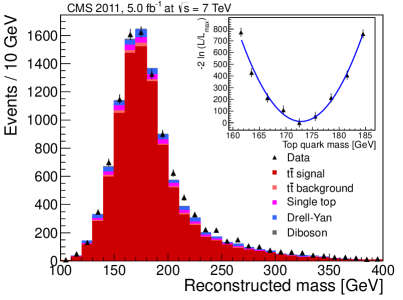
Traditionally the most precise measurements for the top-quark mass have relied on the full kinematic reconstruction of selected top-quark pair events, and extraction of the top-quark mass based on the invariant mass of its decay products. Employing analysis techniques developed over many years at the Tevatron collider, the first top mass measurements at the LHC appeared quickly after the start of data taking. Designed to extract maximum possible statistical information from the events, these techniques allowed a first hint of the top mass already in very early LHC data, with just [29], and a first measurement after at [32] using the dilepton decay channel, as illustrated in Figure 18.
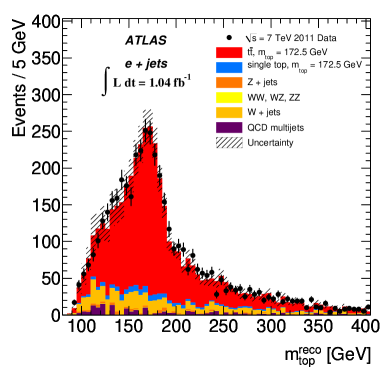
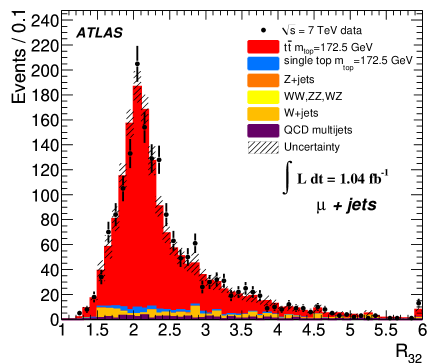
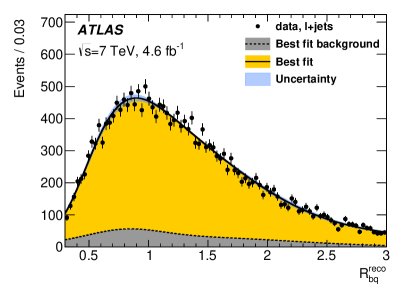
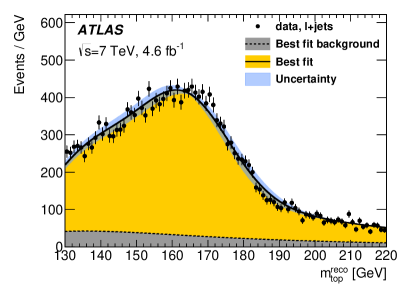
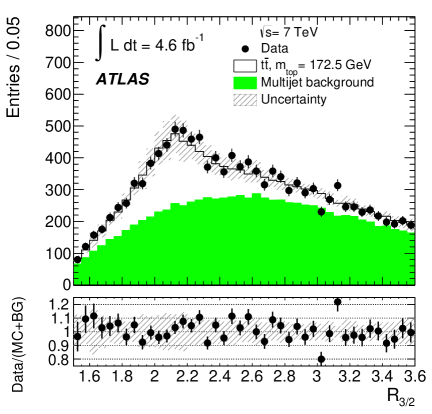
Other measurements soon followed, with more data and a better understanding of the jet energy scale calibration. The single-lepton channel has the advantage of combining moderate backgrounds with a sizable branching fraction, and was employed by ATLAS to perform the first measurement at the LHC with a relative precision better than 2% [115] using of data at . Another advantage of the single-lepton channel is that the boson from one of the top quarks decays hadronically, which gives the possibility to measure the jet energy scale in-situ, in the selected events. In [115] this was done by introducing the variable, defined as the ratio of the reconstructed mass of the three jets from the hadronic top decay and the mass of the two jets out of the trijet system that are not -tagged, . Effectively this variable measures the ratio between the top-quark mass and the boson mass. Since the latter is known with excellent precision, this variable reduces the sensitivity to the overall scale of the jet energies, and it reduces event-by-event fluctuations due to the finite resolution of the reconstructed mass . The top-quark mass was extracted from a template fit of the distribution, shown in Figure 19.
4.2 Towards ultimate precision in the single-lepton channel
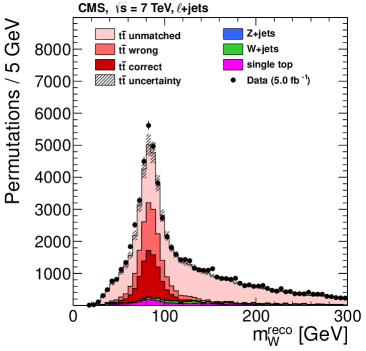
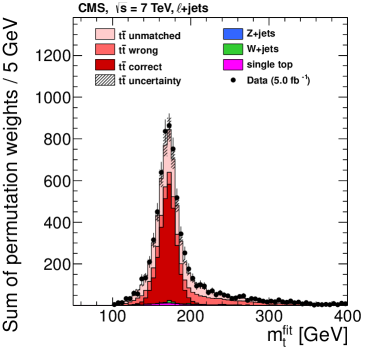
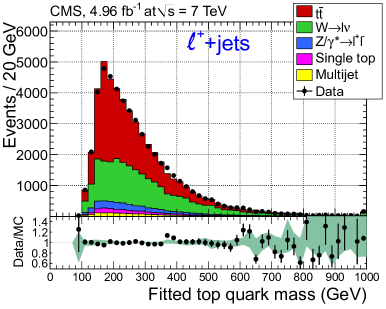
Using the full dataset available at , CMS performed a 2-dimensional fit to determine an overall jet energy scale factor together with the top-quark mass [116]. Templates of the reconstructed boson mass (Figure 20, top left) were used together with templates of the reconstructed top-quark mass (Figure 20, top right) to construct an event-by-event ideogram likelihood taking into account all jet assignments compatible with the available -tagging information. The event-by-event top mass reconstruction was improved beyond the detector resolution by using a kinematic fit imposing equality of the top quark and top anti-quark masses and constraining the reconstructed boson mass to the known value. This approach has the advantage that one can explicitly check the compatibility of the fitted jet energy scale factor with unity, the value corresponding to the original jet energy calibration. While this allows the average overall jet energy scale to be constrained, or more precisely the jet energy scale for light-flavour jets from boson decay, it does not constrain dependencies of the jet response due to jets originating from quarks of different flavours, in particular -jets.
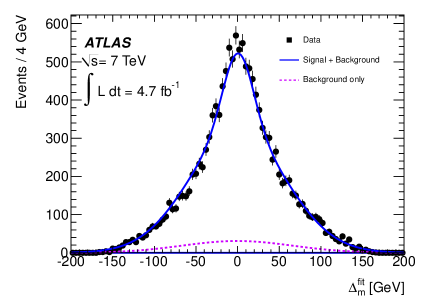
The ATLAS analysis in the single-lepton channel addressed this issue by performing a 3-dimensional fit of the top-quark mass, overall jet energy scale factor JSF, and an additional scale factor bJSF describing any possible deviation between the jet response in jets from light-flavour quarks and quarks [117]. To constrain bJSF, a new variable was introduced probing the transverse momentum balance of -tagged jets versus all other jets. A distribution of this variable, is shown in Figure 20 (middle left), and the reconstructed top mass in Figure 20 (middle right). This analysis approach significantly reduces the otherwise dominant systematic uncertainties due to -jet energy calibration, at the cost of an increased statistical uncertainty. With larger datasets at and future LHC data beyond Run-1, however, prospects are excellent for further reduction of the overall measurement uncertainties.
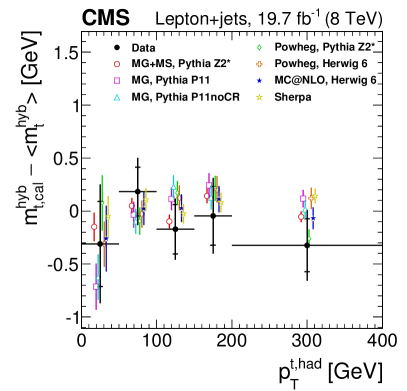
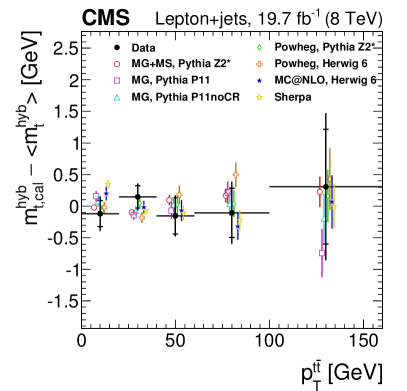
At CMS employed the same ideogram likelihood technique as before, but using a hybrid approach whereby the 2-dimensional fit and 1-dimensional fit with fixed jet energy scale factor were combined with a weight, reflecting the relative precision of the externally provided jet energy scale calibration and the scale factor determined in situ in the selected events. Together with the advantage of the larger data sample this yielded the most precise measurement of the top-quark mass to date, with a total relative uncertainty of [118]. The larger dataset also allowed the stability of the measured top-quark mass to be tested as a function of kinematic properties of the selected events. The difference in measured mass, compared to the inclusive measurement, is shown in bins of the of the reconstructed top quark and of the system in Figure 20 (bottom). This study was done for eight variables, and several generator setups, and no significant deviation in measured was observed. The stability of the result in many corners of phase space is an indication that the main physics effects that could possibly bias the top mass measurement are accurately described by the MC simulation models used, and properly corrected for in the analysis, at the current level of precision.
4.3 State-of-the-art in the dilepton channel
Thanks to the large production cross-section at the LHC, analyses in the dilepton channel also yield sub-percent precision top-quark mass measurements, in spite of the smaller branching fraction and presence of neutrinos. CMS [119] and ATLAS [117] measured the top-quark mass in this channel at , already, and again at [118]. While CMS still relied on full kinematic reconstruction to obtain the best possible statistical precision, the ATLAS measurement demonstrated that with the large number of events available at the LHC, simpler and potentially more robust variables can be equally powerful. Using the invariant mass of the lepton from the boson decay and the corresponding -jet, , a template fit was performed. The advantage of using is that the distribution of this variable can in principle be predicted using fixed-order perturbative QCD calculations, opening the door to measurements with a well-defined perturbative mass scheme [120]. The distributions for are shown in Figure 21.
4.4 The all-hadronic channel
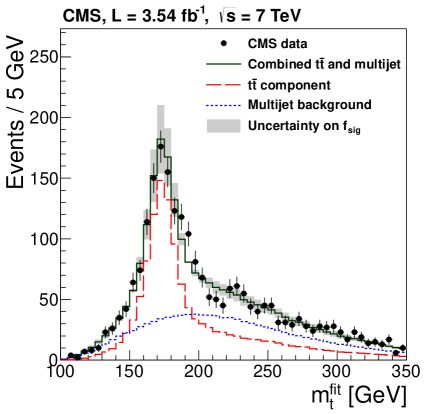
At the LHC the all-hadronic channel can also yield competitive mass measurements, thanks to the more favourable signal-to-background ratio [121, 122], compared to the Tevatron, albeit with an increased number of additional jets from ISR and FSR and corresponding jet assignment ambiguities. The absence of neutrinos helps to achieve an excellent event-by-event mass resolution. To reduce the jet energy scale uncertainty, ATLAS used a template fit to the variable introduced before in the single-lepton channel, as shown in Figure 22 (left). In the case of CMS the same ideogram likelihood fit as in the single-lepton channel was performed, including the in situ constraint of the jet energy scale factor, but in the end a more precise expected result was obtained at using a traditional 1-dimensional fit, keeping the jet energies fixed to the CMS standard jet calibration obtained from other sources, yielding the fitted mass distribution shown in Figure 22 (right). At CMS used the same hybrid fit as in the single-lepton channel, combining the 1- and 2-dimensional fits to obtain the best precision. The significant background from QCD multijet events poses two major challenges for analyses in the all-hadronic channel. The jet thresholds in the trigger are high, forcing offline reconstruction selection thresholds to be even higher, or alternatively requiring a very good understanding of the trigger efficiency close to the trigger thresholds. Secondly, for the modelling of the multijet background it is typically not feasible to generate Monte Carlo samples with sufficiently large number of events, and the accuracy of the modelling of multijet events is also hard to establish. Therefore, dedicated methods were developed to derive the background shapes from data events. The CMS analysis employed a side-band technique, where the shape of the background was estimated from events with six or more jets that did not pass the -tagging requirements [122], and the probability for individual jets to be -tagged is applied on a jet-by-jet basis. The ATLAS analysis relied on six regions, defined by two variables with minimal correlation, to determine the shape, normalization and uncertainty on the normalization [121].
4.5 Difference between the top quark and top anti-quark mass
Both ATLAS and CMS have measured the difference between the top quark and top anti-quark mass, using data collected at in the single-lepton channel. A genuine difference in mass between particle and anti-particle would indicate a violation of symmetry, invalidating a fundamental assumption of any quantum field theory. Also, for collisions at the LHC, it is not excluded that QCD effects might have a slightly different influence on the top quark and top anti-quark decay products in the events. Thus, it is important to test that such differences are negligible, or at least properly modelled by the event simulation.
The ATLAS analysis [123] used a variable that measures the difference between the top quark and anti-quark mass on an event-by-event basis, shown in Figure 23 (left). The approach adopted by CMS [124] was to use the charge of the semileptonically decaying top (anti-)quark to decide whether the decay was from a top quark or anti-quark, and to reconstruct the mass from the hadronic decay of the other (anti-)quark in the same event, as shown for the top anti-quark sample in Figure 23 (right). Thus the masses were extracted separately for the top quark and anti-quark samples using the ideogram technique. Both experiments measured a difference compatible with equality of the masses, with a precision of . Many of the systematic uncertainties cancel by taking the difference, or are at least strongly reduced. The measurements are still limited by the statistical precision, and have good potential to become more precise from the analysis of the larger data samples recorded at a centre-of-mass energy of or to be recorded in future LHC runs.
4.6 World average combination
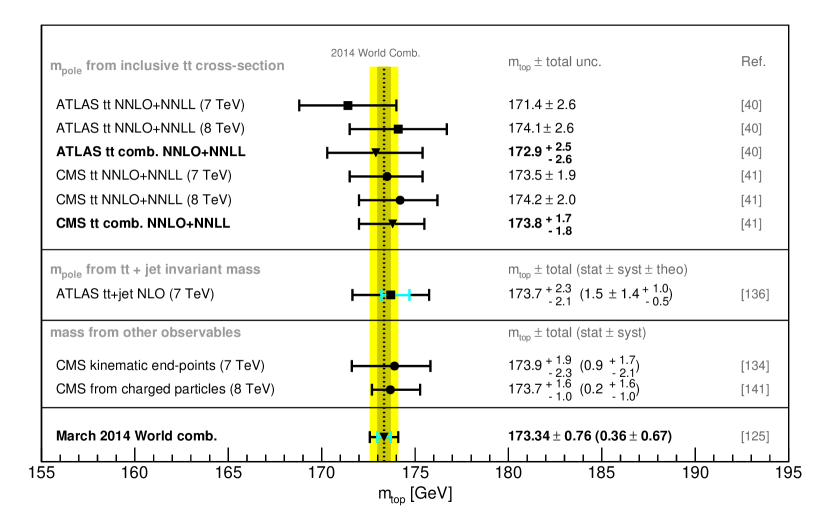
The four experiments ATLAS, CDF, CMS and D0 prepared a combined result of the most precise top-quark mass measurements available as of March 2014, yielding the following world-average value of the top-quark mass [125]:
As can be seen in Figure 24 the world average value is in good agreement with the results obtained at the LHC, including the measurements that appeared more recently.
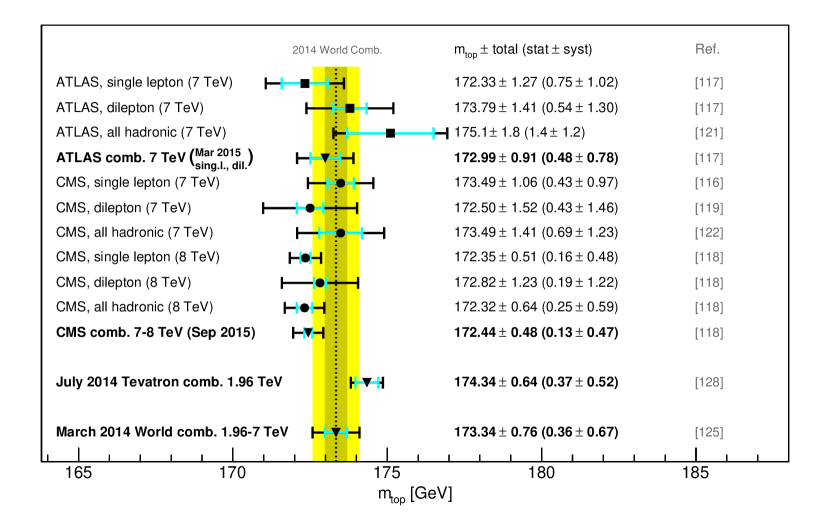
The latest ATLAS measurements [117, 121] using the full dataset were not included in the world average, but are in good agreement. The combination of the results in the dilepton and single-lepton channel yields [117] .
The latest CMS measurements in all decay channels at [118] used analysis methods that are very similar to the analyses. Thanks to larger datasets, an improved jet energy calibration, and small improvements in the methods, the final uncertainty was significantly reduced in spite of a more complete treatment of systematic uncertainties. The overall combined CMS result becomes ; a bit lower in value but in agreement with the world average.
Also at the Tevatron new top-quark mass measurements were published after March 2014. In particular the measurement by D0 using the Run II data set of in the single-lepton channel yielded a very precise result of [126, 127]. Including this new measurement the updated Tevatron mass combination, [128], appears to have converged to a somewhat higher value than the latest LHC measurements as shown in Figure 24. A careful evaluation of correlations between sources of systematic uncertainty for the latest measurements at the Tevatron and the LHC is underway, in preparation for the next update of the world average combination.
4.7 Interpretation of the top quark mass measurements
With a precision below 0.5% in the best results it is important to define exactly what quantity is measured. All measurements discussed so far, and included in the combinations, are calibrated using Monte Carlo simulations and thus measure the Monte Carlo top mass parameter as a matter of definition. A proper relation between this Monte Carlo mass parameter and the SM parameter used in field theoretical calculations is lacking. For the top-quark mass the choice of a renormalization scheme for the theoretical mass definition is known to have large effects on the numerical value of the obtained mass. The difference between two popular schemes, and the pole mass, is as large as . Once the mass is known in a short-distance scheme like the scheme, however, it can be transferred to a different short-distance mass scheme with good precision, typically well below [129]. However, the pole mass scheme is not a short-distance scheme and it is affected by the so-called renormalon ambiguity which limits the precision of its translation to other mass schemes to about at best [129, 130]. It has been argued that the Monte Carlo mass parameter is expected to be close in numerical value to the pole mass definition, with an unknown offset that is thought to be up to , and that it would be preferable to avoid the use of the pole mass scheme all-together and directly relate the Monte Carlo mass to a short distance mass definition like the MSR mass [131, 132, 133]. For a proper choice of scale parameter this scheme could have a numerical value close to the pole mass, without suffering from renormalon ambiguities.
To establish quantitatively the size of a possible offset between the Monte Carlo mass and a suitable theoretical mass definition it is useful to compare the Monte Carlo prediction for a physical observable to a prediction from a first-principles QCD calculation with corrections up to the level of stable particles after radiation and hadronisation. In principle the offset can be different for different observables, so the calibration would have to be performed for each observable of interest.
One could also argue that in practice the differences between the MC mass and a pole mass definition are related to perturbative and non-perturbative QCD corrections that are to first approximation described by the MC simulations and to some extent already covered by systematic uncertainties related to theoretical modelling already assigned. If this is true, different methods using different observables should yield top mass results that are compatible within the assigned uncertainties.
Either way, a possible bias in the mass definition could depend in principle on the observable, and it is therefore useful to measure the top mass with as many different observables as possible, and to explore alternative methods that allow the use of a well-defined QCD calculation without the use of a Monte Carlo program as intermediate step.
4.8 Non-standard methods
In pursuit of a more complete picture of the universality of top mass measurements, several alternative methods have been pursued at Run-1.
The CMS collaboration has documented the kinematic endpoint method in the dilepton channel[134], which uses purely kinematic predictions for the endpoint of lepton-related distributions.
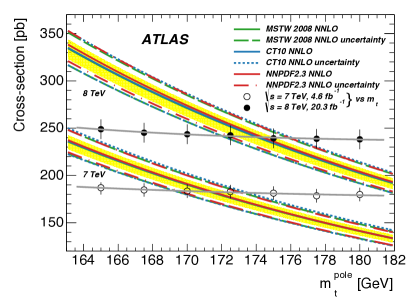
Both experiments have also extracted the top-quark pole mass by comparing the cross-section calculated at NNLO+NNLL accuracy with the measured cross-sections at 7 and [42, 40, 41]. The analyses were already described in Section 2 and the results are illustrated in Figure 25. While this is a theoretically very clean method to extract the top-quark mass, the precision is less than what can be achieved with the direct measurements of the invariant mass of the top decay products. Methods that promise to yield a mass measurement with improved precision, in a well-defined pole-mass scheme are the proposed jet method [135] or the use of [120] with a fixed-order QCD prediction. Applying the jet method to the dataset, the ATLAS collaboration obtained a measurement of the top-quark mass in the pole mass scheme [136] with a precision of , with a potential to obtain further improvements using the larger dataset.
Several other methods have also been proposed with the underlying goal of measuring the top-quark mass using different observables, thus obtaining complementary information. Ultimately this will help to obtain the most accurate measurement of the top mass and also provide limits on scenarios in which physics beyond the Standard Model might affect some observables more or differently than others. For example, the use of only leptonic variables [137] has been proposed to minimize potentially poorly understood and modelled effects of non-perturbative QCD. Other proposals advocate the use of the -jet energy spectrum [138], the invariant mass of a meson and an isolated lepton [139] or the boost of the -jets extracted from the transverse -hadron decay length measured with charged particles only [140]. The latter approach was implemented initially by CDF and extended by CMS to use the invariant mass of the -jet secondary vertex and the lepton from boson decay [141], still using only charged particles in the measurement, thus avoiding systematic uncertainties related to full reconstruction of jets. The results are promising and indicate a potential to reach sub- precision with this method in the near future.
An overview of existing LHC measurements with alternative observables, compared to the world average top mass result is shown in Figure 26. So far all results agree with each other and with the more precise LHC measurements from full reconstruction. With uncertainties of or larger it is too early to resolve hypothesized sub- differences related to the choice of the observable and of the mass scheme definition.
The measurement of the top-quark mass and its theoretical interpretation is clearly a very active field and there is still potential for improvements, from further analysis of Run-1 data, theoretical developments, as well as from the future LHC data.
5 Top-quark spin
The average lifetime of top quarks is a factor of smaller than the hadronization timescale (), which in turn is smaller than the spin decorrelation timescale . This means that the top-quark states maintain their spin from the time of production to the time of decay, and information about the spin state is preserved in the distributions of the top-quark decay products.
5.1 Top-quark polarization
In the case of production, which happens predominantly through the strong interaction, parity conservation in QCD implies that the top quarks are produced with zero longitudinal polarization. Small corrections from the weak interaction have a negligible effect. A deviation from this SM prediction would be a clear indication of physics beyond the Standard Model. At , the ATLAS collaboration performed a measurement combining the dilepton and single-lepton channels [142] and CMS in the dilepton channel [143, 144], shown in Figure 27, all confirming negligible polarization of top quarks in production, in agreement with the SM prediction.
Production of single-top quarks, on the other hand, proceeds through the weak interaction, leading to a strong polarization of the top (anti-)quarks. Using single top-quark events produced through the -channel mode, clear indications of this polarization were found by CMS at [145], albeit with a somewhat smaller strength than predicted by the SM at NLO (Figure 27, bottom right).
5.2 Top-quark pair spin correlations
While top quarks in production are unpolarized, their spins are expected to be strongly correlated. One can measure the spin correlation strength by studying the angular correlations between the decay products, where
is the asymmetry between the number of pairs with aligned and anti-aligned spins. The value of depends on the spin quantization axis chosen and on the production mode.
At the LHC, the dominant production mode is gluon fusion, with a small contribution from annihilation which is reduced further at higher collision energies, leading to slightly different values of at different values of .
Deviations from the correlation strength predicted by the SM can be quantified by considering a mix of SM correlated events and uncorrelated events, and defining the fraction of events with the SM prediction of spin correlation as
where is the number of SM events, and represents the number of events with uncorrelated spins. The top quark and anti-quark in the uncorrelated events are expected to decay spherically. In the assumption that there are only SM and uncorrelated events, the physical range of the parameter is restricted to the interval from 0 to 1, with corresponding to a sample of events produced by the SM and indicating a sample with uncorrelated top pairs. An unconstrained template fit is often performed, allowing values of this parameter outside this interval.
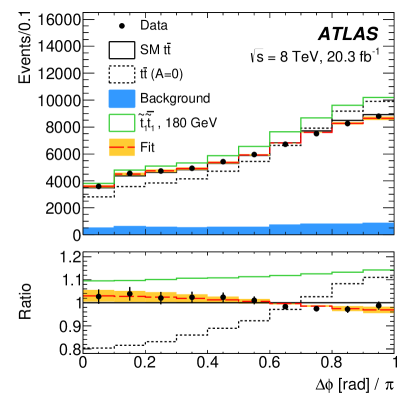
At the LHC, the ATLAS collaboration performed the first measurement that excluded the uncorrelated hypothesis by more than [146] using a template fit to the difference in azimuthal angle between the two oppositely charged leptons () in the dilepton final state at . Subsequent measurements analysed a variety of angular variables, either performing template fits [147] or presenting unfolded distributions after correcting for detector efficiency and resolution effects [143, 148]. Measurements in the dilepton channel were also performed at by both collaborations [149, 144].
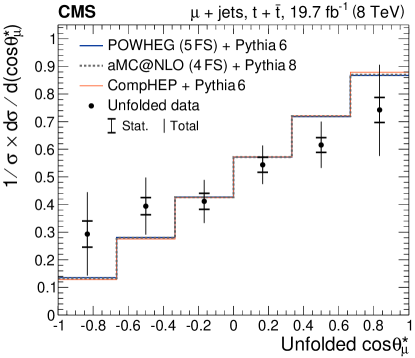
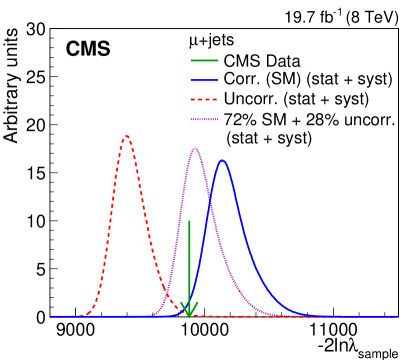
Measurements in the single-lepton final state at the LHC have been performed employing a more complete reconstruction of the events. The ATLAS collaboration performed a measurement based on the opening angle distributions between the decay products of the top quark and anti-quark [147] at , while CMS used the single-muon channel employing full reconstruction of the events and a matrix element method at [150]. In this approach, the likelihood of an observed event to be produced by a given theoretical model is calculated, taking into account the full kinematic configuration of the top-quark decay products in every event. The likelihood ratio of the sample allowed the correlated and uncorrelated hypothesis to be distinguished, see Figure 28 (left), and a template fit was performed to extract a value of best fitting the data.
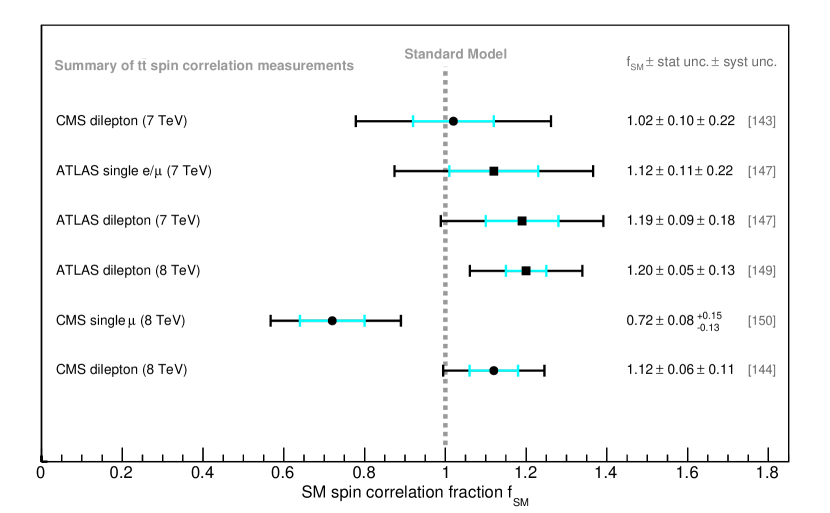
A summary of spin polarization and correlation results in Run-1 is given in Figure 29. The most precise results were obtained in the dilepton channel at . Both ATLAS and CMS measured a spin correlation slightly stronger than expected, although compatible with the SM prediction, in most cases. As the presence of physics beyond the SM in certain scenarios would reduce the observed spin correlation strength, these measurements tend to disfavour this class of new physics models. The ATLAS spin correlation measurement was interpreted to exclude the existence of top squarks () with a mass between the top-quark mass and at 95% confidence level [149], assuming a 100% branching ratio for and , as illustrated in Figure 28 (right). In a more general approach, the CMS collaboration set limits on anomalous top-quark chromo moments, in particular on the real part of the chromo-magnetic dipole moment and the imaginary part of the chromo-electric dipole moment [144].
6 Charge asymmetry
The production of top-quark pairs via gluon fusion and quark annihilation is predicted to be symmetric under charge conjugation at leading-order in QCD. Due to the interference between initial and final state gluon radiation and the interference between Born and box diagrams a net asymmetry arises at next-to-leading order for and induced production. At the Tevatron the initial asymmetric charge configuration of collisions causes top quarks to be preferentially emitted in the direction of the incoming quark and top anti-quarks in the direction of the incoming anti-quarks. The charge asymmetry is measured as a forward-backward asymmetry and is computed at next-to-next-to-leading order accuracy to be [151]. At the LHC the collisions provide a symmetric initial state and a small charge asymmetry is induced by the momentum difference of the valence and sea quarks: valence quarks carry on average a larger fraction of the proton momentum than sea anti-quarks, hence top quarks are produced slightly more forward and top anti-quarks are produced slightly more centrally. The charge asymmetry is then conveniently defined as
where . The SM prediction for the charge asymmetry has been calculated at NLO QCD and including electroweak corrections to be [152, 153] at . The interest in precisely measuring charge asymmetries in top-quark pair production at the LHC has grown considerably after the CDF and D0 collaborations reported measurements of that were significantly larger than the SM predictions. However, most recent measurements at the Tevatron and calculations at NNLO QCD [154] were found to be in much better agreement. Determinations of the charge asymmetry at the LHC are shown in Table 1 and discussed in this section.
|
|||||||||||||||||||||||||||||||||||||||||||||||||||||||||||||||||||||||||||||||||||||||||||||||||||||||||||||||||||||||||||||||||||||||||
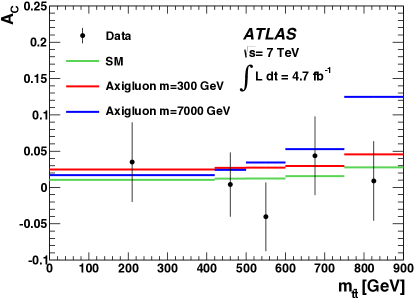
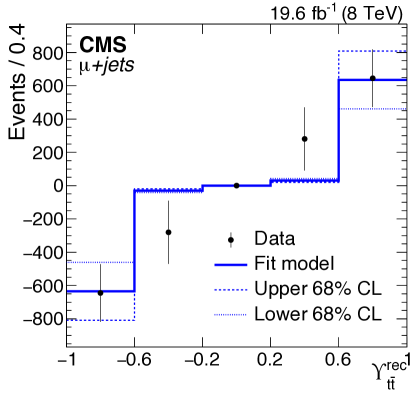
With the first of collision data both experiments measured the charge asymmetry in the single-lepton channel [155, 156] with similar statistical and systematic uncertainties and total uncertainties of . The system was reconstructed either with a kinematic fit or by choosing the best match of a boson candidate with a jet and, in order to be able to compare the resulting asymmetry with predictions, the measured distributions were extracted via iterative or regularized unfolding, accounting for acceptance and detector effects. At large values of possible new physics effects are expected to be enhanced, but within uncertainties no trend could be observed when measuring the asymmetry as a function of this variable. With the full dataset [157, 158] the uncertainty of the measurements was reduced and additional unfolded differential distributions were extracted as a function of , and the invariant mass of the system, or requiring a minimum velocity of the system along the beam axis. Results have been compared with SM expectations and BSM models such as colour-octet axigluons or a model featuring an effective axial-vector coupling of the gluon. Figure 30 illustrates the measurements of the charge asymmetry at in the single-lepton channel.
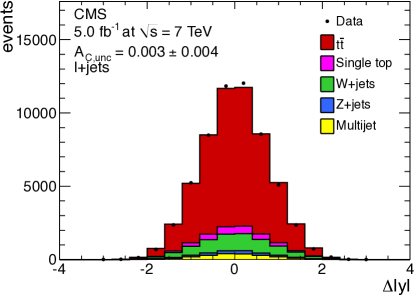
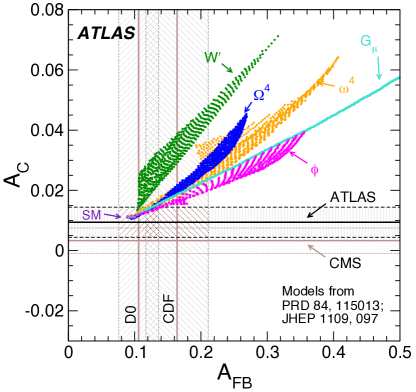
Measurements of the inclusive and differential charge asymmetry were also performed at with very similar techniques [161, 163]. The inclusive production charge asymmetry has been measured with uncertainties of , dominated by statistical uncertainties. CMS also provided an inclusive measurement in a fiducial region. The same dataset was re-analysed by CMS, with the alternative approach of using a template fit instead of unfolding [162]. More events with a lower purity were selected, while to reconstruct the kinematics and to determine the sample composition alternative methods were used. For the template construction a transformed variable was used, , that has the same asymmetry , but is bounded. The background composition after event selection was determined with a likelihood fit. The reconstructed distribution of was then fit to templates with symmetric and asymmetric components to extract the net asymmetry (Figure 31, left). Both measurement techniques, the Bayesian unfolding [163] and the template method [162] are dominated by statistical uncertainties and thus further improvements are to be expected with the upcoming larger datasets at the LHC at 13 and . It has to be noted, however, that the charge asymmetry at larger collision energies is expected to be reduced by approximately a factor of two between 7 and , as the fraction of -induced production in collisions decreases with centre-of-mass energy. The measurements of at the LHC and of at the Tevatron are compared to the expectation of the Standard Model and of several extensions in Figure 31 (right).
Extensions of the SM with heavy particles can predict a significantly enhanced charge asymmetry at high invariant masses at the LHC. Using reconstruction techniques specifically designed for the decay topology of highly boosted top quarks, ATLAS also determined the charge asymmetry in a fiducial region with and in bins of [166] finding no significant discrepancy compared to the SM expectation.
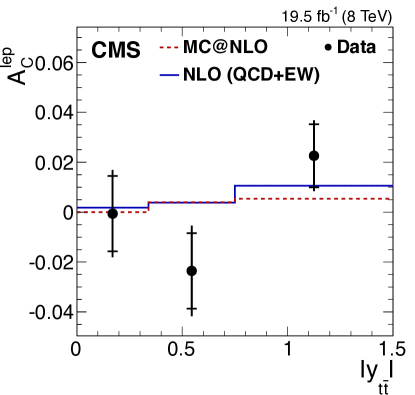
For the dilepton channel an additional asymmetry can be defined, , based on the difference in absolute rapidity of the two leptons, , as
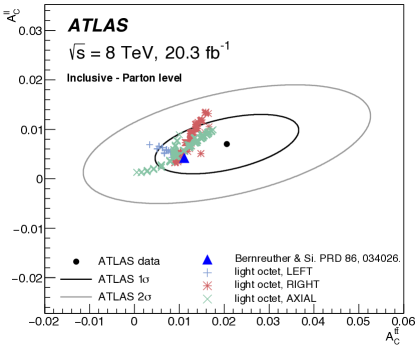
Since the directions of the leptons do not fully follow the direction of the parent top quarks and anti-quarks, the predicted value of is smaller than the prediction for . On the other hand, is based on the precise measurement of reconstructed lepton directions and does not rely on jet and quantities, so there is no need for a full event reconstruction. Both and are sensitive to possible new physics effects arising in production, with contributions from processes such as axigluon or and exchange typically predicting larger values of or , or both. With the [159, 160] and [164, 165] datasets CMS and ATLAS measured and , including unfolded distributions as a function of system quantities and simultaneous extraction of both inclusive parameters. A systematic uncertainty below is attained in this channel for the measurement of in a fiducial volume. All measurements are consistent with expectations within uncertainties (Figure 32).
7 Top-quark couplings
7.1 The vertex
The vertex is characterized by the electroweak structure. The polarization of the bosons produced in top-quark decays can be longitudinal, left- or right-handed. The angular distribution of the top-quark decay products, boosted into the boson rest frame, where , is given by
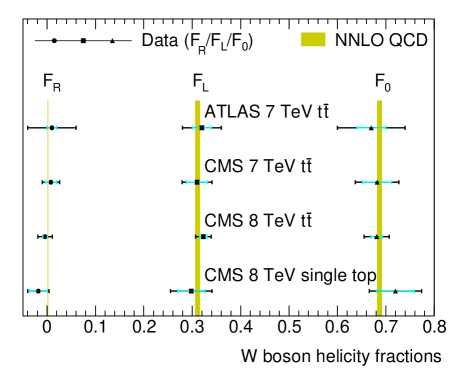
The helicity fractions , and are the fractions of events with a particular polarization. At leading order, their values are predicted to be approximately 70%, 30% and 0%, respectively, and have been calculated at NNLO QCD accuracy with uncertainties at the sub-percent level [167].
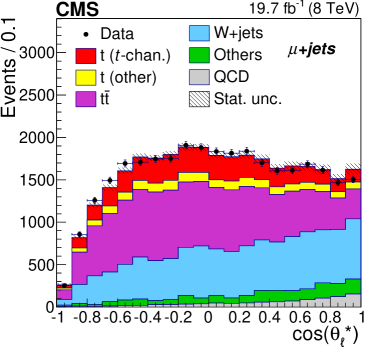
In the single-lepton channel a constrained kinematic fit is employed in order to improve the reconstruction of the boson rest frame. The helicity fractions are either directly extracted from template fits to the distribution or indirectly from the calculation of asymmetries based on unfolded spectra of the same variable. Fits are performed under the condition , or, in order to further decrease uncertainties, the additional assumption . Measurements have been performed with the dataset in topologies, including the dilepton channel [168] or considering also the hadronic top-quark decay [169]. CMS also performed measurements with the dataset in the single-lepton channel [170] and in a selection enhancing the single-top -channel contribution [171]. The modelling of the top-quark kinematics and the reconstruction of the rest frame have an important impact on the overall uncertainty on these measurements. Figure 33 illustrates one of the measurements and shows the summary of the measurements performed at the LHC Run-1.
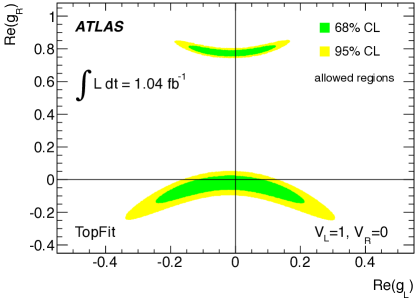
Results are compatible with the Standard Model expectations and are interpreted in terms of constraints on anomalous couplings [172, 173] using the most general dimension-six Lagrangian
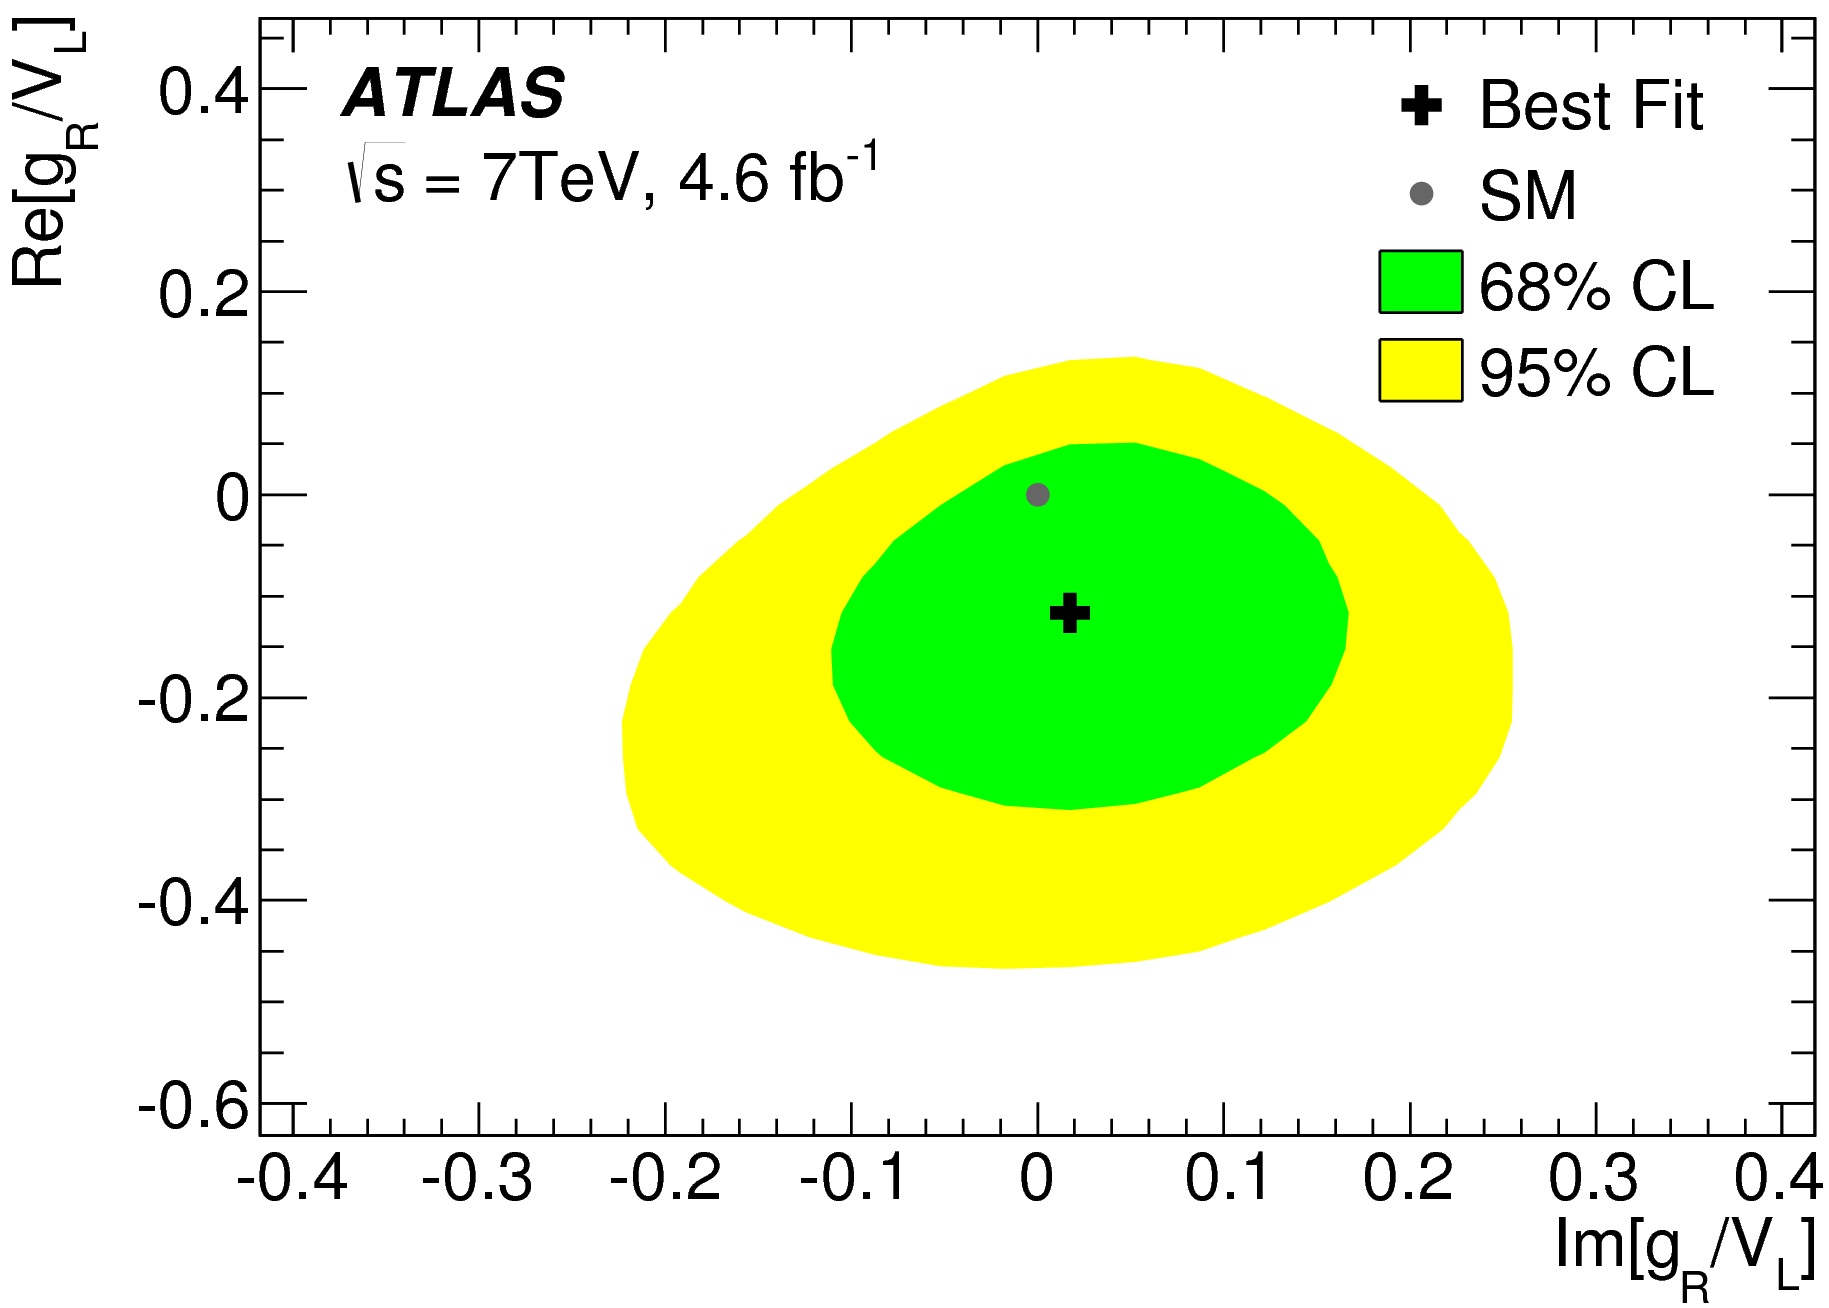
where are the projection operators. In the Standard Model and at tree level, the complex constants are and . Assuming and the real parts of and can be constrained as illustrated in Figure 34 (left). By measuring double differential angular distributions in single-top events, ATLAS [174] additionally set a limit on the imaginary part of , consistent with SM expectations (Figure 34, right).
The extraction of from measurements in the single-top channels has been discussed in Section 3. Indirect access to the value of can also be obtained by studying the branching fraction ratio in events, where . Under the assumption of a three-generation CKM matrix . With the full dilepton sample CMS extracted the -quark content from the distributions of the number of jets and -tagged jets [175]. Multijet control samples are used to determine the -tagging efficiency. Using the likelihood fit technique a measurement of was performed, with dominant systematic uncertainties mostly due to the -tagging efficiency. From this was extracted, corresponding to at 95% confidence level if is imposed. This result has been combined with the measurement of -channel single-top production to extract the total decay width , compatible with SM expectations.
7.2 Couplings to the photon
In the Standard Model the couplings of the top quark to the neutral electroweak vector bosons (), the photon and the boson, are described by the effective vertex [176]
where and are the outgoing momenta of the top quark and anti-quark, is the vector (axial vector) form factor and is related to the magnetic (electric) dipole form factor. For the photon, at tree level, and are related to the electric charge and the weak angle . The first step to study the structure of the vertex is to observe associated production. In the modelling of this process the interference between radiative top-quark production and decay processes needs to be taken into account, as photons can be emitted by any initial or final state charged particle. To avoid divergences, requirements are imposed on the transverse momenta of the produced photons, as well as on the invariant mass or distance of pairs of objects. The cross-section has been calculated at NLO accuracy in QCD [177].
Top-quark pair production in association with a photon has been observed by ATLAS with the dataset [178], requiring photons in the central detector region with a minimum energy in the transverse plane of and not close to a reconstructed lepton or jet. The cross-section measurement was performed in a fiducial phase space. The extraction of the cross-section proceeded via a binned likelihood template fit to a photon track-isolation variable (Figure 35, left). Signal and background template histograms were derived from simulation and data. With about selected events in the single-lepton channel the no-signal hypothesis was excluded with a significance of and the fiducial cross-section was measured with a total uncertainty of , dominated by the jet energy scale uncertainty, and is consistent with calculations using LO simulations rescaled to NLO.
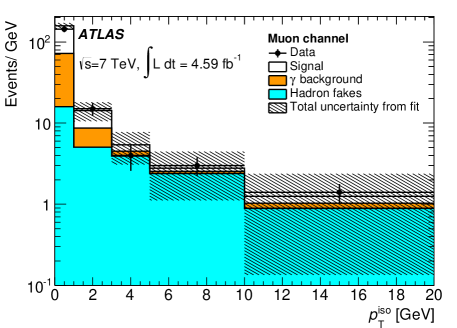
The measurement of the top-quark electric charge is related to the vertex. In the Standard Model the top quark is expected to have an electric charge of in units of the electron charge magnitude. Besides the standard decay with and the alternative hypothesis of a charge is conceivable, resulting in and . While the charge of the boson can be determined on an event-by-event basis from its leptonic decay, the -quark charge is not directly accessible from the reconstructed jet. In Ref. [179] a method to statistically assign a charge to the quark initiating a -jet was developed, based on a weighted average of the charge of the up to ten tracks with the highest transverse momentum associated to the jet. An algorithm was devised to optimize the efficiency and purity related to the pairing of the two identified -jets with the reconstructed lepton in the single-lepton channel, based on the invariant mass . The ATLAS collaboration measured the top-quark charge to be , excluding the alternative model by more than (Figure 35, right).
7.3 Couplings to the boson
Associated production of with a boson probes the - coupling. The production cross-section is simultaneously extracted with in channels with two or more leptons, since the two processes are experimentally intertwined. A variety of new physics models can alter the prediction of these cross-sections. With the data [180] and then in a first analysis of the dataset [181] CMS reported evidence of production, with significances of and respectively. But the luminosities and energies available at the LHC ought to allow this process to be clearly observed and more channels have been included and the analysis strategies refined.
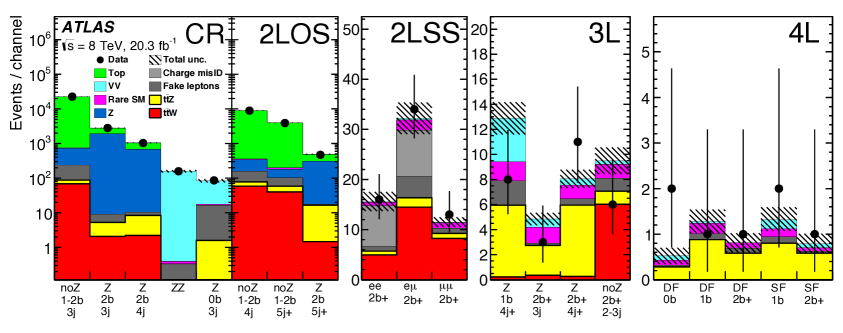
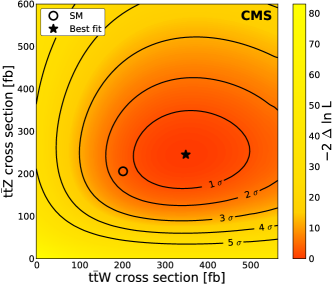
Using four signatures (opposite-sign dilepton, same-sign dilepton, trilepton, and tetralepton) and performing a simultaneous maximum likelihood fit to data, ATLAS extracted both cross-sections, and , with significances of and , respectively, over the background-only hypothesis [182]. Figure 36 shows the fit to the various signal and control regions. The sensitivity to the process comes from the tri- and tetralepton channels. Important irreducible Standard Model backgrounds that produce three or four leptons are diboson (, ) events, determined through fits in control regions, and associated single top-quark production (, ). The measured cross-section is fb, with uncertainties dominated by the statistical component.
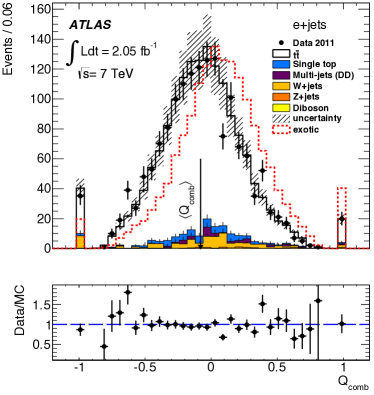
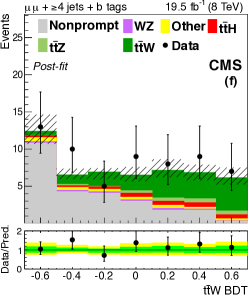
CMS also determined the cross-sections of the and processes at , with significances of and , respectively, using the same final states [183]. The analysis strategy aimed at reducing the statistical uncertainty by lowering the requirements on the quality of the reconstructed objects, at the expense of larger systematic uncertainties. A full reconstruction of pre-selected events was attempted, by matching the reconstructed objects in the detector to the decaying and bosons, and to the top quarks. A linear discriminant helped to determine the best permutation in matching jets and leptons. Signal was separated from background by means of several BDTs, one in each channel and jet multiplicity, exploiting the values of the linear discriminant and other kinematic quantities (Figure 37). The measured cross-section is fb. The result was used to place constraints on the axial and vector components of the - coupling and on dimension-six operators in an effective field theory framework.
7.4 Couplings to the Higgs boson
Due to the large mass of the top quark the Yukawa coupling to the Higgs boson is expected to be very large, , using current values for and [184]. While the effects of this coupling can be inferred indirectly from Higgs boson production through gluon fusion and Higgs decay to a pair of photons through loops, the associated production process will allow this coupling to be probed directly and unambiguously. However, the expected total cross-section of fb at [185] is significantly smaller than that of production, which is an important background.
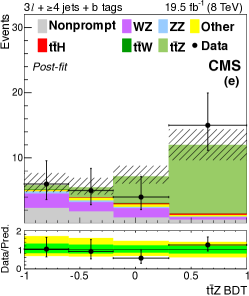
Due to the small production cross-section and the large backgrounds, no single decay mode of is expected to be sensitive in analyses using Run-1 data. Instead, several possible final states have been explored by ATLAS and CMS. They are broadly organized in three categories depending on the targeted Higgs boson decays: and leptons, the latter mainly targeting , and decays.
The , channel is characterized by very large combinatorial backgrounds, reconstruction inefficiencies and small signal-to-background ratios. An important non-reducible background is the associated production. CMS and ATLAS reported results in the single and dilepton channels [186, 187] with the Run-1 dataset, also exploiting a matrix-element technique. ATLAS also tackled the very challenging all-hadronic channel, which required dedicated data-driven techniques to estimate the multijet background [188]. On the other hand, the , channel is very clean but has a very small branching ratio. The measurements exploit a data-driven continuum background modelling, similar to that used in analyses. ATLAS and CMS reported results in channels with or without extra leptons produced by the top-quark pair [189, 190]. The remaining Higgs boson decays are collected in final states with multiple leptons, categorized according to the number and charge of electrons, muons and hadronically decaying tau leptons in order to optimize the signal-to-background ratio. CMS and ATLAS analysed Run-1 data also in this channel [190, 191]. Figure 38 shows data compared to expectation in the different channels.
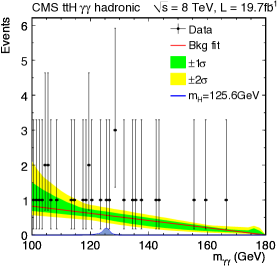
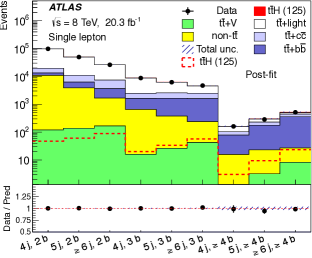
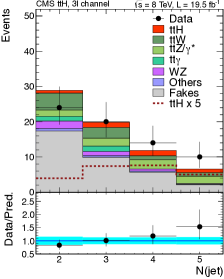
Both experiments have combined their measurements in the framework of a global Higgs couplings extraction [192, 193, 188]. Table 2 shows the results obtained in the different channels and in the combination.
|
|||||||||||||||||||||||||||||||||||||||||||||||||
The coupling of top quarks to Higgs bosons can also be probed in the single-top channel with an additional Higgs boson (). The process is expected to be suppressed by a factor of ten with respect to production, due to destructive interference between diagrams. Since effectively probes , it is interesting to also measure the process, which could be dramatically enhanced, if for instance . ATLAS did not observe such a large enhancement in the channel [189], and determined at 95% confidence level. CMS performed a dedicated analysis to search for -channel production in all Higgs decay modes. Depending on the assumed branching ratio, upper limits of to were obtained for exotic production [194], a factor of 3 to 5 larger than the expected cross-section in the case of .
The precise measurement of the top Yukawa coupling, as well as the couplings to other bosons, will continue to be an important goal for the LHC programme and is currently vigorously pursued by both collaborations.
8 Exotic top-quark decays
Top quarks predominantly decay via the charged weak current transition . The decays and are suppressed by the corresponding CKM matrix elements and expected to occur at the and level, respectively. With the large number of top quarks produced at the LHC it is interesting to study decays that are either highly suppressed in the Standard Model, like flavour-changing neutral current (FCNC) transitions, , , or , or require the presence of new particles such as a charged Higgs boson that appears in SUSY extensions, , or that would be a first indication for baryon number violation, , or lepton flavour violation, [195].
8.1 Search for top-quark decays via flavour-changing neutral currents
While top-quark decays to light down-type quarks are CKM-suppressed, the transition to an up-type quark is even more suppressed due to the GIM mechanism [196] with predicted branching fractions of , not directly accessible to the LHC experiments. Such decay modes could be significantly enhanced in extensions of the Standard Model, for instance due to the presence of additional virtual particles in the penguin loops. The effect of additional heavy particles on top-quark FCNCs can be described by dimension-six gauge-invariant operators. Searches for FCNC interactions involving top quarks have been performed at the LHC probing the , and, more recently, the and vertices.
At hadron colliders top-quark decays cannot be easily distinguished from other multijet signatures. Thus the search strategy for such anomalous couplings is to consider the production and decay , yielding a final state of exactly one semileptonically decaying top quark, with no extra jets. As substantial SM background is present after the event selection, neural-network based multivariate analyses have been performed by ATLAS using a partial dataset [197] and the complete dataset [198]. The most discriminating variables rely on the fact that top quarks produced through FCNC have low , the bosons produced in top-quark decays are boosted, and the produced top quark-to-antiquark ratio differs between FCNC and SM processes. The neural-network output as shown in Figure 39 (left) was then used in a binned likelihood fit to set limits on anomalous couplings, finding and , where are the multiplicative factors of the strong coupling constant in the tensor term of the effective Lagrangian and is related to the mass scale above which the effective theory breaks down, expressed in .
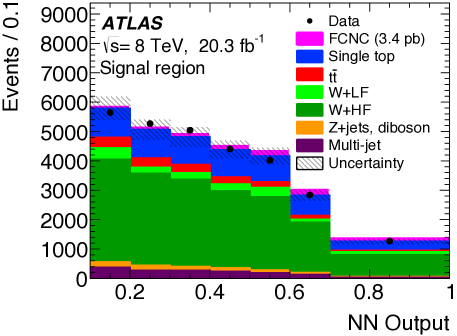
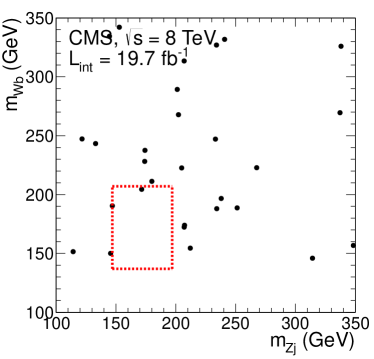
The top-quark decay to a boson and an up-type quark has also been searched for. Upper limits on the decay rate were obtained by ATLAS with a partial dataset of data [200] and by CMS with the full dataset [201], as well as by CMS with the complete Run-1 dataset [199] and by ATLAS with the full data [202]. Given the small expected branching fraction, searches are performed in the channel, where only one top quark decays through FCNC, . The final state considered features three leptons, which is particularly advantageous to reduce the Standard Model backgrounds, at the expense of a small signal efficiency. Because of the requirement of three leptons, low lepton thresholds could be used. For the reconstruction of the boson the pair of opposite-sign same-flavour leptons with closest to was chosen. At least two jets were required and the -tagging information was explicitly used when the size of the dataset allowed for it. Selected events were required to be kinematically compatible with the FCNC decay, for instance using the top-quark, boson and boson mass constraints to define a . Alternatively, all boson-jet combinations for the decay were examined after requiring a large sum of and of leptons and jets, and the top-quark pair with the largest azimuthal separation was chosen. Signal events were modelled with the TopReX [203], MadGraph or Protos [204] event generators. The contribution of events with fake leptons was estimated from data, considering the different possible combinations of lepton flavour and electric charge of three leptons, and extrapolating the measured values from side-band regions using the prediction from simulation. The -tagging information was used to reduce the backgrounds from Drell-Yan and diboson production. The FCNC signal and the and processes have different number of -jets and this was exploited to estimate the various contributions by measuring the number of events in different -tag multiplicities. Figure 39 (right) shows the two-dimensional signal region for the search by CMS.
The vertex can be conveniently probed by searching for single top-quark production in association with a photon. With the dataset CMS searched for this signature in final states with an isolated high- muon, at least one jet, but at most one -tagged jet, and missing transverse momentum [205]. The signal was simulated with Protos with a minimum requirement of for the associated photon. Events were classified as signal candidates if the reconstructed invariant mass was compatible with the top-quark mass. Several discriminating variables were found to be useful to reject the remaining background, dominated by the jets process, and were combined in BDTs, one for each of and , whose distribution were then fitted to extract the signal component (Figure 40, left). The of the photon candidate is the single most powerful variable. As no evidence for signal was found, limits on the anomalous couplings of were placed and translated into limits on the branching fractions . The measurement was also performed in a restricted phase space, corresponding to the acceptance of the detector, including a requirement on the transverse momentum and angular distances of the photon of , , and .
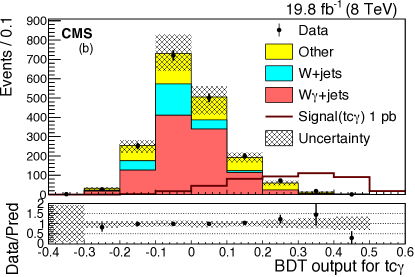
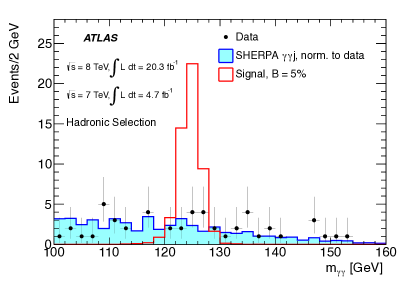
While the decay is also strongly suppressed in the Standard Model at the level of , extensions can predict large enhancements, up to for the branching fraction. With the large samples collected during Run-1, several searches have been performed for the process , classified according to the Higgs boson decay. For the channel the disadvantage of the small branching fraction is compensated by the very small backgrounds and good mass resolution of the photon pair (Figure 40, right). The searches were not sensitive to the difference between the and quark in the final state. ATLAS [206] and CMS [207] obtained upper limits on the branching fraction of and , respectively. CMS [207] and ATLAS [208] also considered decays in final states with at least three reconstructed leptons, including hadronically decaying tau leptons, targeting the Higgs boson decays to , and . Events were divided into mutually exclusive categories based on the number of leptons, number of , the number and invariant mass of opposite-sign same-flavour lepton pairs, and, in the case of CMS, the number of -tagged jets, and . These searches take advantage of a larger branching ratio of the Higgs boson decay, but do not feature a clearly-reconstructed Higgs-boson mass peak. CMS obtained an upper limit on the branching ratio of , and, combining this measurement with the analysis, [209], while ATLAS obtained upper limits of and , for and , respectively. Finally, the decay has also been considered, together with a combination of all channels by ATLAS [208]. The high multiplicity of -jets and kinematic differences between the signal and the abundant background, dominated by production, were exploited in the construction of a likelihood discriminant. Here also, no significant excess of events above the expectation from background was observed and upper limits on the branching fractions of and for and were extracted, respectively. The combination of all channels in ATLAS yielded upper limits of and for the two decay modes.
8.2 Search for top-quark decays to charged Higgs bosons
Additional Higgs particles are predicted in several extensions of the Standard Model, including a pair of charged Higgs bosons , as for instance in the two Higgs doublet models (2HDM) [210]. In such models a top-quark pair could decay through , if . In the MSSM scenario and for large values the charged Higgs boson is expected to preferentially decay via , effectively enhancing the tau lepton production in decays with respect to other leptons, while for , the decay mode is expected to dominate. ATLAS and CMS searched for both decay modes assuming charged Higgs boson masses of to for tauonic decays and to for hadronic decays. The limits are quoted assuming or , respectively.
Tauonic charged Higgs decays from top quarks have been searched for in Run-1 at 7 and . For the analyses three final states were considered [211], where discriminating variables could be identified exploiting the different topologies of signal and background. In the jets channel, leptons produced in tau lepton decays have to be discriminated against those stemming directly from a boson decay. Two useful variables are the invariant mass , where the choice of the -tagged jet is based on a kinematic constraint, and the transverse mass [212], which, on an event-by-event basis, represents a lower bound on the mass of the leptonically decaying charged boson ( or ), produced in the top-quark decay. In the channel the missing transverse momentum is expected to be larger for decays. Finally in the jets channel the transverse mass is related to the mass of the leptonically decaying charged boson, depending on the parent particle of the tau lepton (see Figure 41, left). A similar strategy was also pursued in [213] using a partial dataset. The ratio of events in decays, allowed for cancellations in the systematic uncertainties and a slight increase in the sensitivity [214]. The best sensitivities were achieved when considering the full dataset [215, 216]. No signal was observed in any of these searches, allowing upper limits to be set on the branching fraction of for a mass range of . The results were also interpreted in the context of different MSSM benchmark scenarios and used to set exclusion limits in the vs plane.
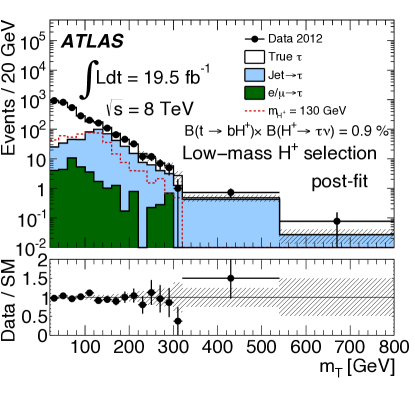
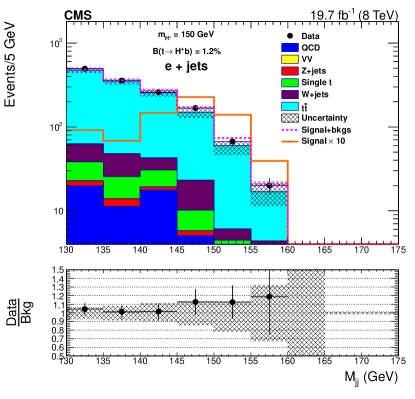
For small values of the decay is expected to dominate and dedicated searches have been conducted in this channel as well. The final state is identical to a single-lepton decay, with the difference that the two light jets come from a rather than a boson decay. ATLAS performed a search for this process with the dataset [218]. The system was fully reconstructed via a kinematic fit and the dijet invariant mass of the two jets assigned to the hadronic boson decay was used to search for deviations from the SM expectation. Upper limits on the branching fraction of were obtained for . With the larger dataset CMS repeated this analysis obtaining a better sensitivity, but data did not allow the upper limits to be improved [217] (Figure 41, right).
8.3 Search for baryon number violating top-quark decays
The existence of baryon number violating (BNV) interactions is a necessary condition for the baryon asymmetry of the Universe. While within the Standard Model the baryon number is conserved, in many extensions BNV interactions can occur. Thus far there is no experimental evidence for baryon number violation in the many processes where it has been searched for. From the proton lifetime, a stringent indirect limit on the branching fraction of can be placed [219]. However it has been pointed out that cancellations could allow a large enhancement [220], motivating a direct search for such decays.
If one of the top quarks in production undergoes a BNV transition, the final state of interest consists of one lepton, five quarks and no neutrino. Using the full dataset CMS did not find evidence of such decays and placed upper limits on +2 jets of 0.15% at the 95% confidence level [221]. The signal was modelled using MadGraph and the main background was SM production.
A summary of experimental limits on exotic top-quark decays is shown in Figure 42.
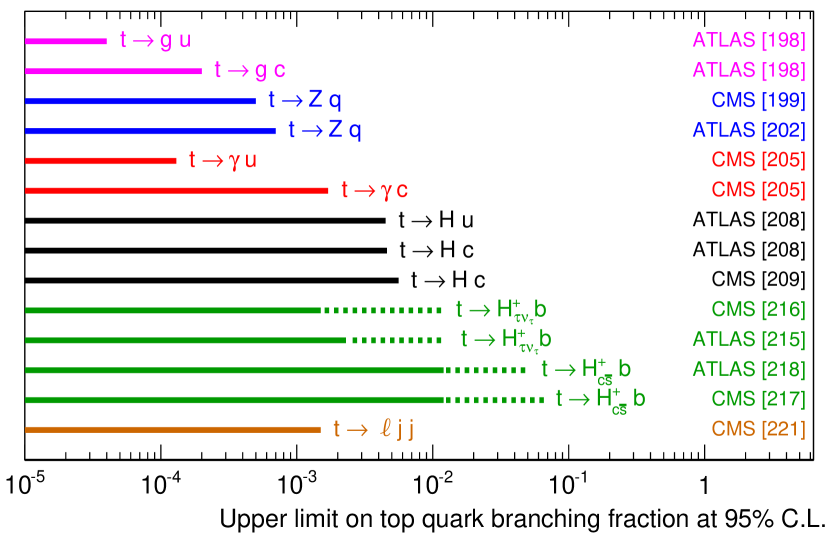
9 Conclusions and outlook
A comprehensive programme of top-quark physics has been established at the LHC with 7 and proton-proton collision data collected from 2010 to 2012, with most of the analyses finalized in time for this review.
Measurements of production provide stringent tests of perturbative QCD and have reached a good level of maturity with the large data samples available. The inclusive top-quark pair production is measured in the channel with an uncertainty of less than , a better precision than the prediction at NNLO, while measurements in several other channels complete the consistent picture. Differential measurements related to the top-quark or system, as well as to the number of additional jets, allow the validity of the calculations and the simulation programs employed at hadron colliders to be tested in more depth. The high- region is also explored, where top-quark decay products start to merge and boosted techniques improve the reconstruction efficiency. In general, data and predictions match well, with some discrepancies that arise from the choices of the parameters in the Monte-Carlo programs and the limited accuracy of the calculations at NLO. The large dataset of events has also been used to calibrate the -tagging algorithms [222, 223], to determine the shapes of quark-induced jets from top-quark decays [224], and to measure the pull angle distribution [225], describing the orientation of the radiation from jets originating from a boson in events and interpreted as a measurement of colour flow structure.
Single-top quark production has been observed at the LHC in the - and channels, and there is first evidence also of -channel production. The CKM matrix element has been determined with an uncertainty of and is compatible with unity. The large -channel dataset starts to be useful to also extract other quantities, related to the simulation of the production process or properties of the top quark.
Many measurements of the properties of the top quark have considerably reduced uncertainties compared to the pre-LHC era. The top-quark mass has been measured in several channels and also with innovative techniques. Overall, a total uncertainty of less than has been achieved for conventional methods, and an uncertainty of for direct measurements of the pole mass. The polarization of top quarks in and single-top events has been measured, and the spin-correlations established with uncertainty. Motivated also by initial discrepancies found at the Tevatron, an extensive set of measurements has been carried out to determine the charge asymmetry. The results are compatible with both the Standard Model prediction and zero asymmetry.
Associated production of top-quark pairs with additional bosons or quarks have smaller production cross-sections and start to become accessible with the Run-1 dataset. Production of , and have all been observed, while upper limits have been placed on and . Understanding additional heavy-flavour production is important, for instance as a background to , and is therefore a matter of detailed study. Many of these measurements represent the first step towards the determination of the top-quark couplings, however a larger dataset will be needed to start being sensitive to modifications that might enter due to BSM physics.
Searches for exotic top-quark decays are limited by the statistical power of the datasets collected. Flavour-changing neutral currents, involving transitions with a , , or boson have been searched for, as well as decays to charged Higgs, or decays forbidden by baryon number conservation. No evidence of any of these processes has been found and thus improved limits could be established.
LHC Run-2 has started in 2015 with a collision energy of , targeting an integrated luminosity of about by the end of 2018, corresponding to one order of magnitude more top-quark events than those collected so far. First results with this new dataset are emerging [226] and eventually the larger dataset will give access to yet another new realm of precision. With the new data, and further progress in experimental and theoretical methods, measurements will reach unprecedented precision, and top quarks will become even more powerful probes for new physics searches.
Ultimately, after the high-luminosity upgrade of the LHC, the experiments are expected to collect of collisions at a centre-of-mass energy of . The sensitivity of several top-quark measurements has been estimated under these conditions [227, 228]. The detectors will need to be adapted accordingly in order to cope with the increased occupancy, levels of radiation and increased amount of collisions per bunch crossing. Millions of top quarks will be produced with very large and therefore techniques to distinguish such top-jets from lighter quark-induced jets will become more and more important. Techniques such as those described in Ref. [229], like the HEPTopTagger, shower deconstruction, or taggers using substructure variables, will be essential in order to recover efficiencies at high top-quark transverse momentum and enhance the sensitivity for new physics.
More than twenty years after its discovery, top-quark physics has only recently entered the precision era. With millions of top-quark events the production cross-sections, the intrinsic properties and decay mechanisms have been studied in detail. If there is a connection between physics beyond the Standard Model and the top quark, this has so far remained hidden. With higher collision energies, improved detectors, refined reconstruction techniques and much larger datasets many areas of top physics will reach unprecedented levels of precision, allowing to perhaps uncover new physics at play.
Acknowledgements
The authors gratefully acknowledge Maria Aldaya, Roberto Chierici, Maria José Costa, Pedro Ferreira da Silva, Andrea Giammanco, Richard Hawkings, Alison Lister, Mark Owen, and Efe Yazgan for their comments and suggestions to the manuscript.
The work of M.C. is funded by the European Research Council under the European Union’s Seventh Framework Programme ERC Grant Agreement n. 617185.
References
References
- [1] Abe F et al. (CDF Collaboration) 1995 Phys. Rev. Lett. 74 2626 (Preprint hep-ex/9503002)
- [2] Abachi S et al. (D0 Collaboration) 1995 Phys. Rev. Lett. 74 2632 (Preprint hep-ex/9503003)
- [3] Evans L and Bryant P 2008 JINST 3 S08001
- [4] ATLAS Collaboration 2012 Phys. Lett. B716 1 (Preprint 1207.7214)
- [5] CMS Collaboration 2012 Phys. Lett. B716 30 (Preprint 1207.7235)
- [6] Boos E and Dudko L 2012 Int. J. Mod. Phys. A27 1230026 (Preprint 1211.7146)
- [7] Del Duca V and Laenen E 2015 Int. J. Mod. Phys. A30 1530063 (Preprint 1510.06690)
- [8] Déliot F, Hadley N, Parke S and Schwarz T 2014 Ann. Rev. Nucl. Part. Sci. 64 363
- [9] Gerber C E and Vellidis C 2015 Int. J. Mod. Phys. A30 1541005
- [10] Boos E, Brandt O, Denisov D, Denisov S and Grannis P 2015 Phys. Usp. 58 1133 (Preprint 1509.03325)
- [11] Cortiana G 2016 Rev. Phys. 1 60 (Preprint 1510.04483)
- [12] Giammanco A 2016 Rev. Phys. 1 1 (Preprint 1511.06748)
- [13] Aguilar-Saavedra J A, Amidei D, Juste A and Pérez-Victoria M 2015 Rev. Mod. Phys. 87 421 (Preprint 1406.1798)
- [14] Cristinziani M 2015 Top-quark production measurements 27th International Symposium on Lepton Photon Interactions at High Energy, Ljubljana, Slovenia (Preprint 1511.04200)
- [15] Meyer A B 2015 Top Quark Properties 27th International Symposium on Lepton Photon Interactions at High Energy, Ljubljana, Slovenia (Preprint 1511.07172)
- [16] Schilling F P 2012 Int. J. Mod. Phys. A27 1230016 (Preprint 1206.4484)
- [17] Chierici R 2014 Riv. Nuovo Cim. 37 47
- [18] Kröninger K, Meyer A B and Uwer P 2015 Top-Quark Physics at the LHC The Large Hadron Collider: Harvest of Run 1 p 259 (Preprint 1506.02800)
- [19] Hawkings R 2015 C. R. Physique 16 424
- [20] ATLAS Collaboration 2008 JINST 3 S08003
- [21] CMS Collaboration 2008 JINST 3 S08004
- [22] Alves Jr A A et al. (LHCb Collaboration) 2008 JINST 3 S08005
- [23] Beneke M, Falgari P, Klein S and Schwinn C 2012 Nucl. Phys. B855 695 (Preprint 1109.1536)
- [24] Cacciari M, Czakon M, Mangano M, Mitov A and Nason P 2012 Phys. Lett. B710 612 (Preprint 1111.5869)
- [25] Bärnreuther P, Czakon M and Mitov A 2012 Phys. Rev. Lett. 109 132001 (Preprint 1204.5201)
- [26] Czakon M and Mitov A 2012 JHEP 12 054 (Preprint 1207.0236)
- [27] Czakon M and Mitov A 2013 JHEP 01 080 (Preprint 1210.6832)
- [28] Czakon M, Fiedler P and Mitov A 2013 Phys. Rev. Lett. 110 252004 (Preprint 1303.6254)
- [29] CMS Collaboration 2011 Phys. Lett. B695 424 (Preprint 1010.5994)
- [30] ATLAS Collaboration 2011 Eur. Phys. J. C71 1577 (Preprint 1012.1792)
- [31] ATLAS Collaboration 2012 Phys. Lett. B707 459 (Preprint 1108.3699)
- [32] CMS Collaboration 2011 JHEP 07 049 (Preprint 1105.5661)
- [33] ATLAS Collaboration 2012 Phys. Lett. B711 244 (Preprint 1201.1889)
- [34] CMS Collaboration 2011 Eur. Phys. J. C71 1721 (Preprint 1106.0902)
- [35] CMS Collaboration 2011 Phys. Rev. D84 092004 (Preprint 1108.3773)
- [36] ATLAS Collaboration 2012 JHEP 05 059 (Preprint 1202.4892)
- [37] CMS Collaboration 2012 JHEP 11 067 (Preprint 1208.2671)
- [38] CMS Collaboration 2013 Phys. Lett. B720 83 (Preprint 1212.6682)
- [39] CMS Collaboration 2014 JHEP 02 024 , Erratum: JHEP 02 102 (Preprint 1312.7582)
- [40] ATLAS Collaboration 2014 Eur. Phys. J. C74 3109 (Preprint 1406.5375)
- [41] CMS Collaboration 2016 JHEP 08 029 (Preprint 1603.02303)
- [42] CMS Collaboration 2014 Phys. Lett. B728 496 , Corrigendum: Phys. Lett. B738 526 (Preprint 1307.1907)
- [43] ATLAS Collaboration 2015 Phys. Rev. D91 052005 (Preprint 1407.0573)
- [44] ATLAS Collaboration 2015 Phys. Rev. D91 112013 (Preprint 1504.04251)
- [45] CMS Collaboration 2016 Measurements of the production cross section in lepton+jets final states in collisions at and ratio of 8 to cross sections (Preprint 1602.09024)
- [46] CMS Collaboration 2012 Phys. Rev. D85 112007 (Preprint 1203.6810)
- [47] ATLAS Collaboration 2012 Phys. Lett. B717 89 (Preprint 1205.2067)
- [48] CMS Collaboration 2014 Phys. Lett. B739 23 (Preprint 1407.6643)
- [49] ATLAS Collaboration 2015 Phys. Rev. D92 072005 (Preprint 1506.05074)
- [50] ATLAS Collaboration 2013 Eur. Phys. J. C73 2328 (Preprint 1211.7205)
- [51] CMS Collaboration 2013 Eur. Phys. J. C73 2386 (Preprint 1301.5755)
- [52] CMS Collaboration 2013 JHEP 05 065 (Preprint 1302.0508)
- [53] CMS Collaboration 2016 Eur. Phys. J. C76 128 (Preprint 1509.06076)
- [54] Dittmaier S, Uwer P and Weinzierl S 2007 Phys. Rev. Lett. 98 262002 (Preprint hep-ph/0703120)
- [55] Bevilacqua G, Czakon M, Papadopoulos C G and Worek M 2011 Phys. Rev. D84 114017 (Preprint 1108.2851)
- [56] ATLAS Collaboration 2012 Eur. Phys. J. C72 2043 (Preprint 1203.5015)
- [57] CMS Collaboration 2014 Eur. Phys. J. C74 3014 , Erratum: 2015 Eur. Phys J. C75 216 (Preprint 1404.3171)
- [58] CMS Collaboration 2016 Eur. Phys. J. C76 379 (Preprint 1510.03072)
- [59] Kersevan B P and Richter-Was E 2013 Comput. Phys. Commun. 184 919 (Preprint hep-ph/0405247)
- [60] Sjostrand T, Mrenna S and Skands P Z 2006 JHEP 05 026 (Preprint hep-ph/0603175)
- [61] Alwall J, Herquet M, Maltoni F, Mattelaer O and Stelzer T 2011 JHEP 06 128 (Preprint 1106.0522)
- [62] ATLAS Collaboration 2015 JHEP 01 020 (Preprint 1407.0891)
- [63] Frixione S and Webber B R 2002 JHEP 06 029 (Preprint hep-ph/0204244)
- [64] Corcella G et al. 2001 JHEP 01 010 (Preprint hep-ph/0011363)
- [65] Mangano M L et al. 2003 JHEP 07 001 (Preprint hep-ph/0206293)
- [66] Nason P 2004 JHEP 11 040 (Preprint hep-ph/0409146)
- [67] CMS Collaboration 2015 Phys. Lett. B746 132 (Preprint 1411.5621)
- [68] ATLAS Collaboration 2014 Phys. Rev. D89 072012 (Preprint 1304.6386)
- [69] ATLAS Collaboration 2016 Eur. Phys. J. C76 11 (Preprint 1508.06868)
- [70] Sjostrand T, Mrenna S and Skands P Z 2008 Comput. Phys. Commun. 178 852 (Preprint 0710.3820)
- [71] Barger V D, Stange A L and Phillips R J N 1991 Phys. Rev. D44 1987
- [72] Barger V, Keung W Y and Yencho B 2010 Phys. Lett. B687 70 (Preprint 1001.0221)
- [73] Bevilacqua G and Worek M 2012 JHEP 07 111 (Preprint 1206.3064)
- [74] CMS Collaboration 2014 JHEP 01 163 , Erratum: 2015 JHEP 01 014 (Preprint 1311.6736)
- [75] ATLAS Collaboration 2015 JHEP 10 150 (Preprint 1504.04605)
- [76] CMS Collaboration 2014 JHEP 11 154 (Preprint 1409.7339)
- [77] ATLAS Collaboration 2015 JHEP 08 105 (Preprint 1505.04306)
- [78] ATLAS Collaboration 2013 Eur. Phys. J. C73 2261 (Preprint 1207.5644)
- [79] Ahrens V, Ferroglia A, Neubert M, Pecjak B D and Yang L L 2010 JHEP 09 097 (Preprint 1003.5827)
- [80] Campbell J M and Ellis R K 1999 Phys. Rev. D60 113006 (Preprint hep-ph/9905386)
- [81] CMS Collaboration 2013 Eur. Phys. J. C73 2339 (Preprint 1211.2220)
- [82] ATLAS Collaboration 2014 Phys. Rev. D90 072004 (Preprint 1407.0371)
- [83] Aaron F D et al. (H1 and ZEUS Collaborations) 2010 JHEP 01 109 (Preprint 0911.0884)
- [84] ATLAS Collaboration 2015 JHEP 06 100 (Preprint 1502.05923)
- [85] CMS Collaboration 2015 Eur. Phys. J. C75 542 (Preprint 1505.04480)
- [86] Li H T, Li C S, Shao D Y, Yang L L and Zhu H X 2013 Phys. Rev. D88 074004 (Preprint 1307.2464)
- [87] ATLAS Collaboration 2015 Measurements of top-quark pair differential cross-sections in the lepton+jets channel in collisions at using the ATLAS detector (Preprint 1511.04716)
- [88] ATLAS Collaboration 2016 Phys. Rev. D93 032009 (Preprint 1510.03818)
- [89] Ball R D et al. (NNPDF Collaboration) 2015 JHEP 04 040 (Preprint 1410.8849)
- [90] Czakon M, Heymes D and Mitov A 2016 Phys. Rev. Lett. 116 082003 (Preprint 1511.00549)
- [91] Schätzel S 2015 Eur. Phys. J. C75 415 (Preprint 1403.5176)
- [92] CMS Collaboration 2016 Measurement of the integrated and differential production cross sections for high- top quarks in collisions at (Preprint 1605.00116)
- [93] Aaij R et al. (LHCb Collaboration) 2015 Phys. Rev. Lett. 115 112001 (Preprint 1506.00903)
- [94] CMS Collaboration 2011 Phys. Rev. Lett. 107 091802 (Preprint 1106.3052)
- [95] Kidonakis N 2011 Phys. Rev. D83 091503(R) (Preprint 1103.2792)
- [96] ATLAS Collaboration 2014 Phys. Rev. D90 112006 (Preprint 1406.7844)
- [97] CMS Collaboration 2014 JHEP 06 090 (Preprint 1403.7366)
- [98] ATLAS Collaboration 2012 Phys. Lett. B717 330 (Preprint 1205.3130)
- [99] CMS Collaboration 2012 JHEP 12 035 (Preprint 1209.4533)
- [100] Kidonakis N 2012 Differential and total cross sections for top pair and single top production Proceedings, 20th International Workshop on Deep-Inelastic Scattering and Related Subjects p 831 (Preprint 1205.3453)
- [101] Kidonakis N 2014 Top Quark Production Proceedings, Helmholtz International Summer School on Physics of Heavy Quarks and Hadrons (HQ 2013) p 139 (Preprint 1311.0283)
- [102] Frixione S, Laenen E, Motylinski P, White C and Webber B R 2008 JHEP 07 029 (Preprint 0805.3067)
- [103] Tait T M P 1999 Phys. Rev. D61 034001 (Preprint hep-ph/9909352)
- [104] Kidonakis N 2010 Phys. Rev. D82 054018 (Preprint 1005.4451)
- [105] ATLAS Collaboration 2012 Phys. Lett. B716 142 (Preprint 1205.5764)
- [106] CMS Collaboration 2014 Phys. Rev. Lett. 112 231802 (Preprint 1401.2942)
- [107] CMS Collaboration 2013 Phys. Rev. Lett. 110 022003 (Preprint 1209.3489)
- [108] ATLAS Collaboration 2016 JHEP 01 064 (Preprint 1510.03752)
- [109] Cascioli F, Kallweit S, Maierhöfer P and Pozzorini S 2014 Eur. Phys. J. C74 2783 (Preprint 1312.0546)
- [110] ATLAS Collaboration 2016 Phys. Lett. B756 228 (Preprint 1511.05980)
- [111] Smith M C and Willenbrock S 1996 Phys. Rev. D54 6696 (Preprint hep-ph/9604223)
- [112] Kidonakis N 2010 Phys. Rev. D81 054028 (Preprint 1001.5034)
- [113] ATLAS Collaboration 2015 Phys. Lett. B740 118 (Preprint 1410.0647)
- [114] CMS Collaboration 2016 JHEP 09 027 (Preprint 1603.02555)
- [115] ATLAS Collaboration 2012 Eur. Phys. J. C72 2046 (Preprint 1203.5755)
- [116] CMS Collaboration 2012 JHEP 12 105 (Preprint 1209.2319)
- [117] ATLAS Collaboration 2015 Eur. Phys. J. C75 330 (Preprint 1503.05427)
- [118] CMS Collaboration 2016 Phys. Rev. D93 072004 (Preprint 1509.04044)
- [119] CMS Collaboration 2012 Eur. Phys. J. C72 2202 (Preprint 1209.2393)
- [120] Biswas S, Melnikov K and Schulze M 2010 JHEP 08 048 (Preprint 1006.0910)
- [121] ATLAS Collaboration 2015 Eur. Phys. J. C75 158 (Preprint 1409.0832)
- [122] CMS Collaboration 2014 Eur. Phys. J. C74 2758 (Preprint 1307.4617)
- [123] ATLAS Collaboration 2014 Phys. Lett. B728 363 (Preprint 1310.6527)
- [124] CMS Collaboration 2012 JHEP 06 109 (Preprint 1204.2807)
- [125] ATLAS, CDF, CMS and D0 Collaborations 2014 First combination of Tevatron and LHC measurements of the top-quark mass (Preprint 1403.4427)
- [126] Abazov V M et al. (D0 Collaboration) 2014 Phys. Rev. Lett. 113 032002 (Preprint 1405.1756)
- [127] Abazov V M et al. (D0 Collaboration) 2015 Phys. Rev. D91 112003 (Preprint 1501.07912)
- [128] Tevatron Electroweak Working Group 2014 Combination of CDF and D0 results on the mass of the top quark using up to 9.7 fb-1 at the Tevatron (Preprint 1407.2682)
- [129] Marquard P, Smirnov A V, Smirnov V A and Steinhauser M 2015 Phys. Rev. Lett. 114 142002 (Preprint 1502.01030)
- [130] Beneke M, Marquard P, Nason P and Steinhauser M 2016 On the ultimate uncertainty of the top quark pole mass (Preprint 1605.03609)
- [131] Hoang A H 2014 The Top Mass: Interpretation and Theoretical Uncertainties 7th International Workshop on Top Quark Physics (TOP2014) Cannes, France (Preprint 1412.3649)
- [132] Moch S et al. 2014 High precision fundamental constants at the scale (Preprint 1405.4781)
- [133] Hoang A H, Jain A, Scimemi I and Stewart I W 2008 Phys. Rev. Lett. 101 151602 (Preprint 0803.4214)
- [134] CMS Collaboration 2013 Eur. Phys. J. C73 2494 (Preprint 1304.5783)
- [135] Alioli S, Fernandez P, Fuster J, Irles A, Moch S O, Uwer P and Vos M 2013 Eur. Phys. J. C73 2438 (Preprint 1303.6415)
- [136] ATLAS Collaboration 2015 JHEP 10 121 (Preprint 1507.01769)
- [137] Frixione S and Mitov A 2014 JHEP 09 012 (Preprint 1407.2763)
- [138] Agashe K, Franceschini R and Kim D 2013 Phys. Rev. D88 057701 (Preprint 1209.0772)
- [139] Kharchilava A 2000 Phys. Lett. B476 73 (Preprint hep-ph/9912320)
- [140] Hill C S, Incandela J R and Lamb J M 2005 Phys. Rev. D71 054029 (Preprint hep-ex/0501043)
- [141] CMS Collaboration 2016 Phys. Rev. D93 092006 (Preprint 1603.06536)
- [142] ATLAS Collaboration 2013 Phys. Rev. Lett. 111 232002 (Preprint 1307.6511)
- [143] CMS Collaboration 2014 Phys. Rev. Lett. 112 182001 (Preprint 1311.3924)
- [144] CMS Collaboration 2016 Phys. Rev. D93 052007 (Preprint 1601.01107)
- [145] CMS Collaboration 2016 JHEP 04 073 (Preprint 1511.02138)
- [146] ATLAS Collaboration 2012 Phys. Rev. Lett. 108 212001 (Preprint 1203.4081)
- [147] ATLAS Collaboration 2014 Phys. Rev. D90 112016 (Preprint 1407.4314)
- [148] ATLAS Collaboration 2016 Phys. Rev. D93 012002 (Preprint 1510.07478)
- [149] ATLAS Collaboration 2015 Phys. Rev. Lett. 114 142001 (Preprint 1412.4742)
- [150] CMS Collaboration 2016 Phys. Lett. B758 321 (Preprint 1511.06170)
- [151] Czakon M, Fiedler P and Mitov A 2015 Phys. Rev. Lett. 115 052001 (Preprint 1411.3007)
- [152] Kühn J H and Rodrigo G 2012 JHEP 01 063 (Preprint 1109.6830)
- [153] Bernreuther W and Si Z G 2012 Phys. Rev. D86 034026 (Preprint 1205.6580)
- [154] Czakon M, Fiedler P, Heymes D and Mitov A 2016 JHEP 05 034 (Preprint 1601.05375)
- [155] CMS Collaboration 2012 Phys. Lett. B709 28 (Preprint 1112.5100)
- [156] ATLAS Collaboration 2012 Eur. Phys. J. C72 2039 (Preprint 1203.4211)
- [157] CMS Collaboration 2012 Phys. Lett. B717 129 (Preprint 1207.0065)
- [158] ATLAS Collaboration 2014 JHEP 02 107 (Preprint 1311.6724)
- [159] CMS Collaboration 2014 JHEP 04 191 (Preprint 1402.3803)
- [160] ATLAS Collaboration 2015 JHEP 05 061 (Preprint 1501.07383)
- [161] CMS Collaboration 2016 Phys. Lett. B757 154 (Preprint 1507.03119)
- [162] CMS Collaboration 2016 Phys. Rev. D93 034014 (Preprint 1508.03862)
- [163] ATLAS Collaboration 2016 Eur. Phys. J. C76 87 (Preprint 1509.02358)
- [164] CMS Collaboration 2016 Phys. Lett. B760 365 (Preprint 1603.06221)
- [165] ATLAS Collaboration 2016 Phys. Rev. D94 032006 (Preprint 1604.05538)
- [166] ATLAS Collaboration 2016 Phys. Lett. B756 52 (Preprint 1512.06092)
- [167] Czarnecki A, Körner J G and Piclum J H 2010 Phys. Rev. D81 111503(R) (Preprint 1005.2625)
- [168] ATLAS Collaboration 2012 JHEP 06 088 (Preprint 1205.2484)
- [169] CMS Collaboration 2013 JHEP 10 167 (Preprint 1308.3879)
- [170] CMS Collaboration 2016 Measurement of the boson helicity fractions in the decays of top quark pairs to lepton+jets final states produced in collisions at (Preprint 1605.09047)
- [171] CMS Collaboration 2015 JHEP 01 053 (Preprint 1410.1154)
- [172] Aguilar-Saavedra J A 2009 Nucl. Phys. B812 181 (Preprint 0811.3842)
- [173] Aguilar-Saavedra J A 2009 Nucl. Phys. B821 215 (Preprint 0904.2387)
- [174] ATLAS Collaboration 2016 JHEP 04 023 (Preprint 1510.03764)
- [175] CMS Collaboration 2014 Phys. Lett. B736 33 (Preprint 1404.2292)
- [176] Hollik W, Illana J I, Rigolin S, Schappacher C and Stockinger D 1999 Nucl. Phys. B551 3 , Erratum: Nucl. Phys. B557 407 (Preprint hep-ph/9812298)
- [177] Melnikov K, Schulze M and Scharf A 2011 Phys. Rev. D83 074013 (Preprint 1102.1967)
- [178] ATLAS Collaboration 2015 Phys. Rev. D91 072007 (Preprint 1502.00586)
- [179] ATLAS Collaboration 2013 JHEP 11 031 (Preprint 1307.4568)
- [180] CMS Collaboration 2013 Phys. Rev. Lett. 110 172002 (Preprint 1303.3239)
- [181] CMS Collaboration 2014 Eur. Phys. J. C74 3060 (Preprint 1406.7830)
- [182] ATLAS Collaboration 2015 JHEP 11 172 (Preprint 1509.05276)
- [183] CMS Collaboration 2016 JHEP 01 096 (Preprint 1510.01131)
- [184] Olive K A et al. (Particle Data Group) 2014 Chin. Phys. C38 090001
- [185] Dittmaier S et al. (LHC Higgs Cross Section Working Group) 2011 Handbook of LHC Higgs Cross Sections: 1. Inclusive Observables (Preprint 1101.0593)
- [186] CMS Collaboration 2015 Eur. Phys. J. C75 251 (Preprint 1502.02485)
- [187] ATLAS Collaboration 2015 Eur. Phys. J. C75 349 (Preprint 1503.05066)
- [188] ATLAS Collaboration 2016 JHEP 05 160 (Preprint 1604.03812)
- [189] ATLAS Collaboration 2015 Phys. Lett. B740 222 (Preprint 1409.3122)
- [190] CMS Collaboration 2014 JHEP 09 087 , Erratum: JHEP 10 106 (Preprint 1408.1682)
- [191] ATLAS Collaboration 2015 Phys. Lett. B749 519 (Preprint 1506.05988)
- [192] CMS Collaboration 2015 Eur. Phys. J. C75 212 (Preprint 1412.8662)
- [193] ATLAS Collaboration 2016 Eur. Phys. J. C76 6 (Preprint 1507.04548)
- [194] CMS Collaboration 2016 JHEP 06 177 (Preprint 1509.08159)
- [195] Davidson S, Mangano M L, Perries S and Sordini V 2015 Eur. Phys. J. C75 450 (Preprint 1507.07163)
- [196] Glashow S L, Iliopoulos J and Maiani L 1970 Phys. Rev. D2 1285
- [197] ATLAS Collaboration 2012 Phys. Lett. B712 351 (Preprint 1203.0529)
- [198] ATLAS Collaboration 2016 Eur. Phys. J. C76 55 (Preprint 1509.00294)
- [199] CMS Collaboration 2014 Phys. Rev. Lett. 112 171802 (Preprint 1312.4194)
- [200] ATLAS Collaboration 2012 JHEP 09 139 (Preprint 1206.0257)
- [201] CMS Collaboration 2013 Phys. Lett. B718 1252 (Preprint 1208.0957)
- [202] ATLAS Collaboration 2016 Eur. Phys. J. C76 12 (Preprint 1508.05796)
- [203] Slabospitsky S R and Sonnenschein L 2002 Comput. Phys. Commun. 148 87 (Preprint hep-ph/0201292)
- [204] Aguilar-Saavedra J A 2010 Nucl. Phys. B837 122 (Preprint 1003.3173)
- [205] CMS Collaboration 2016 JHEP 04 035 (Preprint 1511.03951)
- [206] ATLAS Collaboration 2014 JHEP 06 008 (Preprint 1403.6293)
- [207] CMS Collaboration 2014 Phys. Rev. D90 032006 (Preprint 1404.5801)
- [208] ATLAS Collaboration 2015 JHEP 12 061 (Preprint 1509.06047)
- [209] CMS Collaboration 2014 Phys. Rev. D90 112013 (Preprint 1410.2751)
- [210] Lee T D 1973 Phys. Rev. D8 1226
- [211] ATLAS Collaboration 2012 JHEP 06 039 (Preprint 1204.2760)
- [212] Gross E and Vitells O 2010 Phys. Rev. D81 055010 (Preprint 0907.5367)
- [213] CMS Collaboration 2012 JHEP 07 143 (Preprint 1205.5736)
- [214] ATLAS Collaboration 2013 JHEP 03 076 (Preprint 1212.3572)
- [215] ATLAS Collaboration 2015 JHEP 03 088 (Preprint 1412.6663)
- [216] CMS Collaboration 2015 JHEP 11 018 (Preprint 1508.07774)
- [217] CMS Collaboration 2015 JHEP 12 178 (Preprint 1510.04252)
- [218] ATLAS Collaboration 2013 Eur. Phys. J. C73 2465 (Preprint 1302.3694)
- [219] Hou W S, Nagashima M and Soddu A 2005 Phys. Rev. D72 095001 (Preprint hep-ph/0509006)
- [220] Dong Z, Durieux G, Gerard J M, Han T and Maltoni F 2012 Phys. Rev. D85 016006 , Publisher’s Note: Phys. Rev. D85 039907 (Preprint 1107.3805)
- [221] CMS Collaboration 2014 Phys. Lett. B731 173 (Preprint 1310.1618)
- [222] CMS Collaboration 2013 JINST 8 P04013 (Preprint 1211.4462)
- [223] ATLAS Collaboration 2016 JINST 11 P04008 (Preprint 1512.01094)
- [224] ATLAS Collaboration 2013 Eur. Phys. J. C73 2676 (Preprint 1307.5749)
- [225] ATLAS Collaboration 2015 Phys. Lett. B750 475 (Preprint 1506.05629)
- [226] CMS Collaboration 2016 Phys. Rev. Lett. 116 052002 (Preprint 1510.05302)
- [227] Agashe K et al. (Top Quark Working Group) 2013 Working Group Report: Top Quark Community Summer Study 2013: Snowmass on the Mississippi Minneapolis, MN, USA (Preprint 1311.2028)
- [228] CMS Collaboration 2013 Projections for top FCNC searches in at the LHC CMS-PAS-FTR-13-016 URL http://inspirehep.net/record/1260895
- [229] ATLAS Collaboration 2016 JHEP 06 093 (Preprint 1603.03127)