V4743 Sgr, a magnetic nova?111 based on observations made with the Southern African Large Telescope (SALT).
Abstract
Two XMM Newton observations of Nova V4743 Sgr (Nova Sgr 2002) were performed shortly after it returned to quiescence, 2 and 3.5 years after the explosion. The X-ray light curves revealed a modulation with a frequency of 0.75 mHz, indicating that V4743 Sgr is most probably an intermediate polar (IP). The X-ray spectra have characteristics in common with known IPs, with a hard thermal plasma component that can be fitted only assuming a partially covering absorber. In 2004 the X-ray spectrum had also a supersoft blackbody-like component, whose temperature was close to that of the white dwarf (WD) in the supersoft X-ray phase following the outburst, but with flux by at least two orders of magnitude lower. In quiescent IPs, a soft X-ray flux component originates at times in the polar regions irradiated by an accretion column, but the supersoft component of V4743 Sgr disappeared in 2006, indicating a possible origin different from accretion. We suggest that it may have been due to an atmospheric temperature gradient on the WD surface, or to continuing localized thermonuclear burning at the bottom of the envelope, before complete turn-off. An optical spectrum obtained with SALT 11.5 years after the outburst showed a prominent He II 4686 line and the Bowen blend, which reveal a very hot region, but with peak temperature shifted to the ultraviolet (UV) range. V4743 Sgr is the third post-outburst nova and IP candidate showing a low-luminosity supersoft component in the X-ray flux a few years after the outburst.
keywords:
(stars:) novae, cataclysmic variables — stars: individual: V4743 Sgr1 Introduction
Nova V4743 Sgr was discovered by Haseda et al. (2002) in outburst in 2002 September 20 close to the 5th magnitude. Kato et al. (2002) classified this object as an Fe II-class nova and found that the full width at half maximum (FWHM) of the H emission was 2400 km s-1. t2 and t3 times (times needed to fade by 2 and 3 magnitudes from maximum) for V4743 Sgr are 6 and 12 days, respectively, typical of a very fast nova (Strope et al., 2010). Even if the optical light curve decay was fast, the X-ray light curve developed relatively slowly – the nuclear-burning phase lasted at least for 1.5 years after the outburst (Rauch et al., 2010), unlike, for instance, the recurrent novae (RNe), which seem to burn the remaining hydrogen very rapidly after the outburst.
V4743 Sgr was the first nova regularly monitored with X-ray gratings in outburst (Starrfield et al., 2003; Ness et al., 2003; Leibowitz et al., 2006; Rauch et al., 2010). Five aditional X-ray grating observations were obtained between 2002 March and 2004 April with Chandra and XMM Newton and four of them coincided with the supersoft X-ray source (SSS) phase of the nova, when the ejecta became transparent to X-rays from the central source. During the SSS phase the nova was the brightest supersoft X-ray source in the sky and had a continuous spectrum with deep absorption features of O, Ni, and C (Ness et al., 2003). Rauch et al. (2010) analysed the grating spectra of V4743 Sgr using a Non-Local Thermal Equilibrium (NLTE) Atmosphere Model (Rauch & Deetjen, 2003) and found that the nova reached its highest effective temperature of 740 000 K around 2003 April and remained hot for at least 5 months. With such a peak temperature the WD is 1.1 – 1.2 M☉. van Rossum (2012) found a lower value of the effective temperature – 550 000 K, applying a wind-type expanding NLTE model (van Rossum & Ness, 2010). The difference in the derived effective temperature is not only due to the applied models but also to the higher value of N(H) inferred by van Rossum (2012). Moreover, the model of van Rossum (2012) was developed with solar abundances, which are, however, not suitable for a WD atmosphere.
In addition to offering a view of the WD atmosphere and its composition, the long exposure times in the X-ray grating spectra allowed detection of intense X-ray variability. The nova was in fact very variable, both aperiodically and periodically. Ness et al. (2003) detected large-amplitude oscillations with a period of 1325 s (22 minutes) in the first half of their 25 ks Chandra exposure but soon after the count rate suddenly dropped to a very low value until the end of the exposure, and only emission lines were observed. Such a low state has never been observed in any of subsequent observations of V4743 Sgr and was probably caused by a temporary obscuration of the central X-ray continuum source by clumpy ejecta (Ness et al., 2013a). Leibowitz et al. (2006) analysed the periodic variability of the X-ray flux in the first two X-ray observations during the outburst, spaced two weeks apart and detected a combination of oscillations represented by a number of discrete frequencies lower than 1.7 mHz. At least five of these frequencies, including the one at 0.75 mHz, were present in both observations. The authors proposed that the 0.75 mHz frequency and its first harmonic in the power spectrum were related to the WD spin period while the other oscillations were due to non-radial pulsations of the WD. Dobrotka & Ness (2010) extended the study of the X-ray variability of V4743 Sgr, including three more observations of the nova in outburst, and the two quiescent exposures, proposed by us and discussed in this paper. These authors found that the 0.75 mHz feature in the power spectrum was due to different frequencies in outburst, but eventually in the quiescent observations only one frequency remained, which they attributed to the spin period of a magnetized WD in an intermediate polar (IP), following also a suggestion of Leibowitz et al. (2006). Optical observations also strongly support the IP scenario. Kang et al. (2006), Richards et al. (2005) and Wagner et al. (2005) presented measurements of the orbital period ( 6.7 h), and detected a much shorter period of 24 minutes, which seems to be the beat of the orbital period and the one observed in the X-rays.
From their infrared observations Nielbock & Schmidtobreick (2003) roughly estimated the distance to V4743 Sgr as 1200300 pc, however, the authors pointed out that this value should be taken with caution because of the uncertainties in the estimates of the interstellar extinction towards the nova. The authors also stressed that the maximum possible distance is 6 kpc. Vanlandingham et al. (2007) derived a distance of 3.90.3 kpc using the maximum-magnitude rate-of-decay (MMRD) relationship (della Valle & Livio, 1995).
In this paper we present the XMM Newton observations, proposed by us (PI Orio) and performed in quiescence 2 and 3.5 years after the nova explosion and the optical spectra of V4743 Sgr, obtained with the Southern African Large Telescope (SALT) 12 years after the outburst, revealing the evolution of the supersoft X-ray component and the expanding nova shell.
2 X-ray observations and data analysis
V4743 Sgr was observed with all the instruments onboard XMM Newton on September 30 2004 and with the European Photon Imaging Camera (EPIC), and the Reflection Grating Spectrometer (RGS 1 and RGS 2) on March 28 2006 (742 and 1286 days after the nova explosion, respectively). Here we focus mainly on the data of the EPIC Metal Oxide Semi-conductor (MOS) CCD arrays: MOS 1 and MOS 2. The RGS data had a very low signal-to-noise ratio and only the 2004 observation allowed to marginally detect several emission lines. The data of the EPIC pn camera were not suitable for the analysis, since the source was on a chip gap. The X-ray spectra were fitted with XSPEC v.12.8.2. The dates and exposure times of both X-ray and optical observations are presented in Table 1.
| Date and time | Instrument | Exposure (s) | Count rate (cnts s-1)/Mag.1 |
|---|---|---|---|
| 2004-09-30 18:28:25 | XMM Newton MOS1 | 22163 | |
| 2004-09-30 18:28:23 | XMM Newton MOS2 | 22168 | |
| 2004-09-30 18:27:28 | XMM Newton RGS1 | 21295 | |
| 2004-09-30 18:27:36 | XMM Newton RGS2 | 21295 | |
| 2004-09-30 18:36:34 | XMM Newton OM U | 4000 | |
| 2004-09-30 19:48:21 | XMM Newton OM B | 4000 | |
| 2004-09-30 21:00:09 | XMM Newton OM UVW1 | 3998 | |
| 2004-09-30 22:11:55 | XMM Newton OM UVM2 | 4181 | |
| 2004-09-30 23:26:56 | XMM Newton OM UVW2 | 4398 | |
| 2006-03-28 15:28:18 | XMM Newton MOS1 | 34164 | |
| 2006-03-28 15:28:18 | XMM Newton MOS2 | 34168 | |
| 2006-03-28 15:27:25 | XMM Newton RGS1 | 34418 | |
| 2006-03-28 15:27:29 | XMM Newton RGS2 | 34410 | |
| 2014-03-21 02:54:48 | SALT RSS2 | 1000 | |
| 2014-03-21 03:11:48 | SALT RSS | 1000 | |
| Notes.1 The mean count rate during the exposure for the X-ray observations and the mean magnitude for the XMM Newton OM optical monitor (OM) observations. The effective wavelengths of the XMM Newton OM filters are: U — 344 nm, B — 450 nm, UVW1 — 291 nm, UVM2 — 231 nm, UVW2 — 212 nm. 2Robert Stobie Spectrograph | |||
2.1 Spectral analysis
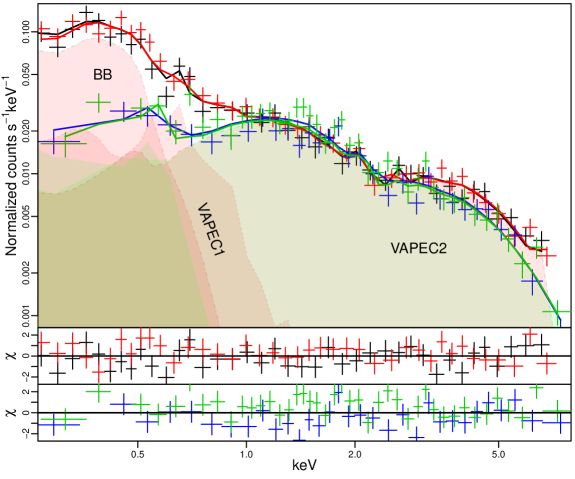
The background subtracted 0.2 – 10.0 keV spectra of V4743 Sgr together with the best-fitting models are presented in Figure 1. The 2004 data are plotted in black (MOS 1) and red (MOS 2) and the 2006 data in blue (MOS 1) and green (MOS 2). We first analysed the 2004 spectrum because of the higher count rate and found that the best-fitting model consists of a blackbody and two thermal plasma components affected by a partially covering absorber (PCFABS model in the XSPEC). Without the complex absorption it was impossible to fit the hard part of the spectra even increasing the temperature. We used the VAPEC model of thermal plasma emission in XSPEC, since it allows to constrain abundances of different elements and novae have a highly non-solar composition.
In order to compare our results with the outburst XMM Newton and Chandra X-ray spectra of V4743 Sgr studied in detail by Rauch et al. (2010) and van Rossum (2012) we attempted a fit of the supersoft component in the 2004 spectrum with the atmospheric model of Rauch et al. (2010). The atmospheric model that we used had the same abundances and as model B in Rauch et al. (2010).
The next step was to fit the 2006 data. From fig. 1 we see that major changes during one and a hlaf year between observations were in the softest region of the spectrum — the blackbody-like component was no longer measured in the 2006 observation, while the part of the spectrum above 1 keV was almost the same. The data quality did not allow us to fit the 2006 spectrum independently, so we tried a simultaneous fit of the 2004 and 2006 datasets applying the same model and setting the normalization of the blackbody component to zero. We also assumed that the interstellar absorption and the element abundances of the plasma are the same in both observations but let other parameters to vary freely. Although the variable opacity of the nova shell may contribute to the value of the interstellar absorption, we did not expect the absorption to increase, obscuring the soft emission in 2006.
The best fitting parameters of our models are summarised in Table 2. All the fits required an increased abundances of Si and S, but the spectra quality did not allow us to constrain their values. We also did not detect the 6.4 keV Fe K reflection line at a significant level.
Rauch et al. (2010) fitted the spectrum during the constant bolometric luminosity phase with T 700 000 K and found only evidence of moderate cooling with a temperature of 660 000 K in February of 2004, but the temperature may have been constant within the errors. Eight months later, in the first observation we discuss here, the supersoft flux had decreased by 5 orders of magnitude comparing with the estimates of Rauch et al. (2010), but the equivalent blackbody temperature had not decreased, implying shrinking of the emitting region. In other cases, novae have been observed to become fainter at decreasing temperature, consistently with cooling as hydrogen burning turns off (e.g. V1974 Cyg, Balman et al., 1998).
We wanted to assess whether freezing the value of the column density N(H) at a higher assumed value results in a fit with a lower temperature and higher luminosity, indicating that the whole WD surface may be emitting. The value of the interstellar absorption, derived in our fit is consistent with the estimates of Rauch et al. (2010), but is about two times lower than the one in the direction of V4743 Sgr given by the Leiden/Argentine/Bonn (LAB) Survey of Galactic H I and the Dickey&Lockman H I map in the N(H) ftool222 http://heasarc.gsfc.nasa.gov/cgi-bin/Tools/w3nh/w3nh.pl (a column density of 1.05 and 1.41 cm-2, respectively). Moreover, van Rossum (2012) claimed that the analysis of the red tail slope of the Chandra X-ray spectrum of V4743 Sgr in outburst, indicates N(H) cm-2. So there are indeed reasons to think that N(H) may be higher than our best fitting values. We thus set the value of N(H) to 1.36 cm-2 and fitted the 2004 spectrum again with both the blackbody and the atmospheric model. As expected, the increased absorption mainly affected the supersoft component, and returned T eV, T kK, and much higher luminosity — L4kpc erg s-1, L4kpc erg s-1, corresponding to the radius of the emitting region of R4kpc cm and R4kpc cm, respectively, still smaller than the WD radius (for our calculations we assumed a distance of 4 kpc, since this value is close to the mean of the estimates mentioned in the Introduction). Another mechanism that should be taken into account is a possible absorption in the accretion curtain of the magnetized WD. In our best fitting model we assumed that the partial covering absorber affects only the thermal plasma emission, however, we will further show that the 2004 soft X-ray light curve is also modulated with the WD spin period, which may be due to the accretion curtain, crossing the line of sight (see fig. 4 and Section 2.2). If we assume that the blackbody component is absorbed by the partially covering absorber, the resultant blackbody luminosity is L4kpc erg s-1 and R cm.
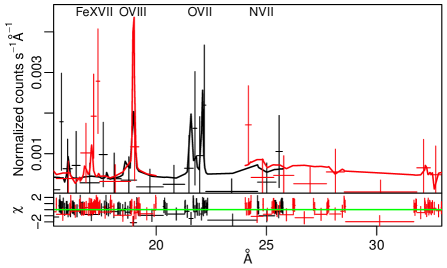
The 2004 RGS spectra are presented in fig 2. Several emission lines are marginally detected: O VII at 21.8–22 Å, O VIII at 18.9 Å, Fe XVII at 17.2 and N VII at 25 Å. The spectrum has a very low signal-to-noise ratio and we did not use it to refine the model parameters. In fig. 2 we overplot the best-fitting model over the binned RGS 1 and 2 data and present the residuals in order to show that the model is consistent with the RGS data.
2.2 Timing analysis
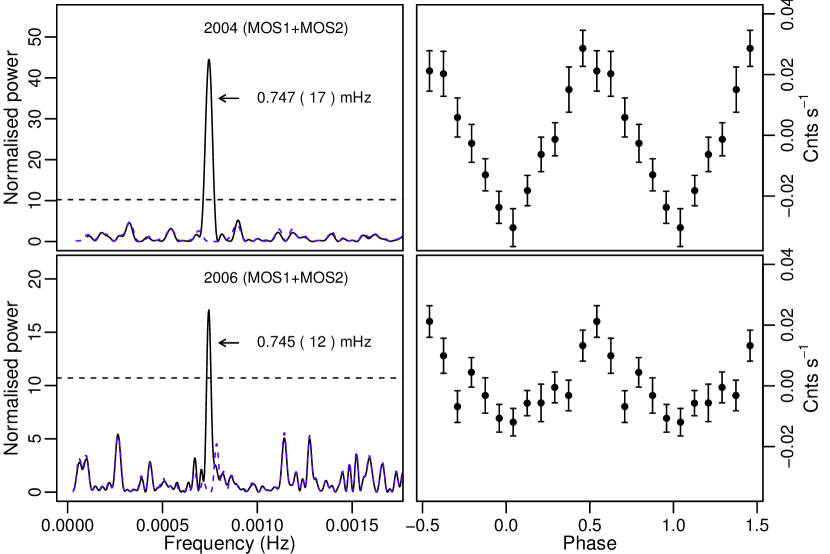
Although Dobrotka & Ness (2010) included the data we present here, we have performed our own, independent, timing analysis of the X-ray light curves in order to quantitatively confirm the existence of the WD spin modulation using the bootstrap method and to study a possible energy dependence of the signal. We binned the XMM Newton light curves every 100 seconds, combined the data of the MOS 1 and MOS 2 detectors and subtracted a possible long-term trend with a 3-order polynomial fit. We applied the Lomb-Scargle method (Scargle, 1982) for the 2004 and 2006 datasets in order to investigate the X-ray intensity modulations. The resultant Lomb-Scargle periodograms (LSPs) are presented in Figure 3. In both light curves the 0.75 mHz frequency is clearly detected. The dashed horizontal line is the 0.3% false alarm probability and the dashed blue line shows the LSP after the subtraction of the main peak by fitting and removing a sine function. We also applied the bootstrap method, repeatedly scrambling the data 10000 times and calculating the probability that random peaks in LSP in the range 0.1 mHz – 2 mHz exceed the hight of the peak at 0.75 mHz in the original LSP. The probability that the peak in the original data occurred by chance is zero for the 2004 dataset and 0.02% for the 2006 one. In order to confirm the values of the frequencies with an independent analysis we applied the Phase Dispersion Minimisation (PDM) method (Stellingwerf, 1978) to the same light curves. The values of the frequencies found with different methods are presented in Table 3. To summarize, we confirm the broadband timing properties as published by Dobrotka & Ness (2010).
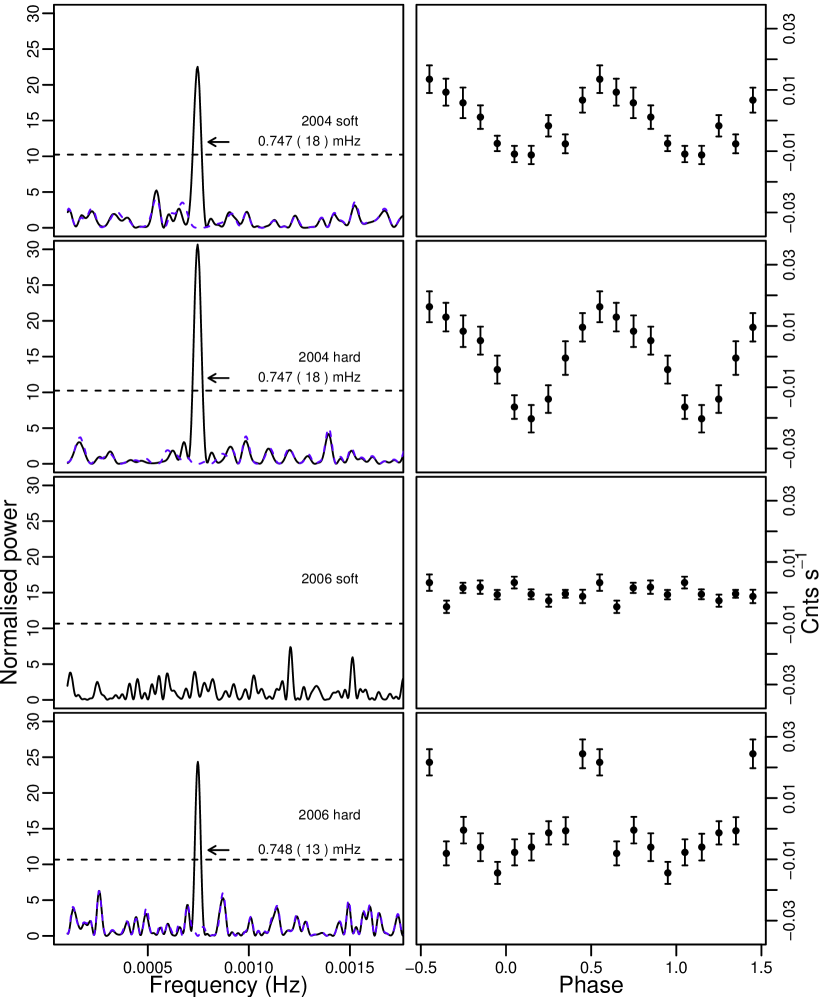
We investigated a possible energy dependence of the X-ray modulation. We first extracted the light curves in two energy ranges: 0.3 – 0.8 keV and 0.8 – 10 keV and performed the same methodology as was mentioned above. Fig. 4 represents the LSPs for the hard and soft energy ranges of the 2004 and 2006 datasets. While in 2004 the modulation was the same in both energy ranges, in 2006 it was present only in the hard X-rays. The amplitudes of the modulation in 2004 were 50% and 30% in the soft an hard ranges, respectively and 30% in the hard range in 2006. Aiming to constrain the spectral component, modulated with the spin period in the 2004 dataset, we extracted the MOS 1 and 2 light curves in a narrower range — 0.3 – 0.6 keV, where the blackbody-like emission dominates. The modulation was still present even in this energy range, indicating that the supersoft X-ray emission is modulated with the same period.
Although the orbital modulation was observed in the optical band (Kang et al., 2006; Richards et al., 2005; Wagner et al., 2005), indicating a moderately high inclination of , we find no variability that might represent an orbital modulation in our X-ray data, neither in the soft, nor in the hard ranges.
3 SALT observations
Optical spectra of V4743 Sgr in the 4500–5600 Å range were obtained on March 21 2014 at the SALT telescope using the Robert Stobie Spectrograph (RSS), grating PG2300, in a long slit mode (single, 8 arcmin long, 1.5 arcsec wide slit)333 Under program 1178-7 2013-2-UW-001 (PI: Marina Orio). The instrumental resolution is 110 – 120 km s-1. For the flux calibration we used the standard star Feige 110. This observation was done in the framework of a monitoring program of novae previously observed as SSS as they returned to quiescence (Zemko 2016 in prep).
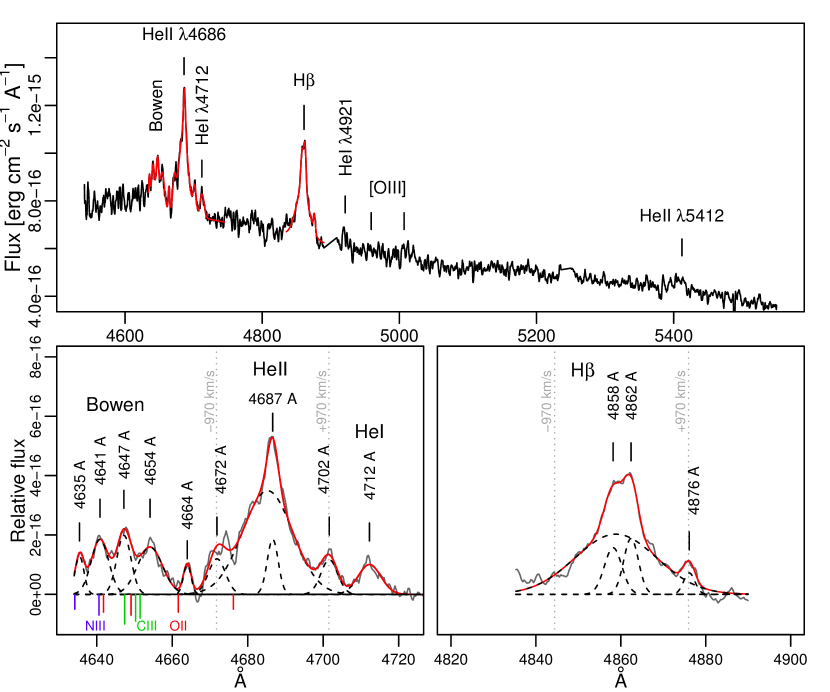
The flux calibrated and dereddened optical SALT spectrum is presented in the top panel of Figure 5. For dereddening we assumed N(H)=0.71 cm-2 (see Table 2), which corresponds to E(B-V)=0.12 (Bohlin et al., 1978). The [O III] 5007 line is only marginally detected (the rest wavelengths of the [O III] lines are marked on the plot), which is typical of a very fast nova after 10 years (Downes et al., 2001).
The strongest emission lines are He II 4686, H and the Bowen blend. We removed the continuum using the continuum task in IRAF and fitted with Gaussians the main features in these regions (the H, He II 4686 lines and their components and the Bowen blend) in order to measure their central positions and velocity broadening. The result of the fit is shown with the red line in all the plots of Figure 5 and the dashed black lines on the bottom plots show the Gaussian components that were introduced. The central positions of the best fitting Gaussians are also marked. From this fit we found that both H and He II 4686 emission lines have a narrow and a broad component, just slightly shifted with respect to each other as it is seen from the bottom panels of Fig. 5. The narrow component of H has a double peaked profile with a separation of only 250 km s-1 between the two peaks, which is quite small for the accretion disk rotation (assuming MWD=1.2 M⊙, Porb=6 h and a reasonable value for the mass ratio q0.8 the velocity will be about 560 km s-1 at the radius of the tidal limit of the accretion disk, which is expected to be an upper limit for the disk radius, see e.g. Warner 1995). The broad component of H has a FWHM of 1300 km s-1 and the broad component of He II 4686 — 990 km s-1. The H line seems to have another small component at 4876 Å, red-shifted by 970 km s-1 with respect to the position of the double-peaked central line. Interestingly, similar small components, red and blue-shifted by almost the same velocity of 950 km s-1 are also observed in the He II 4686 line.
Another prominent feature of the spectrum is the Bowen blend at 4640–4650 Å, which is a combination of three lines of C III, two of N III and eight of O II (McClintock et al., 1975). The rest positions of the most intensive lines are indicated in the bottom-left panel of Figure 5. The length of the label of each line depends on its laboratory intensity: the higher the intensity is the bigger is the label. We see that the 4641 and 4647 lines, observed in the spectrum, coincide with the rest positions of the N III and C III lines, respectively. On the other hand, the origin of the 4654 line is unknown. The equivalent widths (EWs) of the He II 4686 and H emission lines are about 10.5 and that of the Bowen blend is 5.2 .
4 Discussion
V4743 Sgr is a bright X-ray source, which emitted both soft (0.6 keV) and hard X-rays in 2004 and only hard in 2006. Novae shortly after eruption can emit X-rays in the 1–10 keV range originating from the shocked ejected shells (Mukai et al., 2008; Ness et al., 2013b), but since the source of this emission is spatially extended it cannot be variable on short time scales, in contrast to our observations (fig. 4 and 3). Basing on the fact that the hard X-ray component, which is present in both observations, is modulated with the WD spin period and is also well fitted with the two-temperature thermal plasma emission model, typical of plasma in collisional equilibrium cooling as it settles onto the WD, we argue that this component is due to the resumed accretion.
The disappearing of the soft emission in 2006 indicates that it is, in turn, associated with hydrogen burning and not with accretion. The soft component was also modulated with the WD spin period supporting the idea that the source of this emission is close to the WD surface, like in case of short-period X-ray oscillations of novae in SSS phases found by Ness et al. (2015). Since both XMM Newton exposures are longer than the orbital period the disappearing of the supersoft component is also not an effect of different orbital phases.
The He II 4686 line and the Bowen blend in the SALT spectra show that there is still an ionizing component that is strong in the 200–300 range. This component may be the same that was previously emitting the supersoft X-rays and has cooled to a peak temperature in the UV range. If so, the disappearance of the supersoft X-ray emission in 2006 is probably consistent with cooling. The EWs of the He II 4686 and H lines are small in comparison to what is usually observed in novae a decade after explosions (Ringwald et al., 1996; Tomov et al., 2015). It may imply that the WD photosphere is cooling fast, reducing the number of photons with wavelengths shorter than the 228 edge, consequently contributing less to the formation of the He II 4686 line. Alternatively, the small EWs may be a result of a strong reprocessed continuum due to irradiation of the accretion disk and the secondary.
In this section we will discuss possible emitting sites of the soft X-ray component and magnetic nature of V4743 Sgr.
4.1 The IP scenario
Several observational facts suggest that V4743 Sgr may be an intermediate polar.
-
•
Taking into account uncertainty in the distance, discussed above, the hard X-ray luminosity in the 2.0–10 keV range was – erg s-1 in the 2006 dataset, which is typical of IPs (Pretorius & Mukai, 2014).
- •
-
•
The most important indication of a magnetic nature of V4743 Sgr is the presence of the coherent 0.75 mHz modulation, observed in X-rays even in quiescence. The frequency was stable from 2004 to 2006, to within measurement limitations. The WD rotation in IPs is not synchronized with the orbital period and once during the spin period the accretion curtain crosses a line of sight, resulting in the X-ray light curve pulsations. Since the X-rays are also reprocessed from the surface of the secondary, the beat period between the spin and the orbital one is often observed in the optical band. Taking into account two periodicities found in the optical observations (Kang et al., 2006) and the WD spin period measured in our X-ray data, we see that a relation is perfectly satisfied. However, the orbital period is yet to be spectroscopically confirmed.
-
•
The prominent He II 4686 line and the high value of (He II 4686)(H) ratio are typical of IPs (the ratio is 1, while in IPs it is usually 0.4, Silber, 1992), although this is not observed only in IPs444 for a discussion see
http://asd.gsfc.nasa.gov/Koji.Mukai/iphome/issues/heii.html. Most interestingly, the emission lines have a complex structure with red and blue-shifted components with the same velocity, which may originate in the accretion curtains in the magnetosphere of the WD as it was observed in another IP and an old nova – GK Per Bianchini et al. (2003). Since the total exposure time of two SALT spectra of V4743 Sgr (which were combined for the analysis) covers more than one spin period all the possible WD spin-depended effects were smeared out in the resultant spectrum. SALT does not usually allow phase-constrained observations, but in the future we would like to obtain phase resolved optical spectra with another telescope, to better constrain the emission site of these lines components.
The only element that seems odd and somehow out of place in the IP scenario is that the soft X-ray modulation disappeared in the 2006 data (see fig. 4): the variability was observed only above 0.8 keV. This is in contrast with the usual situation for IPs in which X-ray modulations are more prominent in soft X-rays, since the cross section of photoelectric absorption in the accretion curtain decreases with energy. We also did not detect any modulation of the X-rays related to the orbital period, but this can be due to relatively short exposure times. In fact, during the outburst, there was a marginal detection of orbital modulation in the supersoft X-rays light curve (Leibowitz et al., 2006). The orbital modulation in the X-ray light curve is usually, but not always, observed in IPs with inclination angles exceeding (Parker et al., 2005). Altogether, many observational facts indicate that V4743 Sgr is an IP and we favour this hypothesis.
4.2 The soft X-ray component
Taking into account all the measurements of Teff and the luminosity of the supersoft X-ray component in the 2004 XMM Newton spectrum (see Tab. 2 and the section 2.1) we find that the luminosity decreased at least by two orders of magnitude compared with the values found by van Rossum (2012) and Rauch et al. (2010) in the last Chandra exposure during the SSS phase and the estimates of the emitting region radius lie in the range 4kpc cm. Even the largest possible distance of 6 kpc (found by Nielbock & Schmidtobreick 2003) would only increase this value by 50%. It is not consistent with an emitting region as large as the whole WD surface but is close to the estimates of the size of a polar cap in an IP (Hellier, 1997).
A similar low luminosity blackbody component, with a temperature of about 70 eV, was detected in V2491 Cyg more than 2 years after the outburst (Page et al., 2010; Zemko et al., 2015). The size of its emitting region decreased well below the size of the surface of the WD. Since V2491 Cyg was also an IP candidate, Zemko et al. (2015) proposed that the blackbody emission can originate either in the irradiated polar cap, like in “soft IPs” or, less probable, from a localized residual hydrogen burning, left after the nova explosion. Another example is V2487 Oph – a recurrent nova and an IP candidate – which showed blackbody-like emission in X-rays even 8.8 years after the nova explosion (Hernanz, 2014). However, in the 2006 observations of V4743 Sgr the blackbody component was not detected and it would be difficult to explain this fact in the context of the soft IP scenario. Irradiation of the polar cap region can indeed depend on the mass transfer rate, but since the hard X-ray component was the same in both datasets – 2004 and 2006 – we do not expect the mass transfer rate to vary significantly. A possible explanation is a temperature gradient on the surface of the WD, which can remain for several years after the nova explosion. It is not clear, however, why in V4743 Sgr this gradient disappear already after 3.5 years, while in V2487 Oph it was observed for almost 9 years.
5 Conclusions
We analysed two quiescent XMM Newton observations of V4743 Sgr in the first years after the outburst, and a later optical spectrum. A stable, coherent modulation of the X-ray light curves at frequency 0.75 mHz, observed in both XMM Newton exposures, and the X-ray spectra indicate that V4743 Sgr is an IP. The optical spectrum revealed prominent emission lines of He II 4686, H and the Bowen blend. The EWs of the emission lines are low, implying that the WD photosphere was cooling relatively fast or that there is a strong reprocessed continuum due to irradiation of the accretion disk and the secondary. The He II 4686 line and the Bowen blend point towards a hot region, which may be the same that was previously emitting the supersoft X-rays and has simply cooled to a peak temperature in the UV range. We found that the He II 4686 and H emission lines of V4743 Sgr have a complex structure with a narrow, broad and blue and red-shifted satellite components, which may be due to the “accretion curtains” in an IP. The (He II 4686)(H) ratio is high, which is consistent with the IP interpretation.
In the X-ray spectrum obtained 2 years after the explosion we detected a supersoft component at a temperature close to the WD temperature during the SSS phase, but with at least two orders of magnitude lower luminosity. In contrast to the typical behaviour of novae, V4743 Sgr seems to show a shrinking of the soft X-rays emitting region at almost constant temperature instead of cooling. So far, we know only two such examples: V2491 Cyg and V2487 Oph that are both IP candidates and most probably host massive WDs (Hernanz, 2014; Zemko et al., 2015). In V4743 Sgr the supersoft X-ray component disappeared by the time of the last XMM Newton observation, implying that the source of radiation is not related to accretion and cannot be explained by the irradiated polar cap on the WD, like in “soft IPs”. We propose that this supersoft emission may be due to a temperature gradient on the surface of the WD, which can be a characteristic of magnetic novae.
The disappearing low-luminosity supersoft component is a very interesting phenomenon that we still do not quite know how to explain. We know that such a component was observed in two other novae, and that in V2487 Oph it lasted for at least almost 9 years. Data on other novae are still missing and further X-ray monitoring is encouraged, because this phenomenon may have profound implications for the secular history of accretion and hydrogen burning.
| Simultaneous fits | Independent fits | |||||
| Parameter | 2004 | 2006 | 2004+atm | 2006+atm | 2004 | 2004+atm. |
| N(H)a | ||||||
| N(H)pcb | ||||||
| CvrFractc | ||||||
| Tbb/atm (eV) | ||||||
| T1 (keV) | ||||||
| T2 (keV) | 14 | 17 | ||||
| Norm1d | ||||||
| Norm2d | ||||||
| Flux | ||||||
| Flux | 7.62 | 2.88 | 5.35 | 2.13 | 5.35 | 4.82 |
| Fluxf | 0.282 | 0.227 | 0.306 | 0.245 | ||
| Fluxf | 1.98 | 0.552 | 0.981 | 0.431 | ||
| 1.2 | 1.2 | 1.2 | 1.2 | 0.9 | 0.9 | |
| L | 4.62 | 2.76 | 4.53 | 2.70 | 4.60 | 4.52 |
| Lbbh | 4.9 | 3.84 | ||||
| Rbb/atmi | 8.8 | 3.8 | ||||
| a cm-2. | ||||||
| b N(H)pc cm-2 for the partial covering absorber. | ||||||
| c Covering fraction of the partial covering absorber. | ||||||
| d Normalisation constant of the VAPEC model. | ||||||
| e The X-ray flux ( erg cm-2 s-1) measured in the range 0.2–10.0 keV. The Fluxunabs represents the value of the X-ray flux, corrected for the interstellar and intrinsic absorption. | ||||||
| f The X-ray flux (erg cm-2 s-1) of the blackbody component measured in the range 0.2–10.0 keV. | ||||||
| g The X-ray luminosity ( erg s4kpc) in the range 2.0–10.0 keV. The L2.0-10.0keV was calculated from the X-ray flux in the range 2.0–10.0 keV, corrected for the interstellar and intrinsic absorption. | ||||||
| h The bolometric X-ray luminosity ( erg s4kpc) of the blackbody and atmospheric component. Lbb/atm were calculated from the normalization constants of the models. | ||||||
| i The radius of the emitting region ( cm). For the blackbody fit Rbb was found from the Stefan-Boltzmann law. The atmospheric model gives the value of the emitting radius cm. | ||||||
| Dataset | Frequency (mHz) | |
|---|---|---|
| LS | PDM | |
| 2004 (MOS1+MOS2) | 0.747(17) | 0.7424(14) |
| 2006 (MOS1+MOS2) | 0.745(12) | 0.7434(28) |
| Notes LS — Lomb-Scargle method; PDM — Phase Dispersion Minimisation method. The erros in the frequencies found with the LS method correspond to the 1 level. | ||
Acknowledgements
Some of the observations reported in this paper were obtained with the Southern African Large Telescope (SALT). Polina Zemko acknowledges a pre-doctoral grant of the CARIPARO foundation at the University of Padova. Dr. Orio was funded by the NASA XMM Newton program.
References
- Anzolin et al. (2008) Anzolin G., de Martino D., Bonnet-Bidaud J.-M., Mouchet M., Gänsicke B. T., Matt G., Mukai K., 2008, A&A, 489, 1243
- Balman et al. (1998) Balman Ş., Krautter J., Ögelman H., 1998, ApJ, 499, 395
- Bianchini et al. (2003) Bianchini A., Canterna R., Desidera S., Garcia C., 2003, PASP, 115, 474
- Bohlin et al. (1978) Bohlin R. C., Savage B. D., Drake J. F., 1978, ApJ, 224, 132
- Dobrotka & Ness (2010) Dobrotka A., Ness J.-U., 2010, MNRAS, 405, 2668
- Downes et al. (2001) Downes R. A., Duerbeck H. W., Delahodde C. E., 2001, Journal of Astronomical Data, 7
- Evans & Hellier (2007) Evans P. A., Hellier C., 2007, ApJ, 663, 1277
- Haseda et al. (2002) Haseda K., West D., Yamaoka H., Masi G., 2002, IAU Circ., 7975, 1
- Hellier (1997) Hellier C., 1997, MNRAS, 291, 71
- Hernanz (2014) Hernanz M., 2014, in European Physical Journal Web of Conferences. p. 7002, doi:10.1051/epjconf/20136407002
- Kang et al. (2006) Kang T. W., Retter A., Liu A., Richards M., 2006, AJ, 132, 608
- Kato et al. (2002) Kato T., Fujii M., Ayani K., 2002, IAU Circ., 7975, 2
- Leibowitz et al. (2006) Leibowitz E., Orio M., Gonzalez-Riestra R., Lipkin Y., Ness J.-U., Starrfield S., Still M., Tepedelenlioglu E., 2006, MNRAS, 371, 424
- McClintock et al. (1975) McClintock J. E., Canizares C. R., Tarter C. B., 1975, ApJ, 198, 641
- Mukai et al. (2008) Mukai K., Orio M., Della Valle M., 2008, ApJ, 677, 1248
- Ness et al. (2003) Ness J.-U., et al., 2003, ApJ, 594, L127
- Ness et al. (2013a) Ness J.-U., et al., 2013a, A&A, 559, A50
- Ness et al. (2013b) Ness J.-U., et al., 2013b, A&A, 559, A50
- Ness et al. (2015) Ness J.-U., et al., 2015, A&A, 578, A39
- Nielbock & Schmidtobreick (2003) Nielbock M., Schmidtobreick L., 2003, A&A, 400, L5
- Page et al. (2010) Page K. L., et al., 2010, MNRAS, 401, 121
- Parker et al. (2005) Parker T. L., Norton A. J., Mukai K., 2005, A&A, 439, 213
- Pretorius & Mukai (2014) Pretorius M. L., Mukai K., 2014, MNRAS, 442, 2580
- Rauch & Deetjen (2003) Rauch T., Deetjen J. L., 2003, in Hubeny I., Mihalas D., Werner K., eds, Astronomical Society of the Pacific Conference Series Vol. 288, Stellar Atmosphere Modeling. p. 103 (arXiv:astro-ph/0403239)
- Rauch et al. (2010) Rauch T., Orio M., Gonzales-Riestra R., Nelson T., Still M., Werner K., Wilms J., 2010, ApJ, 717, 363
- Richards et al. (2005) Richards M. T., Kang T. W., Retter A., Liu A., 2005, in American Astronomical Society Meeting Abstracts. p. 1277
- Ringwald et al. (1996) Ringwald F. A., Naylor T., Mukai K., 1996, MNRAS, 281, 192
- Scargle (1982) Scargle J. D., 1982, ApJ, 263, 835
- Silber (1992) Silber A. D., 1992, PhD thesis, MASSACHUSETTS INSTITUTE OF TECHNOLOGY.
- Starrfield et al. (2003) Starrfield S., Ness J.-U., Drake J. J., Orio M., 2003, IAU Circ., 8107, 1
- Stellingwerf (1978) Stellingwerf R. F., 1978, ApJ, 224, 953
- Strope et al. (2010) Strope R. J., Schaefer B. E., Henden A. A., 2010, AJ, 140, 34
- Tomov et al. (2015) Tomov T., Swierczynski E., Mikolajewski M., Ilkiewicz K., 2015, A&A, 576, A119
- Vanlandingham et al. (2007) Vanlandingham K. M., Schwarz G., Starrfield S., Woodward C., Wagner M., Ness J., Helton A., 2007, in American Astronomical Society Meeting Abstracts #210. p. 99
- Wagner et al. (2005) Wagner R. M., Steinfadt J., Bond H. E., Hooper E., Karam A., Rohrbach J., Schwarz G., Starrfield S., 2005, in American Astronomical Society Meeting Abstracts. p. 1277
- Warner (1995) Warner B., 1995, Cataclysmic Variable Stars. Cambridge University Press
- Zemko et al. (2015) Zemko P., Mukai K., Orio M., 2015, ApJ, 807, 61
- della Valle & Livio (1995) della Valle M., Livio M., 1995, ApJ, 452, 704
- van Rossum (2012) van Rossum D. R., 2012, ApJ, 756, 43
- van Rossum & Ness (2010) van Rossum D. R., Ness J.-U., 2010, Astronomische Nachrichten, 331, 175