Megamaser Disks Reveal a Broad Distribution of Black Hole Mass in Spiral Galaxies
Abstract
We use new precision measurements of black hole masses from water megamaser disks to investigate scaling relations between macroscopic galaxy properties and supermassive black hole (BH) mass. The megamaser-derived BH masses span , while all the galaxy properties that we examine (including total stellar mass, central mass density, and central velocity dispersion) lie within a narrower range. Thus, no galaxy property correlates tightly with in spiral galaxies as traced by megamaser disks. Of them all, stellar velocity dispersion provides the tightest relation, but at fixed the mean megamaser are offset by dex relative to early-type galaxies. Spiral galaxies with non-maser dynamical BH masses do not appear to show this offset. At low mass, we do not yet know the full distribution of BH mass at fixed galaxy property; the non-maser dynamical measurements may miss the low-mass end of the BH distribution due to inability to resolve their spheres of influence and/or megamasers may preferentially occur in lower-mass BHs.
1 Introduction
For more than a decade, we have studied the relationship between the stellar velocity dispersion of a galaxy bulge and the central supermassive black hole (BH) mass (e.g., Tremaine et al., 2002). As more dynamical are measured, particularly at the highest (e.g., McConnell & Ma, 2013) and in spiral galaxies (Greene et al., 2010), it has become clear that the relationship between and has more scatter and more structure than was originally thought (Kormendy & Ho, 2013).
BH mass does not correlate strongly with total galaxy mass (e.g., Reines & Volonteri, 2015), nor does it appear to correlate with circular velocity (and thus by inference dark matter halo mass; Sun et al., 2013). It is possible that is built up along with the bulge mass. However, in late-type galaxies where there is clear evidence for ongoing bulge growth, appear to be systematically lower than expected based on BH-bulge relations in early-type galaxies (e.g., Läsker et al., 2016). Here, we use megamaser disks that reside well within the BH sphere of influence to probe the distribution of in spiral galaxies.
2 Megamaser Disk Galaxies, Sample, and Observations
Stellar and non-maser gas dynamical methods yield the majority of dynamical , but they are limiting both in spatial resolution and in ability to cleanly measure in all galaxy types. Due to the need to resolve the gravitational sphere of influence, these methods currently cannot reach at the distance of Virgo. Dust, ongoing star formation, and non-axisymmetric potentials such as bars also complicate efforts to get in late-type galaxies. Megamaser disks circumvent these problems and provide the most accurate and precise extragalactic measurements.
Circumnuclear H2O megamasers often trace Keplerian rotation around the supermassive BH at radii of pc (e.g., Miyoshi et al., 1995). Sensitive surveys, enabled primarily by the Green Bank Telescope (GBT), and micro-arcsecond accurate mapping of the disks with the Very Long Baseline Array (VLBA), the Jansky Very Large Array (JVLA), the GBT, and/or the 100-m Effelsberg telescope have yielded more than 150 megamaser galaxies, of which at least 34 harbor megamaser disks (e.g., Pesce et al., 2015). The host galaxies are spirals with Hubble types S0-Sbc, while the derived have values ranging from (e.g., Greene et al., 2010; Kuo et al., 2011). Here we add measurements for seven galaxies, whose are presented in Gao et al. (2016), Gao et al. in preparation, and Zhao et al. in preparation (Table 1).
2.1 Comparison Galaxy Sample
We consider only galaxies with dynamical measurements. We start with the recent compilation from Saglia et al. (2016, 97 galaxies) plus a new megamaser disk mass for IC2560 (Wagner et al. in preparation). Of these 98, 13 are megamaser disks. We add non-maser dynamical masses for NGC 4395 (den Brok et al., 2015), and the interesting outliers NGC 1271 (Walsh et al., 2015), NGC 1277 (Walsh et al., 2016), and NGC 1600 (Thomas et al., 2016) for a total of 102 literature sources and a final sample of 109 galaxies including our 7 new megamaser disks (Table 1). There are a total of 20 megamaser disk galaxies and 17 late-type (non-S0) non-maser spiral galaxies. When we discuss stellar masses (), we refer to the 67 galaxies that have imaging from the Sloan Digital Sky Survey (SDSS; York et al., 2000).
2.2 Spectroscopic Observations
![[Uncaptioned image]](/html/1606.00018/assets/x1.png)
Fits to the observations of ESO 558009 and Mrk 1029 from Triplespec (§2.2). The data are shown in black (in units of erg s-1 cm-2 Å-1 arbitrarily scaled), the best-fit pPXF model in red, and residuals in thin black at the bottom. Masked regions corresponding to emission lines are indicated with vertical dashed lines. Unmasked spikes are the result of imperfect sky subtraction.
The presented here are measured from three data sets. Two galaxies (NGC 1320, NGC 5495) were observed with the B&C spectrograph on the Dupont telescope at Las Campanas Observatory using a 2″ slit (Greene et al., 2010). These spectra have an instrumental resolution of km s-1 and a wavelength range of Å. NGC 1320 is only marginally spectroscopically resolved, while NGC 5495 is well-resolved, but we are able to recover reliable dispersions at or slightly below the instrumental resolution (Greene et al., 2010). We extracted spectra within a 2″ aperture to perform our measurements. The reductions are described in detail in Greene et al. (2010). Standard flat-field, bias, wavelength calibration, flux, and telluric correction were performed within IRAF. Each galaxy was observed for 1.3 hr, yielding signal-to-noise ratios of pixel-1 (see example fits to similar objects in Greene et al. 2010).
Two galaxies (Mrk1029, ESO558G009) have measurements from the cross-dispersed near-infrared spectrograph Triplespec (Wilson et al., 2004) on the 3.5m telescope at Apache Point. Triplespec has a wavelength range of with a spectral resolution of km s-1, far higher than the internal of the galaxies. We observed with the slit oriented along the major axis of each galaxy; again we extracted data within a 2″ aperture. We nodded off the galaxy by 1-3′ to measure the sky, and at least once an hour we observed an A0V star ( mag) at similar airmass to serve as a spectrophotometric standard and to facilitate telluric correction. Integration times ranged from 0.5-1.5 hr, yielding signal-to-noise ratios of pixel-1 (Fig. 2.2).
![[Uncaptioned image]](/html/1606.00018/assets/x2.png)
We performed standard data reduction procedures using custom software written for Triplespec based on the Spextool package (Vacca et al., 2003; Cushing et al., 2004), which performed flat-fielding, wavelength calibration, bias, dark, and atmospheric air-glow subtraction. Nonlinearity corrections were applied, and the spectra are traced and optimally extracted (Horne, 1986). The spectra were combined using a robust error clipping at each pixel. Flux calibration utilized observations of A0 telluric standards (Vacca et al., 2003).
Finally, three galaxies (J0437+2456, NGC 5765b, UGC 6093) have spectra from the SDSS. They have a spectral resolution of km s-1 (resolving our galaxies well) and cover a range of Å. The fiber has a 3″ diameter, roughly matched to the extraction apertures used above.
3 Analysis
3.1 Stellar Velocity Dispersions
We measure using direct pixel fitting implemented by the publicly available pPXF code (Cappellari & Emsellem, 2004). We measure only the first two moments of the line-of-sight velocity distribution ( and ). To account for differences in flux calibration and reddening, we also include a fourth-order multiplicative polynomial.
For the two optical spectrographs, we use spectral templates from Valdes et al. (2004), which have a higher spectral resolution than the galaxy observations ( km s-1). The code solves for the optimal set of template weights over the spectral range of Å. We experiment with three other narrower spectral windows, and find agreement within for between the different regions.
Our near-infrared spectral template stars are taken from Wallace & Hinkle (1996) and have a spectral resolution of km s-1 in the -band. The NIR spectra cover . We derive the most stable measurements from the CO bandheads in the -band (2.2-2.35 ). The band data proved hard to fit due to spectral differences between the galaxies and our template stars.
3.2 Uncertainties in
The errors on are measured via bootstrapping; the best-fit models are combined with Gaussian-random noise of the proper amplitude to simulate the data and these are refit to generate a distribution in and (Table 1). We also compare our observations with the measurements published by the Hobby Eberly Telescope Massive Galaxy Survey (HETGMS; van den Bosch et al., 2015). Taking the eight megamaser galaxies in common between HETMGS and the published in Greene et al. (2010) or presented here, we find . We set 13% as a floor on the measured uncertainty.
Aperture corrections are a significant source of systematic uncertainty. In ellipticals, is typically measured within a fixed fraction of , which is challenging to measure in spiral bulges. Furthermore, profiles are more complex and is typically higher in spiral bulges, even when the large-scale disk is excluded, as here (e.g., Falcón-Barroso et al., 2006; Greene et al., 2014). We do not correct for rotation, but we estimate the magnitude of such a correction as follows. Typical spirals have within 1-2″ (Falcón-Barroso et al., 2006). Removing the rotation in quadrature moves the spirals toward the relation of ellipticals (e.g., Bennert et al., 2015). On the other hand, elliptical galaxies also typically rotate (e.g., Emsellem et al., 2007) so there is no strong scientific justification to remove this component of dynamical support only in the spiral galaxies.
3.3 Stellar Masses
In addition to , we calculate stellar masses () for the 67 galaxies that lie within the SDSS footprint using linear relationships between color and from Bell et al. (2003). To estimate an allowed range of , for each galaxy we calculate 12 possible stellar masses using the four SDSS Petrosian colors to derive , combined with the robustly measured , , and band luminosities. We average these estimates and take the standard deviation to estimate an error – this error is larger in systems with a wide mix of stellar populations and/or dust, where blue and red colors provide quite different estimates.
We calculate for the entire galaxy and within kpc (). The mass within a fixed physical aperture is a crude but non-parametric estimate of the central stellar density, and might correlate better with than the total . It is also a simple measurement relative to , , or even . We measure from the SDSS data using the luminosity within a central circular aperture. We exclude galaxies where the aperture is 2”, which are limited by the SDSS seeing.
3.4 Mass Uncertainties
Photometric stellar masses contain many uncertainties, including aperture effects, projection effects, and the contribution of nebular emission from an active nucleus (for the megamaser disk galaxies). The latter effect we mitigate by taking an average over multiple filters. We find only small differences when we test elliptical apertures for a subset of the galaxies ( mag), and removing edge-on galaxies does not change the result. We also explore whether our results are biased by using projected quantities. For the high-mass, high-Sérsic index galaxies, we analytically deproject the central mass (Bezanson et al., 2009) using the single-Sérsic fits from the NSA catalog. We reproduce our aperture measurements within 0.1 dex, with no systematic dependence on mass or . Deprojection uncertainties may play a larger role for the pseudobulges, particularly for nearly edge-on inclinations. We explore the importance of the inclination using ellipse fitting to our HST data for the maser galaxies (Greene et al., 2014; Läsker et al., 2016) and find that the differences between circular and elliptical apertures are never larger than 0.2 mag, translating into dex in stellar mass.
Hardest to quantify are the errors incurred from our mass estimation techniques, but overall it has been shown that single-color conversions (§3.3) return an unbiased stellar mass (Roediger & Courteau, 2015).
4 Exploring Black Hole-Galaxy Correlations
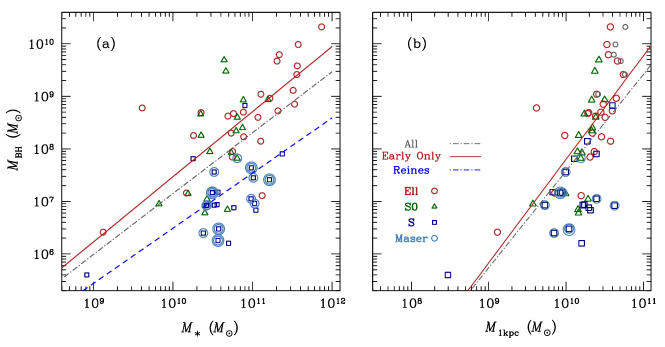
In Figure 1a, we show the relationship between and . We fit all relations in this paper using the Bayesian line-fitting code of Kelly (2007), taking into account uncertainties in both and the galaxy properties. We fit a log-linear model with log (, with being , , or and near the center of the distribution (Table 2).
We find dex scatter in the relation between and . At a stellar mass of , spans a range from to , and spiral galaxies tend to have lower than elliptical galaxies at similar . We have long known that BHs correlate better with galaxy bulges than with , disk mass (e.g., Gebhardt et al., 2003), or asymptotic circular velocity (e.g., Sun et al., 2013).
Original interpretations of the BH-bulge scaling relations posited that energy released during active phases of BH growth acted on galaxy-wide gas reservoirs, thus impacting the future growth of the galaxy (e.g., Springel et al., 2005). The BHs in the megamaser disk galaxies are too large to be primordial seeds (e.g., Volonteri, 2010), so they have certainly undergone some accretion episodes, but the lack of correlation with strongly suggests that BH growth does not remove gas from galactic disks (i.e., does not act beyond bulge scales). After removing the disk component, we still see considerable scatter between and bulge properties in late-type spiral galaxies, even when we attempt to isolate the “classical” bulge component from the nuclear disks, rings, and bars that characterize “pseudobulges” (Läsker et al., 2016; Saglia et al., 2016).
4.1 A Local Relationship with Central Density
Recent work has found that central mass density (stellar mass within 1 kpc, ) is a strong indicator of the star formation history of a galaxy (e.g., Barro et al., 2015), with high central stellar density and galaxy quenching going hand in hand. Exactly what terminates star formation in dense galaxies remains unknown, but one possibility is feedback from supermassive BHs, which may grow along with dense cores. Thus, we consider a local relationship between and the mass enclosed within 1 kpc (Figure 1b).
A local relationship between and stellar mass is cheap to measure (§3.3) and relatively easy to compare with simulations (see Reines & Volonteri, 2015). Such a local relationship might arise if the gas supply to the galaxy center determines both the central star formation rate and the overall rate of BH growth, and BH growth is self-regulated (e.g., Debuhr et al., 2010), or if the accretion disk is fed locally by stars rather than gas accretion (Miralda-Escudé & Kollmeier, 2005).
The - relation is shown in Figure 1b. We do observe an overall correlation between and . However, the scatter is substantial (0.8 dex; Table 2), and the dynamic range in is limited, causing a very steep scaling between and . At the highest masses, core scouring (e.g., Rusli et al., 2013) tends to artificially decrease the central mass density. We “correct” the most massive galaxies for core scouring in Fig. 1b by adding the to the central mass, but our fits do not change.
![[Uncaptioned image]](/html/1606.00018/assets/x4.png)
4.2 Black Hole Mass and Stellar Velocity Dispersion
Turning to the - relation, our linear fit to the full sample of galaxies confirms the steep slope found in recent works () and the high intrinsic scatter (). In Greene et al. (2010), we found that the BH masses in the megamaser disk galaxies are lower than expected at a fixed . Here we double the megamaser disk sample and strongly confirm our previous result (Fig. 4.2). We calculate the average offset between and that predicted by the relation fit to early-type galaxies. The offset is calculated as the weighted mean of the difference between the measured and that calculated from the best-fit relation, with the weights including both and uncertainties combined in quadrature (Läsker et al., 2016). We find an offset of for late-type galaxies and an offset of for pseudobulges111Taking the identifications from Saglia et al. 2016 for the literature sources and taking all of our new galaxies to harbor some secularly evolving component based on our new HST imaging; Pjanka et al. in preparation..
We now have marginally sufficient statistics to compare the distributions of maser and non-maser spirals. There are 20 megamaser disk galaxies (2 S0, 18 spiral) and 17 late-type (non-S0) spiral galaxies with measurements from non-maser dynamics. The maser and non-maser samples have indistinguishable distributions in according to an Anderson-Darling test (e.g., Babu & Feigelson, 2006) with of being drawn from the same distribution. Likewise, the distributions of bulge type are quite similar, with % of the stellar/gas dynamical and % of the megamaser disk galaxies hosted by pseudobulges (Table 1).
![[Uncaptioned image]](/html/1606.00018/assets/x5.png)
The relationship between and . We fit the entire sample (grey dashed line) and the early-type galaxies alone (red solid). Note the systematic offset to lower at a fixed for the megamaser disk galaxies. Symbols as in Figure 1.
Calculating the net offset from our best-fit - relation for elliptical galaxies, we find dex for the 20 megamaser disks, while we find no mean offset dex for the non-maser spirals (Fig. 4.2). The maser and non-maser spirals are significantly different in ; the Anderson-Darling test returns a probability that they are drawn from the same distribution (Fig. 4.2), even if we focus on just the 18 non-S0 maser disk galaxies or the maser and non-maser pseudobulge samples (). Finally, we examine the two samples non-parametrically in two dimensions using the Cramer Von-Mises test, and find that the two samples are different at 90% significance.
With such small numbers we see only a suggestive difference between the maser and non-maser samples. On the other hand, we see a similar trend in the - relations (Läsker et al., 2016). Thus, we briefly consider the possible ramifications should this difference prove real. There are three possibilities. First, the masers could trace the true distribution, while the non-maser distribution is biased due to the inability to resolve the sphere of influence of BHs. Existing upper limits do not constrain this possibility, as they are at higher BH mass (Gültekin et al., 2011). In this scenario, spiral (or low-mass) galaxies do have a broad range of , as may be expected in merger-driven scenarios (e.g., Jahnke & Macciò, 2011) or if never gets large enough to exert feedback on the galaxy (e.g., Zubovas & King, 2012).
Second, the non-maser distribution could be the real one, with masers preferentially occurring in lower- systems due to a correlation between and disk size (Neufeld et al., 1994; van den Bosch et al., 2016). The third possibility, which we view as highly unlikely, is that we may be preferentially catching the maser galaxies as they grow toward the - relation. Given that BH growth episodes are likely quite short compared to the growth times of bulges (many Gyr), we do not favor this third scenario (Greene et al., 2010). We urgently need more observations of both spiral and elliptical galaxies at low mass, using multiple methods, to determine the full distribution of at low galaxy mass.
![[Uncaptioned image]](/html/1606.00018/assets/f4.png)
The distribution of at fixed . Megamaser galaxies (thick black) are offset to lower than the full sample of spirals (blue filled) or the early-type galaxies (red filled).
5 Summary
We present new stellar velocity dispersion measurements for seven megamaser disk galaxies, and revisit galaxy-BH scaling relations that incorporate these new measurements. In addition to , we investigate total stellar mass , and a non-parametric measure of central stellar mass density within 1 kpc, . We have also recently examined bulge mass (Läsker et al., 2016), and halo mass (Sun et al., 2013).
The in megamaser disk galaxies span a large range for any fixed galaxy property, while the maser and non-maser dynamical measurements have different distributions of at a fixed galaxy property. To determine the real distribution of in this low-mass regime we must push the sphere-of-influence limit downwards for non-maser . We hope that with ALMA (e.g., Barth et al., 2016) and thirty-meter–class optical/NIR telescopes (e.g., Do et al., 2014), we will fill in low-mass galaxies with non-maser dynamical measurements to address the full distribution of in low-mass galaxies.
References
- Babu & Feigelson (2006) Babu, G. J., & Feigelson, E. D. 2006, in Astronomical Society of the Pacific Conference Series, Vol. 351, Astronomical Data Analysis Software and Systems XV, ed. C. Gabriel, C. Arviset, D. Ponz, & S. Enrique, 127
- Barro et al. (2015) Barro, G., Faber, S. M., Koo, D. C., Dekel, A., Fang, J. J., Trump, J. R., Perez-Gonzalez, P. G., Pacifici, C., Primack, J. R., Somerville, R. S., Yan, H., Guo, Y., Liu, F., Ceverino, D., Kocevski, D. D., & McGrath, E. 2015, ArXiv e-prints
- Barth et al. (2016) Barth, A. J., Boizelle, B. D., Darling, J., Baker, A. J., Buote, D. A., Ho, L. C., & Walsh, J. L. 2016, ApJ, 822, L28
- Bell et al. (2003) Bell, E. F., McIntosh, D. H., Katz, N., & Weinberg, M. D. 2003, ApJS, 149, 289
- Bennert et al. (2015) Bennert, V. N., Treu, T., Auger, M. W., Cosens, M., Park, D., Rosen, R., Harris, C. E., Malkan, M. A., & Woo, J.-H. 2015, ApJ, 809, 20
- Bezanson et al. (2009) Bezanson, R., van Dokkum, P. G., Tal, T., Marchesini, D., Kriek, M., Franx, M., & Coppi, P. 2009, ApJ, 697, 1290
- Cappellari & Emsellem (2004) Cappellari, M., & Emsellem, E. 2004, PASP, 116, 138
- Cushing et al. (2004) Cushing, M. C., Vacca, W. D., & Rayner, J. T. 2004, PASP, 116, 362
- Debuhr et al. (2010) Debuhr, J., Quataert, E., Ma, C.-P., & Hopkins, P. 2010, MNRAS, 406, L55
- den Brok et al. (2015) den Brok, M., Seth, A. C., Barth, A. J., Carson, D. J., Neumayer, N., Cappellari, M., Debattista, V. P., Ho, L. C., Hood, C. E., & McDermid, R. M. 2015, ApJ, 809, 101
- Do et al. (2014) Do, T., Wright, S. A., Barth, A. J., Barton, E. J., Simard, L., Larkin, J. E., Moore, A. M., Wang, L., & Ellerbroek, B. 2014, AJ, 147, 93
- Dunkley et al. (2009) Dunkley, J., et al. 2009, ApJ, 701, 1804
- Emsellem et al. (2007) Emsellem, E., et al. 2007, MNRAS, 379, 401
- Falcón-Barroso et al. (2006) Falcón-Barroso, J., Bacon, R., Bureau, M., Cappellari, M., Davies, R. L., de Zeeuw, P. T., Emsellem, E., Fathi, K., Krajnović, D., Kuntschner, H., McDermid, R. M., Peletier, R. F., & Sarzi, M. 2006, MNRAS, 369, 529
- Gao et al. (2016) Gao, F., Braatz, J. A., Reid, M. J., Lo, K. Y., Condon, J. J., Henkel, C., Kuo, C. Y., Impellizzeri, C. M. V., Pesce, D. W., & Zhao, W. 2016, ApJ, 817, 128
- Gebhardt et al. (2003) Gebhardt, K., Richstone, D., Tremaine, S., Lauer, T. R., Bender, R., Bower, G., Dressler, A., Faber, S. M., Filippenko, A. V., Green, R., Grillmair, C., Ho, L. C., Kormendy, J., Magorrian, J., & Pinkney, J. 2003, ApJ, 583, 92
- Greene et al. (2010) Greene, J. E., Peng, C. Y., Kim, M., Kuo, C.-Y., Braatz, J. A., Impellizzeri, C. M. V., Condon, J. J., Lo, K. Y., Henkel, C., & Reid, M. J. 2010, ApJ, 721, 26
- Greene et al. (2014) Greene, J. E., Seth, A., Lyubenova, M., Walsh, J., van de Ven, G., & Läsker, R. 2014, ApJ, 788, 145
- Gültekin et al. (2011) Gültekin, K., Tremaine, S., Loeb, A., & Richstone, D. O. 2011, ApJ, 738, 17
- Horne (1986) Horne, K. 1986, PASP, 98, 609
- Jahnke & Macciò (2011) Jahnke, K., & Macciò, A. V. 2011, ApJ, 734, 92
- Kelly (2007) Kelly, B. C. 2007, ApJ, 665, 1489
- Kormendy & Ho (2013) Kormendy, J., & Ho, L. C. 2013, ARA&A, 51, 511
- Kuo et al. (2011) Kuo, C. Y., Braatz, J. A., Condon, J. J., Impellizzeri, C. M. V., Lo, K. Y., Zaw, I., Schenker, M., Henkel, C., Reid, M. J., & Greene, J. E. 2011, ApJ, 727, 20
- Kuo et al. (2015) Kuo, C. Y., Braatz, J. A., Lo, K. Y., Reid, M. J., Suyu, S. H., Pesce, D. W., Condon, J. J., Henkel, C., & Impellizzeri, C. M. V. 2015, ApJ, 800, 26
- Läsker et al. (2016) Läsker, R., Greene, J. E., Seth, A., van de Ven, G., Braatz, J. A., Henkel, C., & Lo, K. Y. 2016, ApJ, accepted (arXiv/1602.06960)
- McConnell & Ma (2013) McConnell, N. J., & Ma, C.-P. 2013, ApJ, 764, 184
- Miralda-Escudé & Kollmeier (2005) Miralda-Escudé, J., & Kollmeier, J. A. 2005, ApJ, 619, 30
- Miyoshi et al. (1995) Miyoshi, M., Moran, J., Herrnstein, J., Greenhill, L., Nakai, N., Diamond, P., & Inoue, M. 1995, Nature, 373, 127
- Neufeld et al. (1994) Neufeld, D. A., Maloney, P. R., & Conger, S. 1994, ApJ, 436, L127
- Pesce et al. (2015) Pesce, D. W., Braatz, J. A., Condon, J. J., Gao, F., Henkel, C., Litzinger, E., Lo, K. Y., & Reid, M. J. 2015, ApJ, 810, 65
- Reines & Volonteri (2015) Reines, A. E., & Volonteri, M. 2015, ApJ, 813, 82
- Roediger & Courteau (2015) Roediger, J. C., & Courteau, S. 2015, MNRAS, 452, 3209
- Rusli et al. (2013) Rusli, S. P., Erwin, P., Saglia, R. P., Thomas, J., Fabricius, M., Bender, R., & Nowak, N. 2013, AJ, 146, 160
- Saglia et al. (2016) Saglia, R. P., Opitsch, M., Erwin, P., Thomas, J., Beifiori, A., Fabricius, M., Mazzalay, X., Nowak, N., Rusli, S. P., & Bender, R. 2016, ApJ, 818, 47
- Springel et al. (2005) Springel, V., Di Matteo, T., & Hernquist, L. 2005, ApJ, 620, L79
- Sun et al. (2013) Sun, A.-L., Greene, J. E., Impellizzeri, C. M. V., Kuo, C.-Y., Braatz, J. A., & Tuttle, S. 2013, ApJ, 778, 47
- Thomas et al. (2016) Thomas, J., Ma, C.-P., McConnell, N. J., Greene, J. E., Blakeslee, J. P., & Janish, R. 2016, Nature, 532, 340
- Tremaine et al. (2002) Tremaine, S., Gebhardt, K., Bender, R., Bower, G., Dressler, A., Faber, S. M., Filippenko, A. V., Green, R., Grillmair, C., Ho, L. C., Kormendy, J., Lauer, T. R., Magorrian, J., Pinkney, J., & Richstone, D. 2002, ApJ, 574, 740
- Vacca et al. (2003) Vacca, W. D., Cushing, M. C., & Rayner, J. T. 2003, PASP, 115, 389
- Valdes et al. (2004) Valdes, F., Gupta, R., Rose, J. A., Singh, H. P., & Bell, D. J. 2004, ApJS, 152, 251
- van den Bosch et al. (2015) van den Bosch, R. C. E., Gebhardt, K., Gültekin, K., Yıldırım, A., & Walsh, J. L. 2015, ApJS, 218, 10
- van den Bosch et al. (2016) van den Bosch, R. C. E., Greene, J. E., Braatz, J. A., Constantin, A., & Kuo, C.-Y. 2016, ApJ, 819, 11
- Volonteri (2010) Volonteri, M. 2010, A&A Rev., 18, 279
- Wallace & Hinkle (1996) Wallace, L., & Hinkle, K. 1996, ApJS, 107, 312
- Walsh et al. (2015) Walsh, J. L., van den Bosch, R. C. E., Gebhardt, K., Yildirim, A., Gültekin, K., Husemann, B., & Richstone, D. O. 2015, ApJ, 808, 183
- Walsh et al. (2016) Walsh, J. L., van den Bosch, R. C. E., Gebhardt, K., Yıldırım, A., Richstone, D. O., Gültekin, K., & Husemann, B. 2016, ApJ, 817, 2
- Wilson et al. (2004) Wilson, J. C., Henderson, C. P., Herter, T. L., Matthews, K., Skrutskie, M. F., Adams, J. D., Moon, D.-S., Smith, R., Gautier, N., Ressler, M., Soifer, B. T., Lin, S., Howard, J., LaMarr, J., Stolberg, T. M., & Zink, J. 2004, in Society of Photo-Optical Instrumentation Engineers (SPIE) Conference Series, Vol. 5492, Ground-based Instrumentation for Astronomy, ed. A. F. M. Moorwood & M. Iye, 1295–1305
- York et al. (2000) York, D. G., et al. 2000, AJ, 120, 1579
- Zubovas & King (2012) Zubovas, K., & King, A. R. 2012, MNRAS, 426, 2751