Little evidence for entropy and energy excess beyond - An end to ICM preheating?
Abstract
Non-gravitational feedback affects the nature of the intra-cluster medium (ICM). X-ray cooling of the ICM and in situ energy feedback from AGN’s and SNe as well as preheating of the gas at epochs preceding the formation of clusters are proposed mechanisms for such feedback. While cooling and AGN feedbacks are dominant in cluster cores, the signatures of a preheated ICM are expected to be present even at large radii. To estimate the degree of preheating, with minimum confusion from AGN feedback/cooling, we study the excess entropy and non-gravitational energy profiles upto for a sample of 17 galaxy clusters using joint data sets of Planck SZ pressure and ROSAT/PSPC gas density profiles. The canonical value of preheating entropy floor of keV cm2, needed in order to match cluster scalings, is ruled out at . We also show that the feedback energy of 1 keV/particle is ruled out at 5.2 beyond . Our analysis takes both non-thermal pressure and clumping into account which can be important in outer regions. Our results based on the direct probe of the ICM in the outermost regions do not support any significant preheating.
keywords:
cosmology: cosmological parameters — clusters: formation — galaxy clusters: general1 INTRODUCTION
Galaxy clusters are the largest and most massive virialized objects in the universe, which make them ideal probes of the large scale structure of the universe and, hence, of cosmological parameters that govern the growth of structures (see Gladders et al. (2007) and references therein). However, in order to obtain robust estimates of these parameters, using X-ray techniques, one requires precise knowledge about the evolution of galaxy clusters with redshift and the thermodynamical properties of intracluster medium (ICM). In the simplest case, where one considers pure gravitational collapse, cluster scaling relations are expected to follow self-similarity (Kaiser, 1986; Sereno & Ettori, 2015). X-ray scaling relations have been widely used to test the strength of correlations between cluster properties and to probe the extent of self-similarity of clusters (Morandi et al., 2007). These observations show departure from self-similarity; for example, the luminosity-temperature () relation for self-similar models predict a shallower slope () than observed (). Similarly, Sunyaev-Zel’dovich (SZ) scaling relations also show similar departure (Holder & Carlstrom, 2001).
Such departures point towards the importance of complex non-gravitational processes over and above the shock heating of the ICM. The first idea aimed at explaining departure from self-similar scaling relations is that of preheating, first proposed by Kaiser (1991) and later extended by others (Evrard & Henry, 1991; Babul et al., 2002). In this scenario, the cluster forms from an already preheated and enriched gas due to feedback processes (such as galactic winds or AGN) heating up the surrounding gas at high redshifts. Preheating models require constant entropy level of keV cm2 in order to explain the break in the self-similarity scaling relations (Tozzi & Norman, 2001; Babul et al., 2002; McCarthy et al., 2002). In terms of ICM energetics, this typically translates into feedback energy of keV per particle (Tozzi & Norman, 2001; Pipino et al., 2002; Finoguenov et al., 2003). However, there is an ambiguity in defining preheating energy/particle since it depends on the density at which gas is heated (less dense gas requires smaller energy to raise it to a particular entropic state). Therefore, preheating is best expressed in terms of entropy.
Although, early preheating models could describe the scaling relations in clusters, it had drawbacks with regard to details. For example, these models predicted isentropic cores particularly in the low mass clusters (Ponman et al., 2003) and an excess of entropy in the outskirts of the clusters (Voit et al., 2003) which are not consistent with observations. The idea of preheating has endured and has found resurgence in recent times (see Pfrommer et al. (2012); Lu et al. (2015) and references therein). Pfrommer et al. (2012) suggested time dependent entropy injection due to TeV blazars which provide uniform heat at peaking near and subsequent formation of CC (NCC) clusters by early forming groups (late forming groups) while Lu et al. (2015) explored preventative scenario of feedback in which the circum-halo medium is heated to finite entropy.
In contrast to preheating, there can also be in situ effects such as injection of energy feedback from AGN, radiative cooling, supernovae and star formation, influencing the thermal structure of ICM (Roychowdhury et al., 2005; Pratt et al., 2010; Eckert et al., 2013a). There is growing evidence that AGN feedback mechanism provides a major source of heating for the ICM (McNamara & Nulsen, 2007; Fabian, 2012; Chaudhuri et al., 2013) in the cluster cores. Outside cluster cores, however, the estimates of entropy floor and feedback energy (particularly in massive clusters) are more reflective of preheating of gas since (i) the effect of central sources is unlikely to be significant and (ii) the loss of energy through radiation is negligible.
It is worth noting that irrespective of the nature of feedback, the thermodynamic history of the ICM is fully encoded in the entropy of the ICM. The ICM entropy profile is defined as111Thermodynamic definition of specific entropy being constant , where is the Boltzmann constant. Non-radiative AMR/SPH simulations, which encodes only gravitational/shock heating, predict entropy profiles of the form (Voit et al., 2005). Apart from slightly larger normalization, it has been found that there is significantly higher (flatter) core entropy in AMR case as a result of the hydrodynamical processes that are resolved in the code (e.g. shocks and mixing motions) (Mitchell et al., 2009; Vazza, 2011; Power et al., 2014). On the other hand, observations find deviations from the predicted entropy profile at small radii (Pratt et al., 2010; Eckert et al., 2013a) as well as large radii (Eckert et al., 2013a; Su et al., 2015).
A meaningful comparison of recent observations with theoretically expected entropy profiles can thus be used to determine the nature and degree of feedback. This idea was developed and used recently by Chaudhuri et al. (2012, 2013) who estimated the non-gravitational energy deposition profile in the cluster cores. They compared benchmark non-radiative AMR/SPH entropy profiles (Voit et al., 2005) with observed entropy profiles for the REXCESS sample of 31 clusters (Pratt et al., 2010) and found the excess mean energy per particle to be keV up to . Further, they showed that the excess energy is strongly correlated with AGN feedback in cluster cores (Chaudhuri et al., 2013).
In the present study, we extend their work by going beyond and estimate entropy floor and feedback energetics at large cluster radii. The effect of clumping and non-thermal pressure, especially at large radii, has been shown to be important (Eckert et al., 2015; Battaglia et al., 2015; Shaw et al., 2010; Shi et al., 2015) and we incorporate both in our analysis.
We study the joint data set of Planck SZ pressure profiles and ROSAT gas density profiles of 17 clusters (Eckert et al., 2012; Planck Collaboration V, 2013) to estimate entropy profiles up to and beyond222We have left out cluster “A2163” from Eckert et al. (2013a, b) in this work as its estimated feedback profile was found hugely different from others. This cluster is in the perturbed state and presumably out of hydrostatic equilibrium (Soucail, 2012).. As detailed in Eckert et al. (2013a), we use the parametric profiles which are obtained by fitting a functional form to projected emission-measure density and Planck SZ pressure data (Vikhlinin et al., 2006; Nagai et al., 2007)333www.isdc.unige.ch/deckert/newsite/Dominique_Eckerts_Hom
epage.html.. The parametric profiles have less cluster-to-cluster scatter and errors; however, they are consistent with the non-parametric deprojected profiles. Below , the resolution of both Planck and ROSAT is insufficient to obtain reliable constraints.
In the last 25 years since its proposal, the evidence for-or-against preheating has been mainly circumstantial. In this Letter, we show that a direct estimate of entropy floor and non-gravitational energy in the outer regions is insignificant enough so as to rule out preheating scenarios. Throughout this work, we will assume (, , ) = (0.3, 0.7, 0.7).
2 ANALYSIS
2.1 Cluster modeling
The total hydrostatic mass profile of the galaxy clusters is given by , where and are the parametric forms of the density and thermal pressure of the ICM respectively (Eckert et al., 2013a; Planck Collaboration V, 2013). The radii and are obtained by first interpolating the profile and then iteratively solving 444 is defined such that is the radius out to which the mean matter density is , where being critical density of the universe at redshift . for . The virial radius, , is calculated with spherical collapse model where . If required, virial radius is obtained by linear extrapolation of mass profile in logarithmic space.
Since the “actual” total mass is also partially supported by non-thermal pressure, we model the non-thermal pressure fraction using the form given in Shaw et al. (2010),
| (1) |
where is total gas pressure, , with , and (Shaw et al., 2010). We also study the effect of different non-thermal pressure fraction by varying . For our sample, the fiducial is of the thermal gas pressure, , around and corresponds to a mass difference of order at . This is in good agreement with simulations/theoretical predictions (Shi et al., 2015). The value of obtained from the resultant mass profiles are consistent with the Planck Collaboration XI (2011). With the addition of the non-thermal pressure, the value of typically increases by Kpc; however, this difference is degenerate with the value of the normalization of .
2.2 Initial entropy profile
Models of the formation of the large scale structure, where gas is shock heated as it falls in the cluster dark matter potential well, predict that the gas entropy has a power-law behavior with radius outside of cluster cores. For non-radiative AMR simulations, Voit et al. (2005) entropy profile is well described in the range by
| (2) |
plus a flatter core below 0.2 with =. We fix = from the recent Planck results (Planck Collaboration XVI, 2013). It has been found that the entropy profiles after taking cooling into account differ with Eq. 2 significant only up 300 Kpc for solar mass cluster (McCarthy et al., 2008) which corresponds to for our sample.
The hydrostatic equation, now including both thermal and non-thermal pressure, can be rewritten in terms of the entropy as
| (3) |
where is the total mass which is equated to . For boundary condition, we fix the gas fraction () to be at virial radius (Crain et al., 2007). Initial profiles for density and temperature are found using Eqs. 2 & 3.
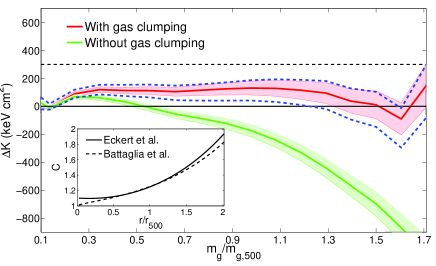
Recently, both simulations and observations have found significant clumping beyond , which by definition is measured as =<>/<>2, (Eckert et al., 2013a, 2015; Battaglia et al., 2015). Eckert et al. (2015) found azimuthal median is a good tracer of the true 3D density (clumping factor) and showed from both hydrodynamical simulations and synthetic simulations that their method recovered the true 3D density profiles with deviations less than 10% at all radii. They found that the average at , consistent with the numerical simulations. Since clumping in the ICM is a plausible reason for the observed flattening of the entropy profiles in the outer regions, we estimate the observed entropy profiles by incorporating clumping using the recent parametric form of the clumping profile given in section 4.1 of Eckert et al. (2015).
2.3 Estimates of total feedback energy
To estimate the feedback thermal energy, we need to relate the entropy change (i.e., ) with change in energy. Considering isobaric approximation, thermal energy change per unit mass is given by (see Chaudhuri et al. (2012) for details), where and . Most importantly, in order to take into account the redistribution of gas mass due to the feedback one should compare entropy profiles for the same enclosed gas mass (i.e., ) instead at the same radii () as commonly done in the literature) (Li et al., 2010; Nath & Majumdar, 2011; Chaudhuri et al., 2012, 2013). The corresponding mechanical feedback energy per particle “” can be written in terms of change in thermal and potential energies as
| (4) |
where and are theoretical and observed radii respectively enclosing the same gas mass. The total amount of feedback energy available in the ICM is
Since clusters lose energy due to X-ray cooling, we estimate total feedback energy deposited in the ICM by adding this lost energy to ; thus , where is the bolometric luminosity in a given gas shell which is obtained by using the approximate cooling function given by Tozzi & Norman (2001) and is the average age of the cluster which we have approximated to be Gyr based on the results of Smith & Taylor (2008). Finally, we estimate the mean non-gravitational energy per particle, <>, from total energy divided by the total number of particles in the ICM (i.e ).
In the rest of the paper, we refer to the case where the energy lost due to cooling is not added to energy estimated from entropy differences as final (after cooling), i.e., . In contrast, where the energy lost due to cooling is also added is referred to as initial (before cooling), i.e., . The latter represents the non-gravitational energy/particle required to heat the gas in a collapsed system from the initial theoretical model to the observed state. However, if the change in configuration is solely due to preheating of gas much before the collapse of system then the amount of energy required would be less than (McCarthy et al., 2008). This implies that represents upper an limit on the preheating energy.

3 Results and Discussion
3.1 Feedback beyond
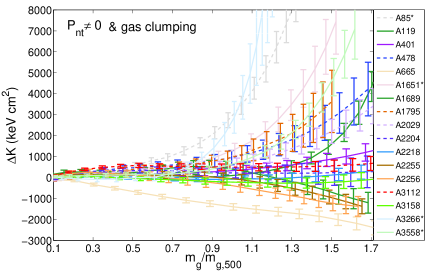
Once the individual profiles are found, we study the mean properties of the sample. The magnitude and profiles of and , estimated following the method laid down, provide clue to the feedback on the ICM. In Fig. 1, we see the weighted average (Louis, 1991) profile is close to keV cm2 for most of the cluster region. There are four cluster marked with * in Fig. 1, which are not included in sub sample for which profiles have comparatively large value (and hence large positive change in thermal energy) in outer regions. However, after accounting for the change in potential energy along with change in thermal energy, the profiles for these clusters become close to zero (or even negative). Moreover, for the sub-sample, the is always consistent at 1 beyond . Fig. 3 shows with and without including clumping in calculations.
In Fig. 4, we show the corresponding average (solid red line) for the full sample and compare it with the average of (dotted red line). These are indistinguishable beyond since, unlike in the inner region (as explored in Chaudhuri et al. (2013)), cooling plays sub-dominant role beyond . There is clear evidence of the feedback up to with the feedback peaking centrally (also found by Chaudhuri et al. (2013)). However, the average profile is close to zero beyond . Since, more than of the cluster volume lies between , one can confidently claim insufficient or complete lack of feedback over most of the cluster volume.
| final average feedback energy/particle | initial average feedback energy/particle | |||
|---|---|---|---|---|
| Sample | ||||
| Full Sample | () | () | () | () |
| Sub Sample | () | () | () | () |
Columns (2) & (3): Average energy per particle in the range and respectively without taking into account energy lost due to cooling (i.e., final feedback energy “”). Columns (4) & (5): Average energy per particle in the range and respectively after taking into account energy lost due to cooling (i.e., initial energy “”). The numbers in brackets show the average energy per particle for boundary condition at the last observed radius instead at virial radius. Error bars are given at level. Clearly, there is little evidence of feedback energy beyond for all cases.

3.2 Discussion
It is now amply clear that both non-thermal pressure and clumping are important at large radii. The addition of non-thermal pressure increases the initial entropy profile “” due to the increase in the normalized . This in turn leads to the decrease in and hence (see Iqbal et al. (2016) for details). Considering the clumpiness in gas density (and assuming that no fluctuations exist in temperature distribution), however, results in increase in the observed entropy and hence increase in the . The importance of clumping () is highlighted in Fig. 3, where we show the average profile before and after correcting for the clumping bias. While the estimated entropy excess is unrealistically negative when no correction is applied, it attains a postive value close to zero when the effect of clumping is taken into account following the parametrization of Eckert et al. (2015). Note that this determination is consistent with the expectation of numerical simulations (Battaglia et al. (2015), see the inset of Fig. 3). We find, preheating value of entropy floor keV cm2 is ruled out at for full sample and at 4.2 for sub sample.
To study the impact of non-thermal pressure on the estimate of non-gravitational energy, we show the profiles for the pure thermal case along with the non-thermal case with three different normalization in Fig. 4. These correspond to mass differences of at for the average profile. The mean excess energy is still far below 1 keV/particle and consistent with zero beyond a specific radius which depends on the choice of . However, neglecting non-thermal pressure overestimates the feedback energy, though still staying less than 1 keV in the outer regions.
Finally, we list the average energy/particle in Tab. 1. We find, beyond , the =1 keV/particle, is ruled out at 5.2 for the full sample, and by 4.8 for sub sample. Since, is roughly the upper limit of preheating energy/particle, this in turn rules out preheating scenarios which require 1 keV/particle to explain the break in scaling relations. At regions below , keV/particle is allowed within 3. It may be also noted from the table that our results are insensitive to the choice of the boundary conditions, particularly for the sub sample. Thus, our constraint on extra heating refers to the inner regions () only, which strongly corroborate with the results of Gaspar et al. (2014). Our results can be compared to the value obtained by Chaudhuri et al. (2013) who studied the regions inside the core () and obtained keV/particle which they showed to be strongly correlated to the central AGN feedback 555Note, that Chaudhuri et al. (2013) did not consider or clumping.. The feedback energy left in the ICM is much lower for the entire radial range with cooling influencing the average energy per particle mainly in the range .
4 Conclusions
Our analysis shows that the estimated entropy excess and energy input corresponding to this excess of the ICM is much less than required by preheating scenarios to explain the break in scaling relations. While the feedback energy estimates rely on some assumptions (isobaric and cooling energy approximations) and refer to energy deposition after the collapse of cluster, the constraints on the shows that preheating scenarios that require more than 300 keV cm2 can be ruled out. This result holds good whether or not the effects of non-thermal pressure and clumping are taken into account. At large radii, the effect of central sources is unlikely to be significant (Hahn et al., 2015), and the loss of energy through radiation is also negligible. While some previous workers have cast doubts on the simple preheating scenario arguing that no single value of energy input can explain the observations (Younger & Bryan, 2007), one can in principle construct variations in the scenario (Fang & Haiman, 2008) in order to explain observations that are dominated by processes in the inner regions. However, our analysis directly probes the entropy floor and energetics of the cluster gas at the outermost regions and shows that any significant preheating that can manifest as a property of the ICM is absent.
Acknowledgements
This work was supported by SERB (DST) Project Grant No. SR/S2/HEP-29/2012. AI would like to thank TIFR, Mumbai and RRI, Banglore for hospitality. The project started with discussions when two of the authors (SM & SE) were sharing an office at the Munich Institute for Astro- and Particle Physics (MIAPP) in 2015. SM would like to thank Nick Kaiser and Dick Bond for comments. DTP preprint no. TIFR/TH/16-12. The authors would like to thank the anonymous referees for useful comments that helped in improving the clarity of the manuscript.
References
- Babul et al. (2002) Babul A. et al., 2002, MNRAS, 330, 329
- Battaglia et al. (2015) Battaglia N. et al., 2015, ApJ, 806, 43
- Chaudhuri et al. (2012) Chaudhuri A., Nath B. B., Majumdar S., 2012, ApJ, 759, 5
- Chaudhuri et al. (2013) Chaudhuri A., Majumdar S., Nath B. B. , 2013, ApJ, 776, 84
- Crain et al. (2007) Crain, R. A. et al. 2007, MNRAS, 377, 41
- Eckert et al. (2012) Eckert D. et al., 2012, A&A, 541, A57
- Eckert et al. (2013a) Eckert D. et al., 2013a, A&A, 551, A22
- Eckert et al. (2013b) Eckert D. et al., 2013b, A&A, 551, A23
- Eckert et al. (2015) Eckert D. et al., 2015, MNRAS, 447, 2198
- Evrard & Henry (1991) Evrard A. E., Henry J. P., 1991, ApJ, 383, 95
- Fabian (2012) Fabian A. C., 2012, ARA&A, 50, 455
- Fang & Haiman (2008) Fang W., Haiman Z., 2008, ApJ, 680, 200
- Finoguenov et al. (2003) Finoguenov A. et al., 2003, A&A, 398, 35
- Gaspar et al. (2014) Gaspar, M. et al., 2014, ApJL, 783, L10
- Gladders et al. (2007) Gladders M. D et al., 2007, ApJ, 655, 128
- Hahn et al. (2015) Hahn O. et al., 2015, arxiv:1509.04289
- Holder & Carlstrom (2001) Holder G. P., Carlstrom J. E., 2001, ApJ, 558, 515
- Iqbal et al. (2016) Iqbal et al., 2016, to be submitted
- Kaiser (1986) Kaiser N., 1986, MNRAS, 222, 323
- Kaiser (1991) Kaiser N., 1991, ApJ, 383, 104
- Li et al. (2010) Li R. et al., 2010, MNRAS, 413, 3039
- Louis (1991) Louis L., 1991, A practical guide to data analysis for physical science students, Cambridge university press
- Lu et al. (2015) Lu Y., Mo H. J., Wechsler R. H., 2015, MNRAS, 446, 1907
- McCarthy et al. (2002) McCarthy, I. G., Babul, A., Balogh, M. L., 2002, ApJ, 573, 515
- McCarthy et al. (2008) McCarthy, I. G. et al., 2008, MNRAS, 386, 1309
- McNamara & Nulsen (2007) McNamara B. R., Nulsen, P. E. J., 2007, ARA&A, 45, 117
- Mitchell et al. (2009) Mitchell N. L. et al., 2009, MNRAS, 395, 180
- Morandi et al. (2007) Morandi A., Ettori S., Moscardini L., 2007, MNRAS, 379, 518
- Nagai et al. (2007) Nagai D., Kravtsov A. V., Vikhlinin A., 2007, ApJ, 668, 1
- Nath & Majumdar (2011) Nath B. B., Majumdar S., 2011, MNRAS, 416,271
- Pfrommer et al. (2012) Pfrommer C. Chang P. Broderick A. E., 2012, ApJ, 752, 24
- Pipino et al. (2002) Pipino A. et al., 2002, New Astron., 7, 227
- Planck Collaboration XI (2011) Planck Collaboration XI, 2011, A&A, 536, A11
- Planck Collaboration V (2013) Planck Collaboration V, 2013, A&A, 550, A131
- Planck Collaboration XVI (2013) Planck Collaboration XVI, 2013, A&A, 571, A20
- Pointecouteau et al. (2005) Pointecouteau E., Arnaud M., Pratt G. W., 2005, A&A, 435, 1
- Ponman et al. (2003) Ponman T. J. et al., 2003, MNRAS, 343, 331
- Power et al. (2014) Power C., Read J. I., Hobbs, A., 2014, MNRAS, 440, 3243
- Pratt et al. (2010) Pratt G. W. et al., 2010, A&A, 511, 14
- Roychowdhury et al. (2005) Roychowdhury S. et al., 2005, ApJ, 634, 90
- Sereno & Ettori (2015) Sereno, M., & Ettori, S., 2015, MNRAS, 450, 3675
- Shaw et al. (2010) Shaw L. D. et al., 2010, ApJ, 725, 1452
- Shi et al. (2015) Shi X. et al., 2015, MNRAS, 448, 1020
- Smith & Taylor (2008) Smith G. P., Taylor J. E., 2008, ApJ, 682, 73
- Soucail (2012) Soucail G., 2012, A&A, 540, 61
- Su et al. (2015) Su Y. et al., 2015, APJ, 805, 104
- Tozzi & Norman (2001) Tozzi P., Norman C., 2001, ApJ, 546, 63
- Vikhlinin et al. (2006) Vikhlinin A. at al. 2006, ApJ, 640, 691
- Vazza (2011) Vazza F., 2011, MNRAS, 410, 461
- Voit et al. (2003) Voit G. M et al., 2003, Apj, 593, 272
- Voit et al. (2005) Voit G. M., Kay S. T., Bryan G. L., 2005, ApJ, 364, 909
- Younger & Bryan (2007) Younger J. D., Bryan G. L., 2007, ApJ, 666, 647