Predictions for Pb Collisions at TeV:
Comparison with Data
Abstract
Predictions made in Albacete et al. [1] prior to the LHC Pb run at TeV are compared to currently available data. Some predictions shown here have been updated by including the same experimental cuts as the data. Some additional predictions are also presented, especially for quarkonia, that were provided to the experiments before the data were made public but were too late for the original publication are also shown here.
keywords:
perturbative QCD, hard probes of heavy-ion collisions12.38.Bx, 25.75.Bh, 25.75.Cj, 13.87.-a
1 Introduction
Members and friends of the JET Collaboration made predictions for the TeV Pb run at the LHC in the winter of 2013. Predictions were collected for charged hadrons; identified particles such as , , and ; photons; jets; ; and gauge bosons. The observables included individual distributions, ratios such as , and correlation functions. The paper in which these predictions were compiled [1] was submitted to this journal and to arXiv.org before the Pb run began in 2013. This paper presents the confrontation of the predictions with data currently available.
The test beam results for published by the ALICE Collaboration [2] were presented for the case where the lead beam moved to the right, in the direction of positive rapidity, in Ref. [\refciteAlbacete:2013ei] because this was the accelerator configuration employed for the test run. Therefore, all predictions for were reflected to conform to that convention. However, for the full 2013 run, since some of the detectors, ALICE and LHCb in particular, are asymmetric around midrapidity, some of the data were taken in a Pb configuration (the proton beam moving toward forward rapidity) and the rest were taken in a Pb configuration (the lead beam moving toward forward rapidity, as in the case of the test run). Thus, further publications have generally employed the typical convention, from fixed-target facilities, where the proton beam moves in the direction of positive rapidity. Thus, in this paper, all results are presented assuming this convention unless explicitly stated otherwise.
2 Charged particles
In Ref. [\refciteAlbacete:2013ei], detailed descriptions of the approaches used to calculate the charged particle multiplicities, distributions and nuclear modification factors, , in Pb collisions were given. Therefore the model descriptions will not be repeated here and instead only a brief summary of the various approaches is presented in this section. Note that almost all approaches involve some parameters tuned at a specific energy to predict results for other energies. For details, consult Ref. [\refciteAlbacete:2013ei] and the original references included therein.
Event generators determine multiplicities from their models of soft particle production followed by fragmentation and hadronization. Hard particle production is typically based on a generator such as [3]. Examples employed here include [4, 5, 6, 7, 8], [9, 10, 11, 12] and [13]. See Secs. 2.3-2.5 in Ref. [\refciteAlbacete:2013ei].
Perturbative QCD approaches involving collinear factorization at leading and next-to-leading order (LO and NLO) typically require a minimum for validity, making estimates of total multiplicity difficult. However, above this minimum , they can calculate the distributions and modification factors. These calculations differ in the cold nuclear matter effects employed and the parameters used. Nuclear shadowing is generally included, as is isospin, differences due to the proton and neutron number of the target nucleus (most important for Drell-Yan and gauge boson production). Broadening of the distributions in cold matter and medium-induced energy loss are also often included. See Secs. 2.6-2.7, based on Refs. [\refciteKang:2011bp,Zhang:2001ce,Papp:2002ub], in Ref. [\refciteAlbacete:2013ei].
A more first-principles QCD approach that can provide an estimate of the total multiplicity is the color glass condensate (CGC). This provides a saturation-based description of the initial state in which nuclei in a high-energy nuclear or proton-nucleus collision appear to be sheets of high-density gluon matter. In this approach, gluon production can be described by -factorization which assumes an ordering in intrinsic transverse momentum rather than momentum fraction , as in collinear factorization. The unintegrated gluon density associated with factorization is related to the color dipole forward scattering amplitude which satisfies the JIMWLK evolution equations [17, 18, 19, 20]. In the large limit, the JIMWLK equations simplify to the Balitsky-Kovchegov (BK) equation, a closed-form result for the rapidity evolution of the dipole amplitude [21, 22, 23, 24]. The running coupling corrections to the leading log BK equation, rcBK, have been phenomenologically successful in describing the rapidity/energy evolution of the dipole [21, 22, 23, 24, 25, 26, 27, 28]. The initial condition still needs to be modeled, generally employing the McLerran-Venugopalan model [29, 30, 31] with parameters constrained by data. The impact parameter dependent dipole saturation model (IP-Sat) [32, 33, 34] is a refinement of the dipole saturation model that reproduces the correct limit when the dipole radius . It includes power corrections to the collinear DGLAP evolution and should be valid where logs in dominate logs of . See Secs. 2.1-2.2 in Ref. [\refciteAlbacete:2013ei] for a more thorough description.
In this update, we do not show all the calculations for the minimum bias charged particle distributions or the -dependent nuclear suppression factor from ALICE, available from the test beam data, again. Here we only show calculations that have been updated or are shown against data taken during the full Pb run and were thus not previously available for comparison. In particular, we show updates of the CGC minimum bias charged particle multiplicity distributions, ; comparisons of the centrality dependence of to the ATLAS data calculated in the same centrality bins; comparison of the distributions to the ALICE and CMS midrapidity data; calculations of the average as a function of the charge particle multiplicity; and comparisons of the nuclear suppression factor, , at midrapidity for ALICE and CMS.
2.1 Multiplicity distribution (J. Albacete, A. Drumitru and A. Rezaeian)
In the original compilation [1], it was shown that the charged particle pseudorapidity distributions, , particularly in the CGC approach, exhibited a considerably steeper slope than the data, especially for in the direction of the lead nucleus. Since then, the CGC calculations have been adjusted, as described below.
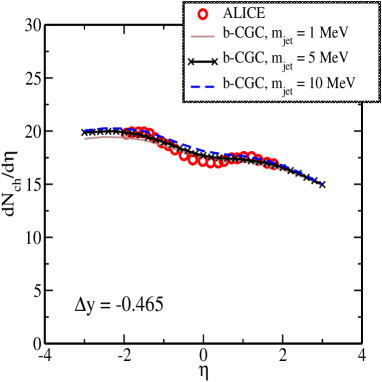
In Fig. 1, results are shown for the charged-particle pseudorapidity density for non-single diffractive Pb collisions at TeV. In order to compare to the ALICE data [2], the boost of the laboratory frame is accounted for by adding a rapidity shift of . The details of calculation can be found in Ref. [\refciteRezaeian:2012ye]. The results are based on -factorization and the impact-parameter Color Glass Condensate saturation model (b-CGC). The parameters of the b-CGC model were determined from a fit to the small- HERA data, including data from diffractive vector meson production [35, 36].
When employing factorization, the rapidity distribution has to be recast in terms of pseudorapidity:
| (1) |
The Jacobian of the rapidity to pseudorapidity transformation is . The scale is determined from the typical transverse mini-jet mass, , and transverse momentum, [37, 38, 40, 39, 28]. Different definitions of can be found in the description of factorization [27]. Here is employed. The main theoretical uncertainty in this approach is the choice of the mini-jet mass. The value of mini-jet mass changes the overall -factor in the -factorization approach, indicating that may mimic some higher-order corrections. Unfortunately, the value of is connected to both soft and hard physics and its true value cannot be determined at the current level of calculational accuracy.
Variations in the choice of and may result in uncertainties as large as % at the LHC. The RHIC data alone, previously used to fix and is not enough to uniquely fix 111The factor is not calculable but is absorbed into an overall factor determined from fits to lower energy midrapidity data. This factor includes contributions from fragmentation and the effective interaction area. Note that changes the shape of while does not. While and are correlated, fixing to the ALICE data can put better limits on ..
In Fig. 1 results on the minimum bias are shown for different values of . Values of in the range MeV provide equally good descriptions of the RHIC data on charged hadron multiplicity. It appears that MeV gives the best description of the ALICE data with an uncertainty of less than [27]. This value of is remarkably similar to the up and down current quark masses.
Albacete and Dumitru also show that depends strongly on the transformation. The rcBK calculation depends on the Jacobian of this transformation which is not uniquely defined in the CGC framework. It is necessary to assume a fixed mini-jet mass, related to the pre-hadronization/fragmentation stage. In Ref. [\refciteAlbacete:2013ei], they assumed the same transformation for and Pb collisions. The result in Fig. 2 shows the dependence of on the Jacobian transformation. The open and filled squares represent the original result [1] while the filled triangles are based on a Jacobian with the hadron momentum modified by . The results are essentially identical in the proton direction but differ considerably in the direction of the lead beam. The difference shows the sensitivity of this result to the mean mass and of the unidentified final-state hadrons.

2.2 Centrality dependence of (Z. Lin and A. Rezaeian)
A good description of the minimum-bias data alone cannot be considered a sufficient test of a particular approach since there are a number of alternative approaches [2] which can describe the same set of data. The charged hadron multiplicity distribution at different centralities provides complementary information to discriminate among models.
In the b-CGC approach, the impact parameter dependence of the saturation scale is an important ingredient for the description of the centrality dependence of charged particle production. The impact parameter dependence of in the b-CGC model is self-consistently constrained by a fit to the -distribution of diffractive vector meson production at HERA [35, 36]. Therefore, the centrality dependence of at the LHC for fixed MeV introduces no new free parameters.
In Fig. 3, predictions for the charged hadron multiplicity distribution at different centralities are compared to the ATLAS data [41] in Pb collisions at TeV. The theoretical band shown in Fig. 3 incorporates uncertainties due to fixing the factor and the mini-jet mass by fitting the RHIC minimum-bias data [42, 43]. Figure 3 shows that, within theoretical uncertainties, the b-CGC approach generally provides a better description of the ATLAS data in the proton region than in the nuclear fragmentation region, especially for the more central collisions. The calculations have a rather linear dependence on while the data exhibit more curvature at midrapidity.
The better agreement of the calculations with the results in the proton direction for more central collisions may be expected since the b-CGC model was constrained by small- data in scattering at HERA. Interestingly, the b-CGC calculations better reproduce the lead-going multiplicity for the most peripheral bins, (40-60)% and (60-90)%, while underestimating the multiplicity in the proton direction. Future diffractive data, including the distribution of diffractive vector meson production in electron-ion collisions, can provide complementary information to constrain saturation models, including the impact parameter dependence for nuclear targets.
The recent ALICE data [44] on the centrality dependence of charged hadron production in Pb collisions are consistent with the ATLAS data. The b-CGC predictions provide a somewhat better description of the ALICE data [44] with the “V0A” centrality selection. (The ALICE data are not shown in Fig. 3).
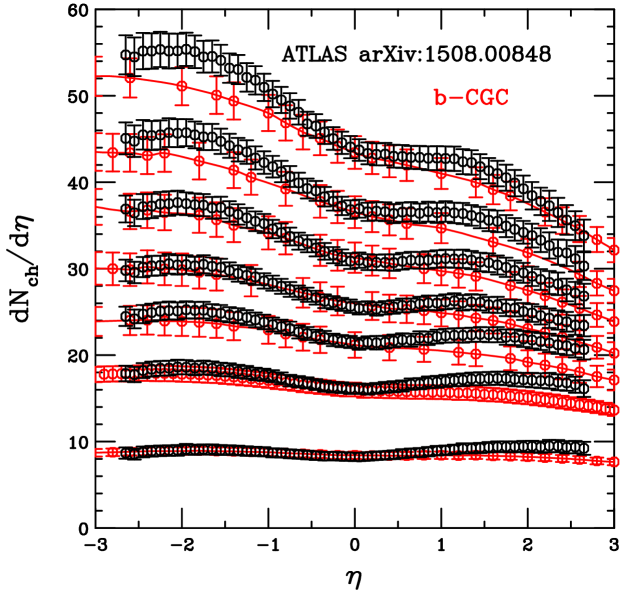
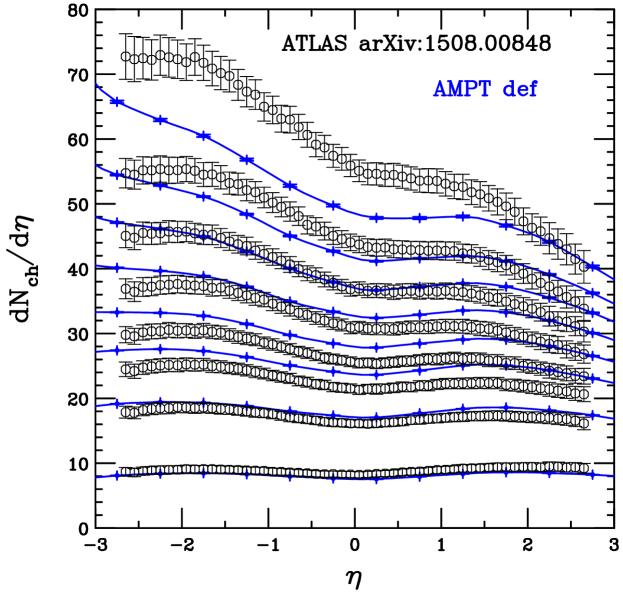
Figure 4 compares the results from the event generator to the same ATLAS data, including also the 0-1% centrality bin. In the results, shown in the lab frame, the centrality in Pb collisions is defined according to the total transverse energy within the range of the ATLAS forward calorimeter in the lead-going direction. The uncertainty on the calculations are statistical. The results have an inflection point near midrapidity, similar to the data. The most central results, especially the 0-1% bin, underestimate the multiplicity in the lead-going direction significantly. However, the (1-5)%, (5-10)% and (10-20)% calculations reproduce the lead-going direction results relatively well. The semi-central results, (20-30)% and (30-40)%, overestimate the measured multiplicity. Finally, the multiplicity in the most peripheral bins are well reproduced.
Neither calculation reproduces all the ATLAS data. Both do well in some centrality bins but the regions where the agreement is good differ in the two approaches. The minimum bias results are similar to that of the (40-60)% centrality bin while the result is similar to the (60-90)% centrality bin.
2.3 Transverse momentum distribution (J. Albacete, G. G. Barnaföldi, J. Barette, W.-T. Deng, A. Dumitru, H. Fujii, M. Gyulassy, P. Levai, Z. Lin, Y. Nara, M. Petrovici, V. Topor Pop, X.-N. Wang, and R. Xu)
Here the transverse momentum distriutions for charged particle production at midrapidity are compared to the ALICE data [45] () and the CMS data [46] (). While the calculations are not necessarily in the identical rapidity range as the data, the bin width is divided out so that normalizations of all the calculations should be compatible with the data.
The rcBK result gives an upper limit (solid curve) and a lower limit (dashed curve) at . The limits are uncertainty estimates due to small variations in the scale entering the coupling and fragmentation functions. The results are generally in agreement with the data for GeV while, for larger , the results are higher than the data. This may not be a surprise since, at sufficiently high , the hard scale becomes larger than the saturation scale and the approach should no longer be valid.
The distributions [9, 10, 11, 12] include strong color fields with GeV/fm and the hard scattering scale, , set to 3.1 GeV. The results with shadowing (WS) were calculated with the default parameterization [4, 5]. They are in rather good agreement with the data up to GeV. At higher , the results with and without shadowing bracket the upper limit on the rcBK results. The calculation without shadowing is always higher that including shadowing.
On the other hand, the distributions, have a rather different curvature from the ALICE data and the other calculations shown in Fig. 5. They drop faster at low than the other results but then become harder at high , becoming similar to the data for GeV, especially for the CMS data. There is essentially no difference between the default results and those with string melting.
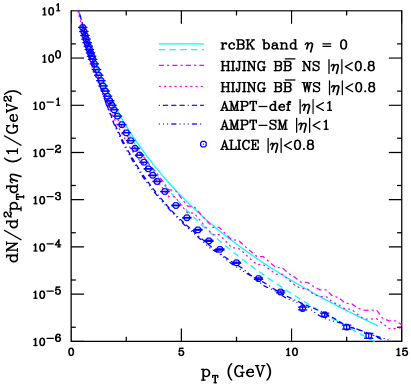
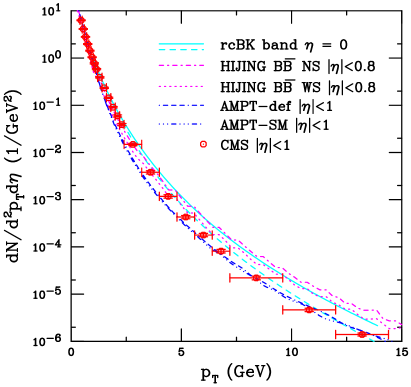
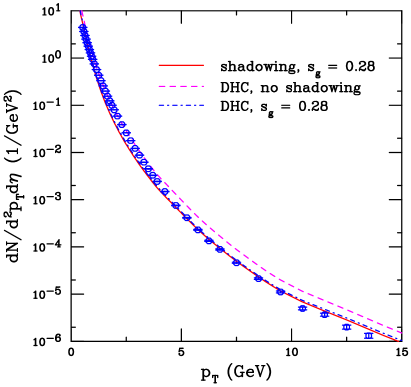
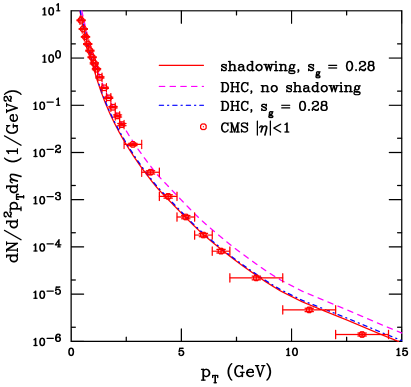
Figure 6 shows several options for cold matter effects in [8]. The solid red curves labeled “shadowing, ” treats hard scatterings as in default but includes a stronger gluon shadowing than quark scattering, consistent with the Pb+Pb data at TeV. The other two results, the dashed magenta and dot-dashed blue curves, labeled “DHC” changes the order of the scattering processes in so that hard scatterings are simulated first, followed by the soft scatterings so as to not limit the hard scatterings.
The results including shadowing are very similar for all , only the calculation without shadowing has a different dependence. The distributions including shadowing agree well with the ALICE data for GeV but are somewhat above the data for higher . On the low end of the range, the calculation without shadowing is in better agreement with the data. The same trend is clearly seen for the CMS data except, at the highest , the wide bins can accommodate the calculations with shadowing.
None of the calculations can describe the entire range of either data set. The treatment of hard scatterings in and reproduce the distributions best at high . However, they gave a rather poor description of the ALICE from the test beam, see Ref. [\refciteAlbacete:2013ei]. Of the calculated distribution shown here, only the rcBK result gave a rather good description of for all , albeit with a wide uncertainty band.
2.4 Average transverse momentum (A. Rezaeian)
Within the -factorization formalism, supplemented by the b-CGC saturation model, it is possible to compute the average transverse momentum of charged particles in , Pb and Pb+Pb collisions [47].
In Fig. 7, the average transverse momentum of charged particles, , is shown as a function of the charged particle multiplicity, , in , Pb and Pb+Pb collisions at , 5.02 and 2.76 TeV respectively, in the range GeV at midrapidity, . The theoretical uncertainties are also shown [47]. Note that, for large , is smaller in Pb+Pb collisions than in Pb and for the same value of . This is because the effective area of the interaction region is different in Pb+Pb collisions compared to the smaller systems. While the trends of the calculations are similar to the data and the magnitudes are well matches, the curvature of the and Pb+Pb calculations is slightly different than the data.
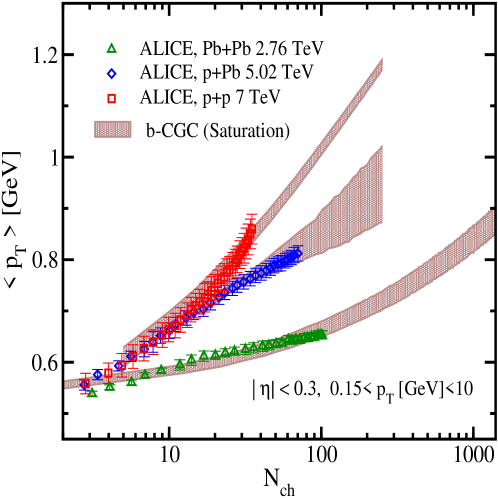
Events with are more perpherial and thus less dense compared to minimum-bias collisions. Note that the average charged particle multiplicity reported by ALICE [48] is , 11.9 and 4.42 in Pb+Pb, Pb and collisions respectively in the kinematics of Fig. 7. Therefore, at moderate , in Fig. 7, the Pb+Pb system is dilute since while, in collisions, the same multiplicity selection criteria corresponds to a very rare, high-density event.
Neither final-state hadronization nor collective hydrodynamics effects are required in this approach to describe the main features of the data shown in Fig. 7. The logarithmic rise of with the density or charged hadron multiplicity is directly related to the rise of the saturation scale with density in the CGC approach [28, 27, 37, 38, 40, 47].
2.5 Nuclear modification factor (K. J. Eskola, I. Helenius, H. Paukkunen and A. Rezaeian
The original calculations of the nuclear modification factor were compared to the already available ALICE test beam data [45] in Ref. [\refciteAlbacete:2013ei]. Those results showed that, with wide uncertainty bands, the CGC-type approaches agreed with the ALICE data [45]. Perturbative QCD approaches generally agreed with the trends of the data but underestimated the rise of at low . Event generators typically did not agree well with the data. These results are not reproduced, see Ref. [\refciteAlbacete:2013ei] for details. Only updates are presented here.
2.5.1 rcBK (A. Rezaeian)
As emphasized in Ref. [\refciteAlbacete:2013ei], the uncertainty on the b-CGC calculation was rather large because, for fixed scale, , the value of varied between 1 and 5, resulted in a wide range of predictions. Here, further constraints on the allowed value of gives , consistent also with the value of the saturation scale extracted from other observables.
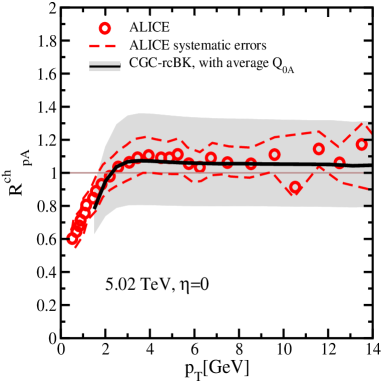
In Fig. 8, the updated predictions are compared with the ALICE minimum bias, midrapidity data [45]. The ALICE data are in good agreement with the predictions shown in Fig. 2 of Ref. [\refciteRezaeian:2012ye]. These solutions of the rcBK evolution equation with average initial nuclear saturation scale of GeV2 employed , constrained in Ref. [\refciteRezaeian:2012ye]. It is remarkable that the preferred value of corresponds to the average value of extracted by other means, see Eq. (19) in Ref. [\refciteRezaeian:2012ye].
While the ALICE data have rather large systematic uncertainties, they can nevertheless impose a strong additional constraint on the initial nuclear saturation scale. They prefer with effectively zero strong coupling to the inelastic terms, , as shown in the gray region of Fig. 8. However, a larger with a finite cannot currently be ruled out. The scale employed in cannot be determined within the current approximation, a full NNLO calculation, as yet unavailable, is required. Therefore, the freedom to choose in the hybrid factorization formalism introduces rather large uncertainties [49].
A remarkable feature of the ALICE data is that the data show no evidence of any Cronin-type enhancement. While the experimental uncertainites are too large to draw any firm conclusion, if this feature persists in more precise data, it can be considered evidence of small- evolution effects at the LHC. A measurement of at forward rapidities at the LHC could provide an additional crucial test of the CGC approach with valuable information about the saturation dynamics [27].
2.5.2 Minimum-bias charged-hadron production in Pb collisions: Collinear factorization (K. J. Eskola, I. Helenius and H. Paukkunen)
The inclusive production of charged hadrons and jets (see Sec. 3.1) are intimately related. Thus, based on the excellent description of jet production by the EPS09 nPDFs seen in Fig. 15 of Sec. 3.1, fair agreement of the calculations with charged-hadron production could have been expected. As shown in Fig. 9, there is indeed agreement between the EPS09-based predictions [50] and the ALICE data [51] for the nuclear modification factor for GeV222For identified pions, agreement can be expected to extend to lower since the enhancement around GeV is absent in the preliminary ALICE data [52].. However, the CMS measurement [53] of at GeV increases by some 40%, clearly beyond the expectations of the EPS09 NLO nPDFs.
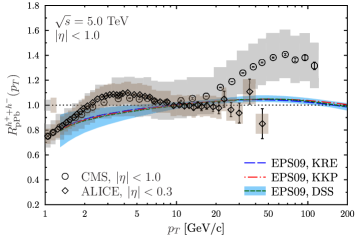
Similar indications of a large enhancement are also present in the preliminary ATLAS data [59], but since these data have been centrality selected, no direct comparison is made due to the biases that the centrality classification in Pb collisions is known to pose [60]. On the contrary, the ALICE data [51] for the same observable shows no sign of such an increase. However, the range is more limited.
More light can be shed on this mystery by considering the absolute spectra measured in Pb collisions and the baseline data used in forming . Since no direct data were available at TeV, the experimental collaborations have constructed these baseline data from measurements at other nearby center-of-mass energies, generally and 7 TeV. In Fig. 9, the measured spectra are contrasted with the NLO calculations. In addition to the nuclear modifications, these calculations also depend on the parton-to-hadron fragmentation functions (FFs). While it is known [61] that none of the currently available sets of fragmentation functions can optimally reproduce the LHC data333As conjectured in Ref. [\refcited’Enterria:2013vba], this could be related to the lack of appropriate constraints (FFs like Kretzer [56] or KKP [57] only employ data) or an inadequate range (e.g. DSS [58] uses only low data)., if the same set of FFs is used when comparing calculations to the independent and Pb data sets, it is possible to draw conclusions regarding the mutual agreement/disagreement of the calculations with the data. Such a comparison is presented in Fig. 10 which shows ratios of the CMS and ALICE data to NLO calculations using Kretzer FFs [56] in and Pb collisions at different center-of-mass energies.
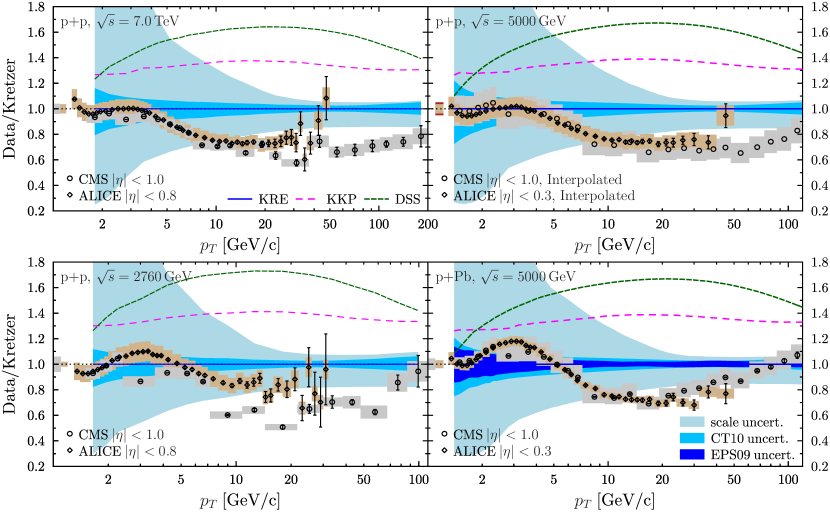
The behaviour of the ALICE and CMS data relative to the NLO calculations in all panels of Fig. 10 is very similar. They more or less agree within the uncertainties, apart, perhaps, from the TeV result. In the case of the ALICE and CMS TeV baseline, the data-to-theory ratios are approximately flat for GeV. The same is true for the ALICE Pb data. However, the CMS Pb data show a distinct upward slope from GeV onward. It thus appears that the origin of the differences in comes from the Pb data and not the baseline. In any case, gluon antishadowing large enough to accommodate the 40% rise of at high would not be compatible with the dijet measurements shown in Fig. 15 where the required antishadowing is only %.
2.5.3 Forward-backward asymmetry (G. G. Barnaföldi, J.Barette, S. M. Harangozó, M. Gyulassy, P. Levai, Z. Lin, G. Papp and V. Topor Pop)
CMS has recently provided data on the forward-backward asymmetry of charged hadron production [46, 53]. They calculate the asymmetry as
| (2) |
where the lead beam is assumed to move toward positive rapidity in the center of mass frame, , while the proton beam is assumed to move in the direction of negative rapidity in the center of mass, . This is the same convention as assumed in Ref. [\refciteAlbacete:2013ei], compatible with the 2012 Pb test run.
The asymmetries, calculated in the center of mass frame in the range [62], both for shadowing in collinear factorization calculations and the and event generators, are shown in Fig. 11. These calculations, also shown in Ref. [\refciteAlbacete:2013ei], are described there. All the calculations are minimum bias (MB). The results with HKN [66], EKS98 [67], and EPS08 [68], calculated with the code[16], are MB by default because they do not include any impact parameter dependence. The results labeled use the shadowing parameterization and, in one case, the multiple scattering prescriptions, and are integrated over impact parameter and are thus MB. One calculation, for the 20% most central collisions, shown in Ref. [\refciteAlbacete:2013ei], has been removed because the data are only for minimum bias collisions. The results for central collisions are greater than unity over all because shadowing effects are expected to be enhanced at more central impact parameters.
In Ref. [\refciteKhachatryan:2015xaa], EPS09 NLO calculations of with the Kretzer fragmentation functions calculations [50, 63], as in Fig. 9, are shown compared to the data, not only for but also for and , all for GeV. The central EPS09 NLO results in Ref. [\refciteKhachatryan:2015xaa] are similar to those shown in Fig. 11 for EKS98 and EPS08. The EPS09 NLO modifications [53]) also but also include the EPS09 NLO uncertainties.
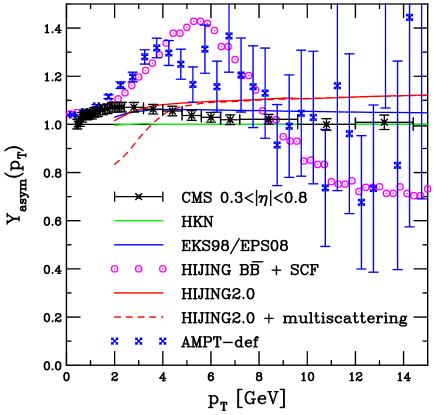
The data show a mild enhancement on either side of midrapidity in the center of mass at low ( GeV). When higher rapidities are studied, the low enhancement in the data increases, from for , to a peak of at and at [53]. At higher , the data at all rapidities are consistent with unity.
A low enhancement that increases with rapidity is not surprising since there is an enhancement (antishadowing) in the lead direction (high in lead) and a depletion (shadowing) in the proton direction (low in lead). The antishadowing and shadowing effects both increase at higher rapidity where increases in the lead direction and decreases in the proton direction. The ratio of the two gives an enhancement in for low . Note that, even for , is not very large for GeV. At low , the effect is particularly enhanced because of gluon contributions.
As increases, the overall effect of modification of the parton densities decreases substantially, especially for gluons at low because the evolution of the gluon nPDFs is large. For GeV, quark dominated processes, like quark-gluon interactions, become more important. The combination of these effects reduces the calculated at high , as seen in the calculations in Ref. [\refciteKhachatryan:2015xaa].
The HKN calculation has no discernible asymmetry. The EKS98 and EPS08 results are indistinguishable and are thus labeled as EKS98/EPS08. These calculations are in reasonably good agreement with the CMS data. The shadowing parameterization in , a rather simple -independent model, agrees relatively well at low but is higher than the data for GeV. As mentioned before, the EPS09 NLO result, including uncertainties, gives good agreement with the high data at the most central rapidities but shows a depletion at high relative to the data further away from midrapidity [53]. The and results predict a larger enhancement at higher than supported by the data and give an asymmetry less than unity at higher .
2.6 Flow (Z. Lin)
In the previous compilation [1] was used to calculate the yields, spectra, and flow coefficients of particles produced in and Pb collisions at TeV. The same event data is used to calculate the dependence of the anisotropy harmonics from the string melting version of [13]. has been previously used to study these observables and direct comparison to the Pb and data have shown generally good agreement [72]. The string-melting mechanism in converts traditional hadronic strings in the initial state to partonic matter when the energy density in the overlap volume of the collision is expected to be higher than that of the QCD phase transition. It also includes a quark coalescence model to describe the bulk hadronization of the resultant partonic matter.
version 2.26t1 [73] was used to generate the results in Ref. [\refciteAlbacete:2013ei] as well as the results here. Following Ref. [\refciteXu:2011fi], the default parameters ( and GeV-2) were used for the Lund symmetric splitting function. The same values of the strong coupling constant and parton cross sections were used as in Ref. [\refciteXu:2011fi]. In these simulations, minimus-bias Pb events were calculated with no restrictions on the impact parameter and with the proton beam moving toward positive rapidity. The Pb centrality for the flow analysis here was defined according to the number of charged hadrons within in the laboratory frame. Table 1 shows the relevant conditions for several Pb centrality classes in the laboratory frame including the average, minimum and maximum values of impact parameter; the total number of participant nucleons in the lead nucleus, ; the number of participant nucleons in the Pb nucleus that undergo inelastic scattering, ; and the average number of charged particles within calculated with .
| Centrality | (fm) | (fm) | (fm) | |||
|---|---|---|---|---|---|---|
| MB | 5.84 | 0.0 | 13.2 | 7.51 | 5.37 | 36.8 |
| 0-5% | 3.48 | 0.0 | 8.8 | 15.87 | 12.26 | 102.5 |
| 5-10% | 3.74 | 0.0 | 8.9 | 14.28 | 10.80 | 81.6 |
| 10-20% | 3.97 | 0.0 | 9.8 | 13.00 | 9.64 | 68.1 |
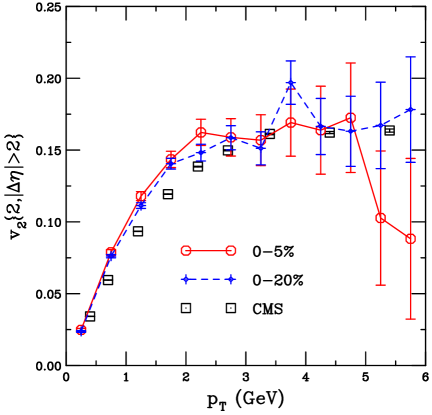
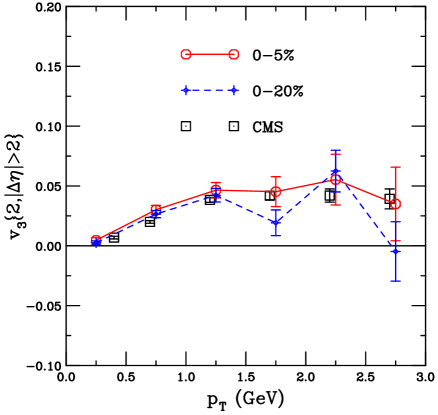
There are CMS data available on [75, 76]. Their analysis method, with , is used. Here is calculated as [77], where denotes averaging over different charged hadron pairs in each event and then averaging over those events. The two particles in each pair need to both be within and have a minimum separation of 2. In addition, the reference particle must be within GeV.
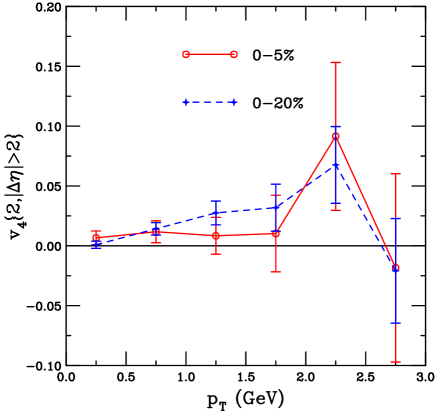
Figures 12-14 show the anisotropy harmonics for calculated with the two-particle correlation method just described. The solid and dashed curves represent the top 5% and top 20%-central results, respectively. The value of for the top 5% centrality is close to, but slightly higher than that for the top 20% centrality. The same is observed for . On the other hand, for the top 20% centrality seems to be higher than that for the top 5% centrality, although there are large statistical uncertainties on the results. Note also that the magnitude of is generally much higher than those of and at the same .
In Figs. 12 and 13, the CMS Pb data on and are also shown. The data are given for the CMS centrality cut Ref. [\refciteChatrchyan:2013nka]. The results in these figures employ the same centrality definition as in the original Pb predictions paper Ref. [\refciteAlbacete:2013ei]. However, this definition is not identical to that of CMS in Ref. [\refciteChatrchyan:2013nka]. Note that roughly corresponds to % centrality while the results are for % and % centrality. Thus, the comparison to data here is inexact.
3 Jets
3.1 Minimum-bias dijets in Pb collisions (K. J. Eskola, I. Helenius and H. Paukkunen)
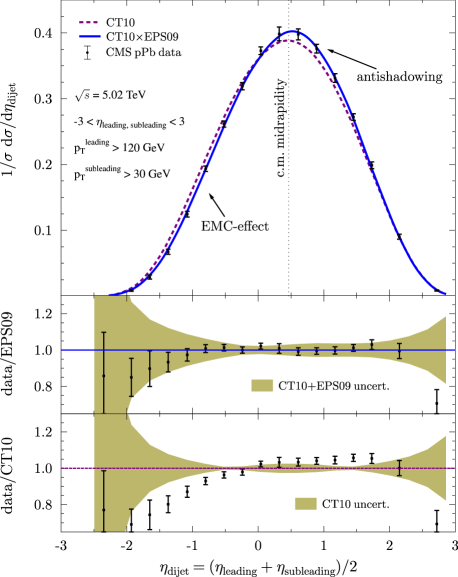
The jet production data from the first Pb run [78, 79, 80] have proven to provide a precise test of the nuclear parton distribution functions (nPDFs). Here, the normalized distribution of dijets measured by the CMS collaboration [78], the first publicly available jet data from the LHC Pb run, are discussed. In this measurement, the jets were binned in dijet pseudorapidity, , defined as the average pseudorapidity of the two hardest (largest ) jets in the event, (in the laboratory frame). The momentum fractions probed on the nucleus side is approximately [\refciteEskola:2013aya], such that the dependence rather straightforwardly tracks the dependence of the nuclear PDFs.
The data are contrasted with NLO predictions [81] in Fig. 15. The plot shows the expectations using both the CT10 free proton PDFs [54] (dashed purple curve) and nPDFs constructed from the CT10 free proton PDFs with the EPS09 NLO nuclear modifications [55] (blue curve). The data clearly favor the EPS09 nuclear PDFs and, in practice, rules out the predictions using only free proton PDFs. In comparison to the predictions with free proton PDFs, the data show an enhancement at , and a depletion at . These are explained by EPS09 in terms of gluon antishadowing and the EMC effect at large . These effects were, in turn, both predicted based on inclusive pion production measured by the PHENIX Collaboration at RHIC [82].
In the calculations shown in Figure 15 the renormalization scale and factorization scale were both fixed as . The normalized spectrum considered here is quite stable against the choice of scale in the central region, . Indeed, the variation is less than the CT10 uncertainty [81]. Thus, the use of nuclear PDFs is essential in order to properly describe the data.
3.2 Single inclusive jet production (Z.-B. Kang, I. Vitev and H. Xing)
The measurements of the centrality and rapidity dependence of single inclusive jet production in Pb collisions show important nuclear modifications of the production cross section. In this section, based on Ref. [\refciteKang:2015mta], these measurements are studied in the framework of standard cold nuclear matter effects with an emphasis on initial-state cold matter energy loss.
The final-state energy loss, , can be generalized to initial-state energy loss. Using the differential distribution of radiated gluons , the probability density for quarks and gluons to lose a fraction of their energy due to multiple gluon emission, can be calculated in the Poisson approximation. The mean energy loss fraction is
| (3) |
Note that the subscripts and in Eq. (3) indicate that quarks and gluons radiate different numbers of gluons and thus lose a different fraction of their energy.
If the incident parton loses a fractional energy , it must have originally carried a larger momentum fraction to satisfy the final-state kinematics. The energy loss can be included by a modification of the parton densities in the calculation of the cross section, see Ref. [\refciteKang:2012kc]. Since accounting for the fluctuations in the cold nuclear matter energy loss by directly calculating can be computationally demanding, the effect is implemented as a shift of momentum fraction in the PDFs,
| (4) |
where with given by Eq. (3) [85, 84]. Thus the nuclear modification of single inclusive jet production in Pb collisions depends not only on the magnitude of initial-state cold nuclear matter energy loss, but also on the slope of the parton distribution functions. In particular, large suppression can be expected for jet production at forward rapidity and large where the proton parton momentum fraction is large and is steeply falling.
Since the energy loss calculation is at leading order, the CTEQ6L1 parton distribution functions [86] are used in both and Pb collisions. The factorization and renormalization scales are equal and fixed to be . The gluon mean-free path is taken to be fm and the interaction strength between the propagating jet and the QCD medium is varied by changing the typical momentum transfers, , over the range GeV, extracted from comparisons to RHIC data.
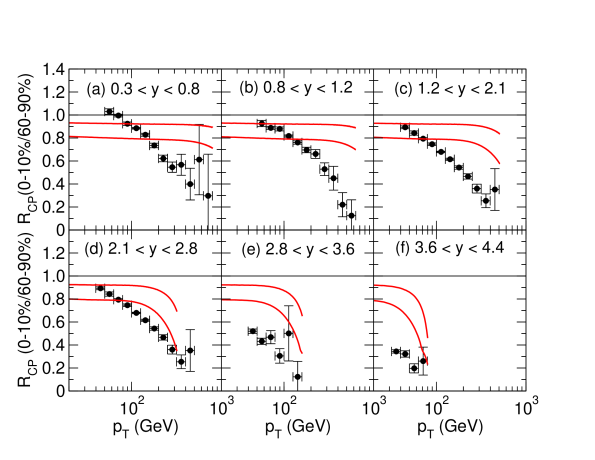
The data were presented in four centrality bins: 0-10%, 20-30%, 40-60% and 60-90% over a range of rapidities from forward to backward. At forward rapidities, decreases with increasing for the most central impact parameters while it increases with for peripheral collisions. The value of at which the ratio deviates from unity increases as the rapidity range moves from forward to backward rapidity. In the mid-central collisions, the ratio is consistent with unity at all . At backward rapidities, the ratio is also equivaent to unity at all . Note also that extends to higher at more backward rapidities.
The values of the central-to-perpherial ratio, , defined as
| (5) |
where is the number of binary nucleon-nucleon interactions, are also calculated as a function of in the same centrality regions, with calculated for the 0-10%, 20-30%, and 40-60% most central collisions relative to the 60-90% centrality bin. The ratio of the most central to most peripheral impact parameters, 0-10%/60-90% shows the strongest suppresssion with while the suppression is the weakest for the semi-central to most peripheral collisions, 40-60%/60-90%. At negative rapidities there is even an enhancement for GeV. The greatest separation between the most central, mid-central and semi-central to peripheral collisions is at the most forward rapidities.
When the results for the most central relative to the most peripheral collisions are plotted as a function of the jet energy, , for rapidities greater than approximately scale with . At more backward rapidities, there is no scaling and the data ratios are clearly separated. In addition, for , is always less than unity while there is an increasing enhancement for the lowest values of at backward rapidity.
In Figs. 16 and 17, the calculations of with cold matter energy loss described here are compared to the ATLAS data [80]. Only the ratio of the most central to most peripheral results (0-10%/60-90%) are shown. The centrality dependence of the calculations comes from the average number of binary collisions in a given centrality bin, taken from the ATLAS determination, as well as the effective path length, , through the medium for the produced jets. The value of , which is required in the calculation of , is calculated in a Glauber model consistent with the value of appropriate for the given centrality bin.
Figure 16 shows the results as a function of . The upper and lower edges of the calculated ratio, corresponding to and 0.7 GeV respectively, are given. The calculations show the same trend as the data albeit with somewhat different curvature. When the calculations are compared to the values of for mid-central and semi-central collisions, the agreement with the data improves. The calculations and data both decrease with increasing and . This picture is consistent with cold matter energy loss where the effect is strongly dependent on the parton momentum fraction in the projectile proton, , assuming that the proton moves toward positive rapidity.
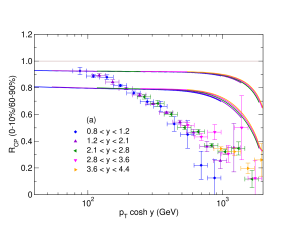
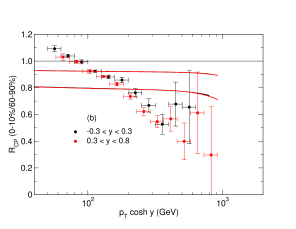
Indeed, if cold matter energy loss is the dominant mechanism for the effect observed by ATLAS, one would expect to see scaling with in the forward rapidity region but not backward of midrapidity. This is in fact the case, as shown in Fig. 17. The calculations and the data both scale with although, again, the curvature is not quite the same.
The calculations of show a similar agreement with the forward rapidity data in central collisions. However, the minimum bias result, dominated by non-central events, is almost independent of and even suggests some small enhancement.
The calculations from Ref. [\refciteKang:2015mta] shown here capture the bulk of the observed modifications for the LHC experiments from central to semi-central collisions. The upper edge of the band calculated for cold matter energy loss is consistent with the minimum bias data if the statistical and systematic uncertainties are taken into account. The encouraging comparison between the calculations and the data indicates the significance of cold nuclear matter energy loss for understanding particle and jet production in collisions, particularly at forward rapidities.
The observed scaling of and as a function of the total jet energy, , in the forward rapidity region in Pb collisions can be explained naturally in the picture of cold nuclear matter energy loss. Further, , Feynman , at forward rapidity. Similar scaling at large has indeed been observed for different final states [87]. On the other hand, an nPDF-only calculation is consistent with the minimum bias data in inclusive jet production but fails to describe central collisions.
The observed enhancement in peripheral collisions is difficult to understand in either an energy loss or strictly nPDF picture. Such an enhancement might have a different origin, for example from “centrality bias”, and needs to be explored further. This enhancement also affects the central-to-peripheral ratio and is thus partly responsible for the small values of . It is important to understand whether there is a centrality selection bias and, if it exists, its dynamical origin, for it to be taken into account correctly in theoretical calculations.
A next step will be to go beyond the soft-gluon energy loss approximation and obtain the full medium-induced splitting kernels [88]. With these cold nuclear matter splitting kernels, the vacuum and in-medium parton showers can be treated on the same footing, following the progress recently made on the implementation of final-state QGP effects [89, 90, 91].
There is no significant contradiction between the cold matter energy loss interpretation of single inclusive jet suppression in this section and the dijet enhancement due to nuclear shadowing in the previous section. The results for ATLAS are generally in a much higher range where the effect of nuclear modifications of the parton densities are reduced by the scale evolution relative to those of the dijets. In addition, the centrality dependence of EPS09s [50] may not have a strong effect on .
3.3 Nuclear modification ratio for production of forward-forward jets in Pb collisions with Sudakov effects included (P. Kotko, K. Kutak and S. Sapeta)
Here the predictions [1, 92] for the emergence of saturation [93] effects on dijet production are updated. The prescription for including the hard scale, , dependence in the small gluon evolution equations using the Sudakov form factor, proposed in Refs. [\refciteKutak:2014wga,vanHameren:2014ala], is applied. (For other approaches, see Ref. [\refciteMueller:2013wwa]). The high energy factorization formalism [97], which accounts for both the high energy scale of the scattering and the hard momentum scale of the produced hard system, is employed.
The study presented in Refs. [\refciteAlbacete:2013ei,vanHameren:2014ala] concentrated on central-forward dijet production. The results obtained for the forward-central jet configuration in collisions [95] are discussed and compared to preliminary CMS data [98] since the corresponding Pb data are not yet available. Predictions for the case in which both jets are produced in the forward region, in the spirit of Ref. [\refcitevanHameren:2014lna], are also shown.
The hybrid high energy factorization formula in the asymmetric configuration is [99]
| (6) | |||||
where
| (7) |
, and is the azimuthal distance between the outgoing partons. The squared matrix element, , includes processes with one off-shell initial state gluon, , and three on-shell partons . The following partonic subprocesses contribute to dijet production: , , and [100]. The off-shell gluon in Eq. (6) is obtained from the unintegrated, hard-scale dependent gluon density [101, 102, 103], a function of the gluon momentum fraction , the transverse momentum of the off-shell gluon , and hard scale , chosen, for example, to be the average transverse momentum of the two leading jets. In the case of the on-shell parton, at high momentum fraction , the collinear density, , is employed.
3.3.1 Forward-central dijets
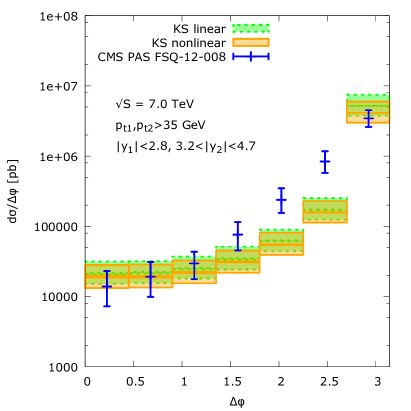
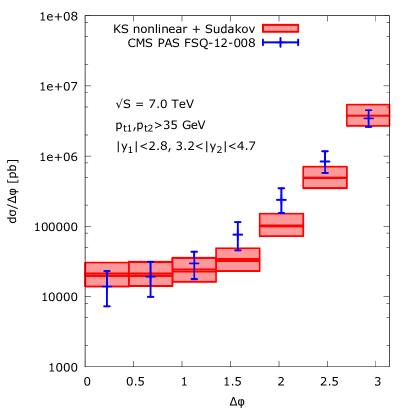
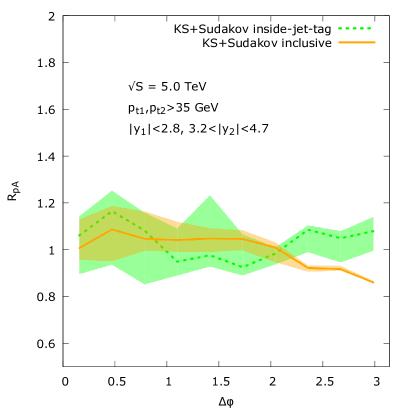
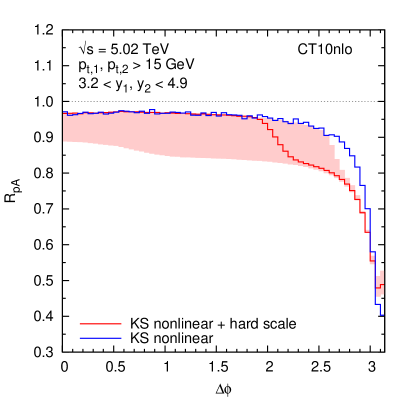
Figure 18 shows the results for the azimuthal angle decorrelation obtained from the hybrid high-energy factorization formulation [95] using the KS linear and nonlinear unintegrated gluon densities [103].
The top left part of Fig. 18 shows that, in the range of available data, there is not much difference between predictions based on linear and nonlinear evolution. Figure 18 (top right) shows that incorporating the hard scale in the unintegrated gluon density by including Sudakov effects, the red histograms, improves the description of the CMS data [98]. The nuclear modification factor, , was calculated in two different scenarios with the CMS cuts: inclusive, with no additional requirement on the two leading jets, and the inside-jet tag, with a third jet with GeV subleading to the dijet intermediate in rapidty. The results suggest that the potential saturation signals are rather weak since is consistent with unity in both scenarios [95].
3.3.2 Forward-forward dijets
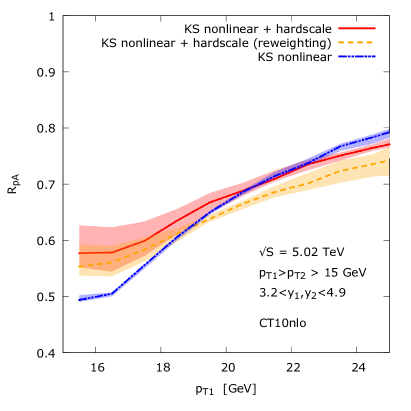
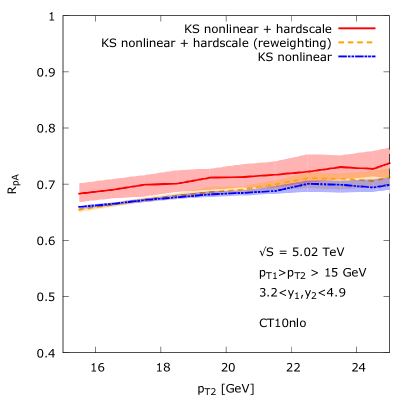
In the forward-forward jet configuration the values of are approximately an order of magnitude smaller than in the forward-central jet configuration. Therefore this configuration is more sensitive to saturation effects.
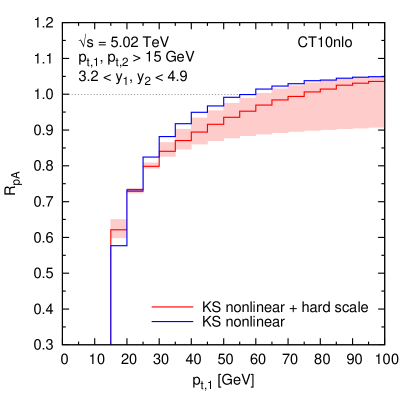
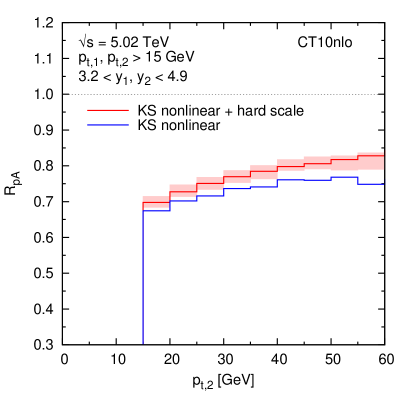
In Fig. 19 (top left) the nuclear modification factor for forward-forward dijet production is shown as a function of the of the hardest jet. Figure 19 (top right) shows the corresponding ratio for the subleading (second hardest) jet. All results were obtained employing the CT10NLO PDFs [54] on the side of the projectile (large ). The blue lines correspond to the KS nonlinear gluon density [103] while the red lines include the Sudakov resummation effects, introducing the hard scale in the KS nonlinear gluon density [94].
The motivation to account for the Sudakov effects comes from studies of coherence effects which suppress soft gluon emission when the scale of the hard process, , is larger than the scale of the local gluon density [94]. The phenomenological significance of these effects has been demonstrated to improve the description of decorrelations in forward-central dijet [95] and jet production [104].
The results shown in Fig. 19 employ a central value of the hard renormalization and factorization scales of . The hard scale dependence has been investigated by varying between and . The pale red band shows the result for the KS nonlinear + hard scale gluon incorporating the Sudakov effects. The analogous variation for the pure KS nonlinear gluon gives a negligible effect and is therefore not shown.
The bottom panel of Fig. 19 gives the predictions for azimuthal decorrelations of the forward-forward dijets albeit with a lower jet cut than in Ref. [\refciteKutak:2014wga]. The azimuthal separation, , probes the unintegrated gluon density at small , where it is strongly suppressed by nonlinear effects. As shown in Fig. 19, this observable is a strong signal of saturation effects and is sensitive to the enhanced saturation going from a proton to a nuclear target.
The introduction of the hard scale leads to a reduction of the unintegrated gluon density in lead relative to that of the proton as long as but, for the hard scale contribution vanishes and transitions to the KS nonlinear result. The value of where this transition takes place depends on the value of . If a lower is chosen for the KS nonlinear + hard scale calculation, the result would approaches that of the KS nonlinear gluon at a higher value of . This can be expected since lower values of reduce the phase space where the Sudakov suppression can have an effect.
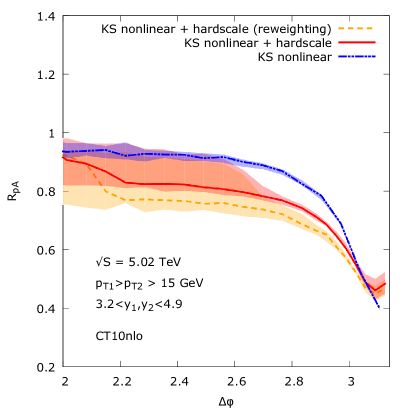
In Fig. 20 the saturation region (low- and near ) is expanded from Fig. 19. These results are compared to model predictions [94] employing the method of reweighting Monte Carlo events with by the Sudakov factor described in Ref. [\refcitevanHameren:2014ala]. Both models give qualitatively similar effects for these observables in the low and large regions.
In addition to the effects included in the calculation, the region , for individual processes, is sensitive to corrections coming from higher order gluon density correlators, as discussed in Ref. [\refciteKotko:2015ura]. Numerical studies of those effects are in progress.
The suppression due to the combination of coherence effects and saturation is particularly strong for the subleading jet and, in the case of azimuthal decorrelations, it extends over a significant range of .
4 Quarkonium
4.1 Ground State Quarkonium (F. Arleo, E. G. Ferreiro, F. Fleuret, H. Fujii, J.-P. Lansberg, A. Rakotozafindrabe, S. Peigné and R. Vogt)
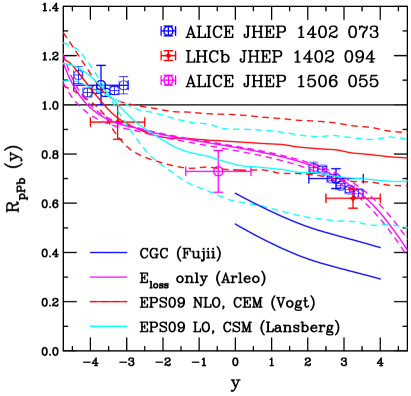
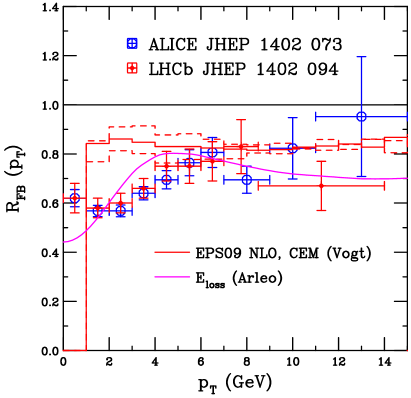
The and suppression factors have been measured by ALICE [106, 107] and LHCb [108, 110] in similar rapidity windows, for ALICE and for LHCb in symmetric ( and ) collisions. Although the muon spectrometers for both experiments are only on one side of the collision point, results were obtained forward and backward of midrapidity by switching the beam direction and running both Pb and Pb collisions. Due to the rapidity shift in asymmetric collisions, the acceptances of the two detectors in the collision center of mass was shifted to at forward rapidity and at backward rapidity for ALICE and at forward rapidity and at backward rapidity for LHCb. The regions of overlap between the forward and backward rapidity regions are for ALICE and for LHCb.
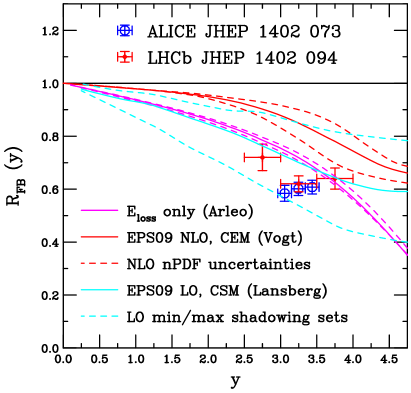
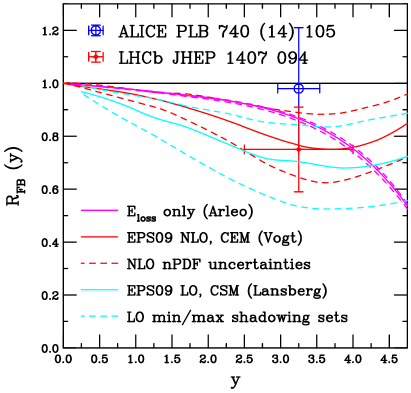
The results were presented first as with an extrapolated normalization since there is no measurement at TeV. The normalization is based on an interpolation between the measurements at and 7 TeV, along with a model-based systematic uncertainty [106]. In addition, to eliminate the dependence on the uncertain normalization, a forward-backward production ratio, , was extracted where is defined with the proton beam moving toward positive in the numerator and negative in the denominator. Thus cold matter effects dominant at small are in the numerator while the denominator probes larger . The contributions to cancel in the ratio because collisions are symmetric around midrapidity.
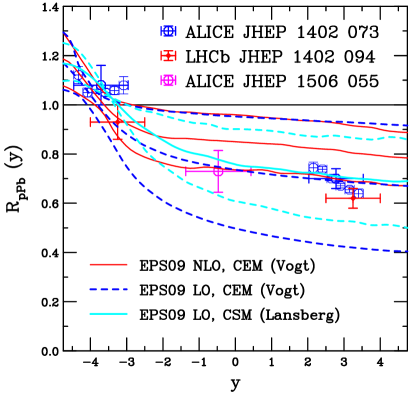
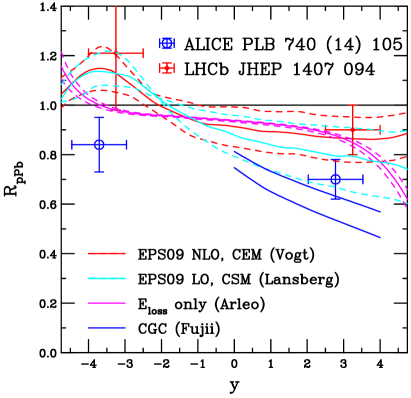
In addition to the calculations in the color evaporation model (CEM) at next-to-leading order presented in Ref. [\refciteAlbacete:2013ei], several other calculations are also shown in Figs. 22-24. They are a LO color singlet model calculation [111]; a coherent energy loss calculation with no nuclear modifications of the parton densities [112, 113]; and a color glass condensate calculation employing a color evaporation model for production [116]. They are briefly discussed here.
The EPS09 NLO CEM band is obtained by calculating the deviations from the central value for the 15 parameter variations on either side of the central set and adding them in quadrature. The calculation was done employing the charm production parameters obtained in Ref. [\refciteNelson:2012bc]. The results shown here and in Ref. [\refciteVogt:2015uba] correct the results in Ref. [\refciteAlbacete:2013ei] which used incorrect scale inputs. The EPS09 NLO band is narrower and exhibits less shadowing than the corresponding EPS09 LO CEM result, see Ref. [\refciteVogt:2015uba] for more details and a full comparison to all the data.
The EPS09 LO curves [111] are obtained with the Monte Carlo Glauber calculation code JIN [121] that calculates cold nuclear matter effects in the exact kinematics of a specific partonic process. In this case, generic matrix elements are used. These matrix elements are systematically compared to data after convolution with proton PDFs to verify that they yield to the correct phase-space weighting444In the case, the LO CSM partonic matrix element is used. However, the physical context is unimportant for evaluation of the matrix element since only the kinematics can affect the result. In particular, the color state of the pair is not taken into account.. The factorization scale employed in the nPDFs when calculating the nuclear modification factor was taken to be the transverse mass of the observed quarkonium in each event. To simplify the comparison, the central EPS09 LO set is used along with four specific extrema (minimal/maximal shadowing and minimal/maximal EMC effect) that reproduce the envelope of the gluon nPDF uncertainty encoded in EPS09 LO.
Note that the EPS09 LO CEM ( partonic process) result in Ref. [\refciteVogt:2015uba] is similar to that of the EPS09 LO result described in Ref. [\refciteFerreiro:2013pua] for the generic matrix element. The differences between the two results shown on the right-hand side of Fig. 22 are due to the production model are smaller than those due to the mass and scale parameters employed in the two calculations.
In the coherent energy loss model [112, 113], the differential production cross section as a function of the quarkonium (labelled ) energy is
| (8) |
where () is the energy (energy loss) of the pair in the rest frame of nucleus . The upper limit on the energy loss is where is the beam energy in that frame. The energy loss probability distribution, or quenching weight, , is related to the medium-induced, coherent radiation spectrum given in Refs. [\refciteArleo:2012rs,Arleo:2010rb]. This result proved to be an excellent approximation of the spectrum computed to all orders in the opacity expansion [114]. It depends on the accumulated transverse momentum transfer due to soft rescatterings in the nucleus where is the medium path length obtained from a Glauber calculation using realistic nuclear densities and is the transport coefficient in cold nuclear matter. The transport coefficient is [113]
| (9) |
at small values of , , and is defined in kinematics. Here is the quarkonium rapidity in the center-of-mass frame of an elementary proton-nucleon collision, is the transverse mass and is the only free parameter of the model. It is determined by fitting the suppression measured by the E866 Collaboration [87] in W relative to Be collisions at GeV, see Ref. [\refciteArleo:2012rs]. The fitted value is GeV2/fm. The production cross section appearing in Eq. (8) is given by the simple parametrization
| (10) |
where the exponent is obtained from a fit to measurements at different center-of-mass energies.
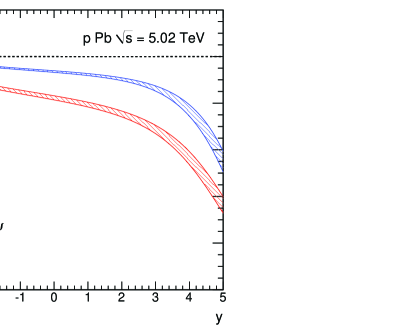
The predictions for and suppression in Pb collisions at TeV are shown in Fig. 21. The model predicts rather strong suppression at forward rapidity, , and a slight enhancement in the most backward rapidity bins, . The suppression predicted for the shares the same features. However, the suppression is less pronounced than that of the since the (average) coherent energy loss scales as [122].
Finally, CGC calculations from Ref. [\refciteFujii:2013gxa] are also shown. The uncertainty comes from varying the saturation scale in the nucleus between 4 and 6 times that of the proton, , as well as varying the quark mass. The saturation scale is the biggest source of uncertainty. Indeed, more recent calculations suggest a smaller value of the saturation scale, , is considered more reasonable for minimum bias events, bringing the CGC result closer to the data [117, 118].
4.2 Charmonium suppression due to comover interactions (E. G. Ferreiro)
Recent results on charmonium production in d+Au and Pb collisions from the PHENIX [123] and ALICE [124, 125] collaborations have shown an unexpectedly strong suppression of excited quarkonium states compared to their ground states. In particular, stronger suppression of the relative to the has been detected.
At lower energies, this difference can been interpreted as the result of breakup in interactions with the primordial nucleons, the so-called nuclear absorption. If the time spent traversing the nucleus by the pair is longer than the charmonium formation time, the larger meson will be further suppressed by a stronger nuclear breakup effect.
However, at higher energies, the charmonium formation time is expected to be larger than the nucleus radius. This results in identical breakup probabilities for the and since these states cannot be distinguished during the time they are traversing the nucleus. Moreover, this nuclear absorption is negligible at the LHC energies because the pair is still small [126].
Other usual explanations, such as that based on shadowing due to the modification of the nuclear gluon distribution, cannot be invoked since the shadowing effects are indistinguishable for the and as long as the same mass scale is used in the calculations [126].
However, the difference in the suppression pattern can be easily explained by the interactions of the quarkonium states with a comoving medium [127]. In the comover framework, the suppression arises from scattering of the nascent with the produced particles, the comovers, that happen to travel along with the pair [128, 129]. Comover dissociation affects the more strongly than the due to the larger size of the . This suppression is stronger where the comover densities are larger: it increases with centrality and, in asymmetric proton-nucleus collisions, it is stronger in the nucleus-going direction.
In the comover interaction model, CIM [129, 130, 131, 132, 133, 134], the rate equation that governs the charmonium density, , at a given transverse coordinate , impact parameter and rapidity , obeys the simple expression
| (11) |
where is the charmonium dissociation cross section due to interactions with the comoving medium of transverse density .
Assuming that the system becomes more dilute as a function of time due to the longitudinal motion leads to a dependence on proper time. The rate equation can be solved analytically. The result depends only on the ratio of final over initial times. Using the inverse proportionality of proper time to density, , it is assumed that the interactions stop when the comover density has become as dilute as the collision density at the same energy. Thus, the solution to Eq. (11) is
| (12) |
where the argument of the logarithmic term is the interaction time of the with the comovers.
The only adjustable parameter of the comover interaction model is the cross section for charmonium dissociation due to interactions with the comoving medium, . It was fixed [130] from fits to low-energy experimental data to be mb for the and mb for the . This value has been also successfully applied at higher energies to reproduce the RHIC [135] and LHC [136] data on suppression in nucleus-nucleus collisions.
As mentioned previously, another important effect that should be taken into account in quarkonium production in nuclei is shadowing of the gluon distribution in the nucleus. This effect is assumed to be identical for the the and the [\refciteFerreiro:2012mm]. The nuclear modification of the parton distribution functions will result in a common effect on the and the yields: a decrease in the mid and forward rapidity regions at LHC energies and an increase in the backward rapidity region.
The nuclear modification factor for comover interactions, together with shadowing effects, is
| (13) |
where is the survival probability due to the comover interactions and takes the shadowing of the nuclear parton distribution functions into account.
Figure 25 shows the nuclear modification factor, as a function of rapidity. The experimental data [124] on and production in Pb collisions at TeV are compared to the CIM results. The EPS09 LO shadowing effects are assumed to be identical [111, 55] for both the and . The effect of the EPS09 shadowing is strongly dependent on the rapidity interval considered. While it induces an increase, antishadowing, in the backward region, it produces a suppression, shadowing, in the forward region. On the other hand, the interaction with comovers introduces a stronger suppression in the backward, lead-going, region due to the higher comover density. The effect will be more important on than on production due to the larger for the .

In Figs. 26 and 27, the results for and production are given as a function of collision centrality. Two rapidity intervals are studied: the -going direction, and the Pb-going direction, . In the backward region, a nuclear modification factor, , compatible with unity is obtained for the due to the combined effect of the EPS09 LO antishadowing together with comover suppression. In the case of production, antishadowing is dominated by the stronger effect of comover suppression. The total suppression in the forward region is almost 50%, primarily due to shadowing. On the other hand, for the , both shadowing and a limited comover effect contribute to an overall suppression at forward rapidity.
In summary, a detailed study of and production in Pb collisions at TeV has been performed. The available data are consistent with the interaction of fully formed physical quarkonia with produced particles, the comovers, that travel along with the pair.


5 Gauge boson production (Z.-B. Kang, J.-W. Qiu, P. Ru, E. Wang, B.-W. Zhang and W.-N. Zhang)
The production of the and gauge bosons in Pb collisions is studied here. The calculations in Sec. 5.1 are done with perturbative QCD up to NLO and are compared to several gauge boson observables. The effects of shadowing and isospin are studied for two different sets of underlying proton PDFs. The calculations of production in Sec. 5.2 include resummation of large logarithims of and concentrate on the low region of the distribution.
5.1 and Production to NNLO (P. Ru, E. Wang, B.-W. Zhang and W.-N. Zhang)
Here the perturbative QCD results are compared to the latest LHC data (or preliminary data) for several observables, including the (pseudo-)rapidity dependence, the transverse momentum spectra, the forward-backward asymmetry of and leptons from decays, and the charge asymmetry.
The numerical simulations utilize the Monte Carlo program DYNNLO [137, 138] which was developed to study the Drell-Yan process in hadronic collisions at next-to-leading order (NLO) and next-to-next-to-leading order (NNLO). Cold nuclear matter (CNM) effects are included by incorporating phenomenological parametrizations of the nPDFs. The CT10 [139] and MSTW2008 [140] proton PDFs are employed with the EPS09 [55] and nCTEQ [141, 142] NLO nPDFs. Calculations with the CT10 and MSTW PDFs are shown with three nuclear modifications: EPS09 NLO and nCTEQ, including isospin, and isospin alone, without shadowing. The cross sections shown here are obtained by scaling the nucleon-nucleon results by the Pb mass number, . More detailed discussions can be found in Ref. [\refciteRu:2014yma].
In the calculations, the renormalization and factorization scales, and , are set to where is the mass of vector boson.
5.1.1 (pseudo-)rapidity dependence
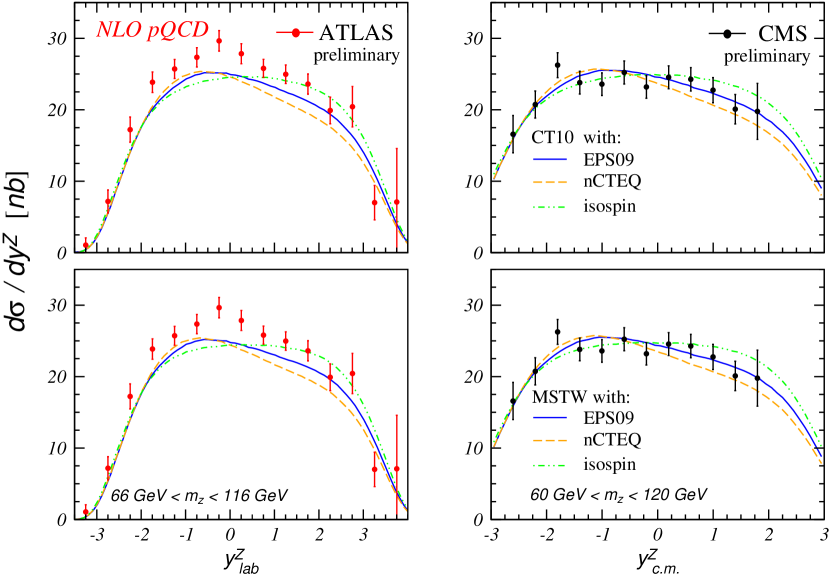
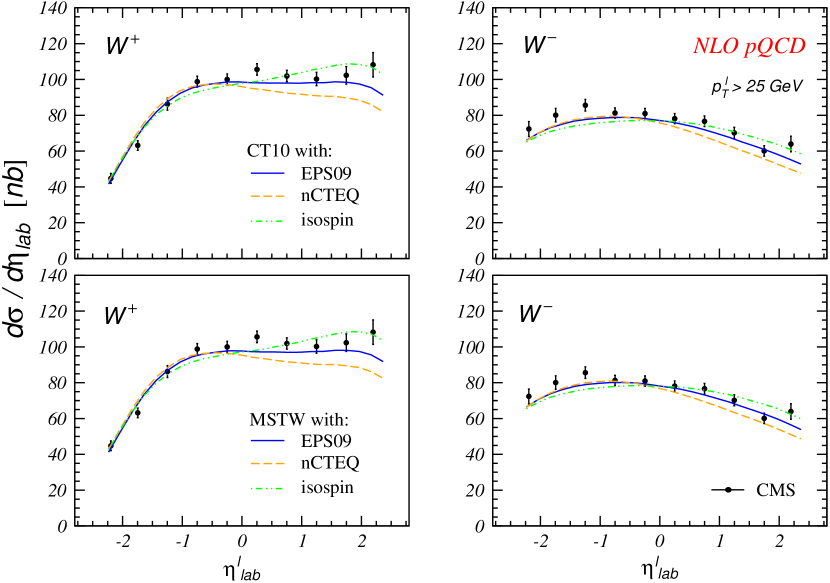
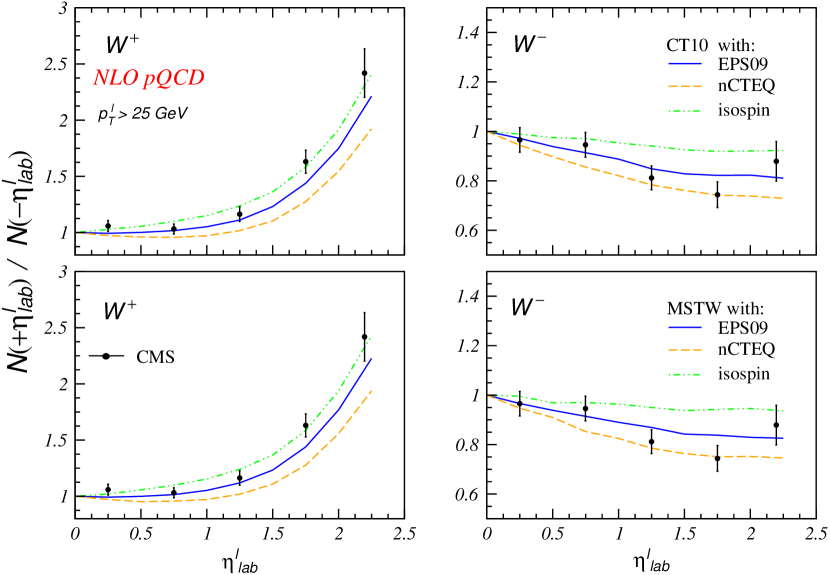
The NLO boson rapidity distributions are compared with the preliminary ATLAS ( combined) [144] and CMS ( only) [145] data. The only cut on the final state is the mass window, GeV for ATLAS and GeV for CMS. The results are shown in Fig. 28. The calculations [143] agree well with the CMS data, but not that well with the ATLAS results in the region , where . The dependence on free proton PDFs is rather small. However, differences among the three types of nuclear modifications can be observed, especially in the forward rapidity region ().
The NLO charged lepton pseudorapidity distributions for boson decays are shown in Fig. 29. The final state cut on the charged lepton transverse momentum is GeV. The calculations are in good agreement with the CMS combined data [146]. There are obvious differences in the nuclear modifications for production, particularly in the forward region. Small differences can also be seen for production.
5.1.2 transverse momentum distribution
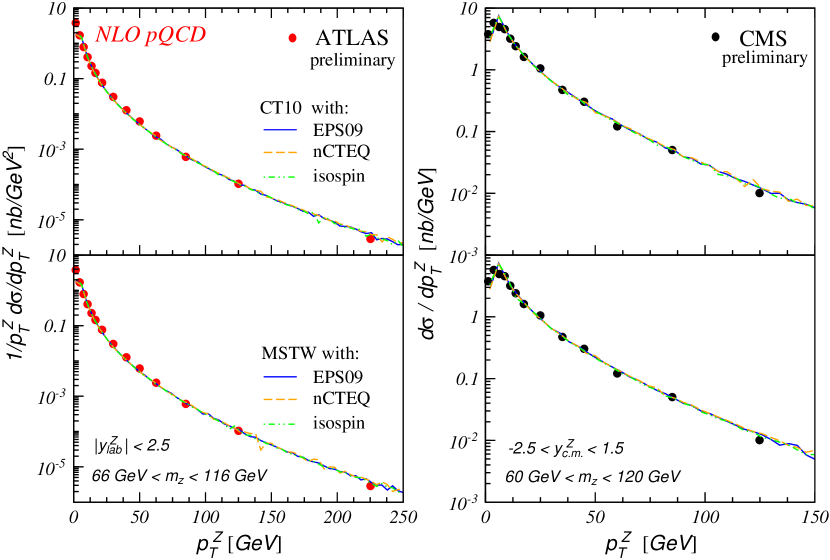
The NLO transverse momentum distributions are compared to the preliminary data from ATLAS ( combined) [144] and CMS ( only) [145]. In addition to the different mass windows, the rapidity regions are also different for ATLAS and CMS: in the laboratory frame for ATLAS and in the center of mass frame for CMS. The calculations agree quite well with the data, as shown in Fig. 30. Note that, on the logarithmic scale of the distributions, no difference between the type of nuclear effects included can be observed.
5.1.3 Forward-Backward Rapidity Asymmetry
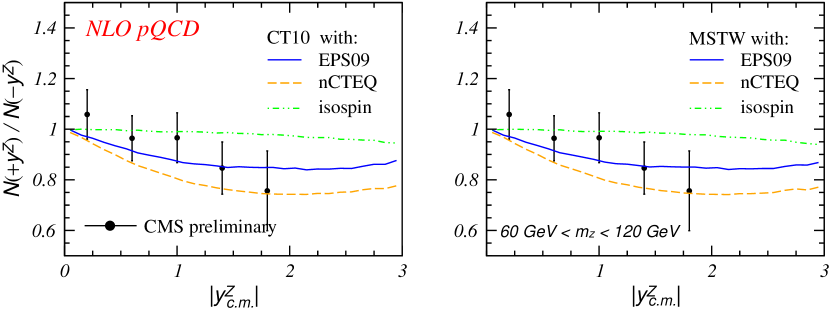
The forward-backward asymmetry for vector boson production can be observed in the asymmetric Pb collision system. The asymmetry arises from the cold nuclear matter effects [143]. First, the forward-backward asymmetry is studied as a function of the absolute value of the rapidity in the center of mass frame in the CMS mass window, GeV [145]. The NLO results are compared with the CMS muon data in Fig. 31. Differences between the three nuclear modifications are emphasized by the asymmetry. Isospin alone gives only a small forward-backward asymmetry while nuclear modifications such as antishadowing give a larger symmetry, 20-25%. The nCTEQ nuclear modification gives the largest asymmetry. The calculations agree with the data within the uncertainties. However, the data favor nuclear modifications with EPS09 NLO and nCTEQ in the region .
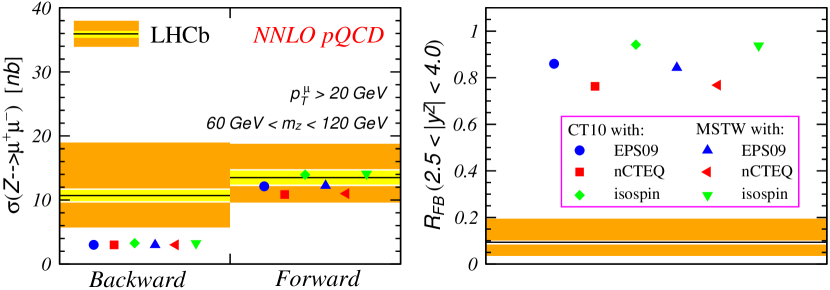
The LHCb collaboration has measured the forward-bacward asymmetry in a different, more forward, rapidity region from CMS [147]. The forward and backward cross sections have been measured in the region GeV, GeV, and in the laboratory frame. In the center of mass frame, the muon pseudorapidity range is in the forward region and in the backward region. The NNLO cross sections are calculated and compared with the LHCb data on the left-hand side of Fig. 32. The calculations in the forward region agree with the data while, in the backward region, the results are much smaller than the data, even though the experimental uncertainty is rather large.
On the right-hand side of Fig. 32, the forward-backward ratios are calculated at NNLO and compared to the LHCb data. The ratio is defined as
| (14) |
The calculations considerably overestimate the data. In addition, the uncertainty with the nuclear PDFs is rather small. Thus the deviation between theory and data is significant. Considering the results of the individual forward and backward cross sections, this overestimate is likely due to a significant (factor of 3-4) underestimate of the backward cross section.
There seems to be an apparent mismatch between the ratio of the forward to backward cross sections as seen on the left-hand side of Fig. 32. A ‘by-eye’ view might lead one to expect . However, in this panel, the forward and backward regions cover the entire rapidity space of 2.5 units. When the rapidity range is restricted to 1.5 units the statistical signal is reduced, leading to the value of on the right-hand side.
Note that the LHCb results are based on a fairly small sample of bosons so that, while the signal is strong, the statistical signifcance is not. There are four candidates in the backward rapidity region and eleven at forward rapidity over the full phase space. When the range is restricted to the overlap of the forward and backward regions, only two candidates are left in the forward region while the four candidates in the backward region are not reduced. After corections for acceptance in the different regions are taken into account the measured is reduced to .
To leading order, the momentum fraction carried by initial parton in the nucleus for boson production at rapidity is . Thus in the forward rapidity region and in the backward direction for LHCb. Also note that forward production proceeds via nuclear sea quarks, and (with only small higher order contributions from gluons), while backward production is dominated by nuclear valence quarks, and [148]. Therefore the forward-backward ratio can schematically be written as
| (15) | |||||
where is the flavor-dependent nuclear modification factor. The nuclear effect in the forward region is thus predominantly related to sea quark shadowing while that in the backward direction is mainly due to EMC effects on the valence quarks [143, 148].
Because the forward and backward yields in the rapidity region covered by LHCb are rather small [147], the experimental precision should be improved for more robust comparisons of the calculations to data. Unfortunately the rapidity regions of CMS and LHCb do not overlap. However, it is clear that the forward-backward ratio in the rapidity range measured by LHCb is significantly lower than one would expect from extrapolating the CMS data to higher rapidity.
The forward-backward asymmetry for boson production has also been measured by CMS [146]. The forward-backward asymmetry is calculated to NLO as a function of the charged lepton pseudorapidity and compared to the CMS data. Figure 33 shows that the calculations can describe the CMS data rather well. The data seem to favor the isospin alone, without any addition nuclear PDF modifications in the region . However, the data are in better agreement with the EPS09 and nCTEQ modifications. Note also that the asymmetry is large and greater than unity for the while the asymmetry is small and less than unity, similar to that of the . Indeed, the asymmetry for , on the right-hand side of Fig. 33, is quite similar to those for production shown in Fig. 31.
5.1.4 charge asymmetry
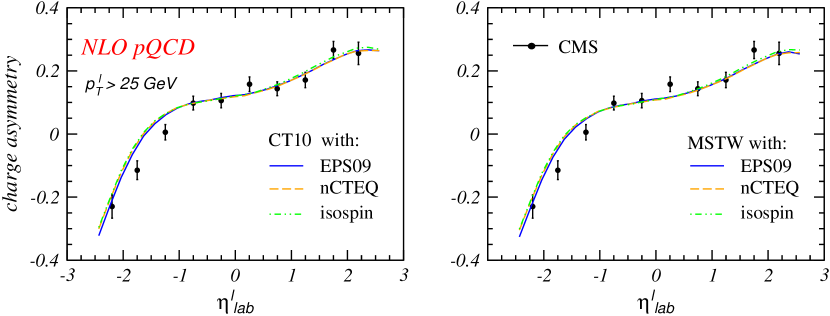
The charge asymmetry for boson production, defined as
| (16) |
has been measured by CMS [146]. The data are compared to NLO calculations in Fig. 34. The calculations agree with the data except for the region . The charge asymmetry is not sensitive to the nPDFs with no obvious flavor dependence, e.g. between the and valence quarks [143]. This is not surprising because, at a given value of , the and probe the same values and thus nearly the same values of the nPDFs.
5.1.5 Summary
The NLO and NNLO perturbative QCD calculations of vector boson production have been compared to the LHC data. The calculations shown generally good agreement with the data except for the low statistics forward-backward asymmetry measured by LHCb. The results are not sensitive to the choice of free proton PDFs. However, there is a clear distinction between calculations with different parametrizations of the nPDFs for observables such as the pseudorapidity distribution and the forward-backward asymmetry.
The significant deviation of the calculations from the LHCb data could arise from a poor understnading of the modifications of the valence quark distributions at large , . Alternatively it could be resolved by a higher-statistics measurement. The first measurements of vector boson production in Pb collisions at the LHC have demonstrated the capability of studying cold nuclear matter effects at and high momentum transfers, . Further robust theoretical investigations and more precise data are needed to place stringent constraints on the nPDFs and thus gain a deeper understanding of cold nuclear matter effects in this relatively unexplored region.
5.2 production at low (Z.-B. Kang and J.-W. Qiu)
At low transverse momentum, , the conventional fixed-order calculation for the boson differential cross section, , includes a large logarithm . The convergence of a conventional perturbative expansion is thus impaired and these large logarithms must be resummed. The Collins-Soper-Sterman (CSS) formalism is well-known and was developed for precisely such purposes [149, 150, 151, 152].
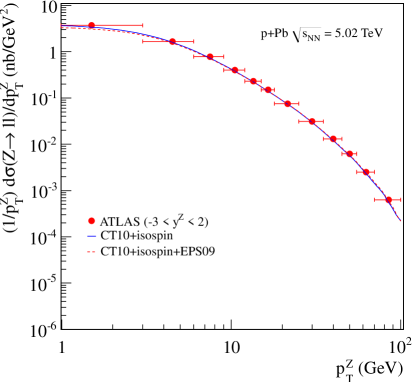
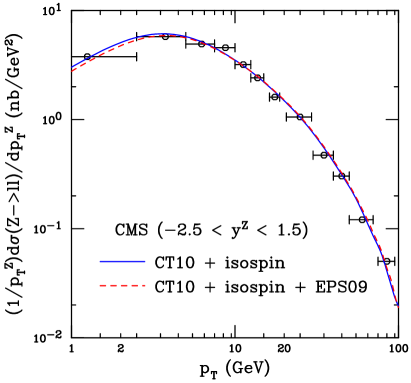
The calculations are based on the CSS formalism. The CT10 parameterization is employed for the proton PDFs, with EPS09 NLO for the nuclear PDFs. The factorization scale is . The nuclear size () enhanced multiple scattering effects are taken into account in Pb collisions, as discussed in detail in Ref. [\refciteKang:2012am]. As can be seen in Fig. 35, emphasizing the low region, this formalism describes the data rather well. It predicts that boson production in Pb collisions is suppressed at low due to shadowing, while being slightly enhanced at relatively large due to antishadowing in EPS09. However, these modifications are within the current experimental uncertainties, and thus no definite conclusions can be made at this point.
6 Conclusions
The predictions from Ref. [\refciteAlbacete:2013ei have been compared to a wide range of data from the 2013 Pb run. While some results are in good agreement with the data, other surprised have been found. The solution of some await results either from a higher statistics run, as for the LHCb forward-backward asymmetry, or from a run at a similar center-of-mass energy, as in the case of at high . Indeed, LHC Run II has already made a run at 5 TeV to replace the extrapolated baselines used in the results shown here. A follow up two week Pb run at 5 TeV will come at the end of 2016 to augment the data shown here. An additional Pb run at 7 TeV is also planned that can be compared to the extensive results at this energy from Run I. With the higher LHC luminosity in Run II, good statistics can be expected, even for a shorter run.
Acknowledgements
The JET Collaboration is thanked for support for the initiation of Ref. [\refciteAlbacete:2013ei] and the suggestion of a follow up with this work.
The work of F. Arleo and S. Peigné is funded by “Agence Nationale de la Recherche” under grant ANR-PARTONPROP.
The work of F. Fleuret was supported in part by the French CNRS via the GDR QCD.
The work of I. Helenius has been supported by the MCnetITN FP7 Marie Curie Initial Training Network, contract PITN-GA-2012-315877.
The work of J.-P. Lansberg was supported in part by the French CNRS via the grants FCPPL-Quarkonium4AFTER & Défi Imphyniti-Théorie LHC France and the GDR QCD.
The work of Z. Kang, I. Vitev and H. Xing is supported by the U.S. Department of Energy under Contract No. DE-AC52-06NA25396.
The work of K. Kutak has been supported by Narodowe Centrum Nauki with Sonata Bis grant DEC-2013/10/E/ST2/00656. P. Kotko acknowledges the support of DOE grants DE-SC-0002145 and DE-FG02-93ER40771.
The work of J. Qiu is supported by the U. S. Department of Energy under Contract No. DE-AC02-98CH10886.
The work of H. Paukkunen was supported by the European Research Council grant HotLHC ERC-2011-StG-279579.
The work of A. Rezaeian is supported in part by Fondecyt grant 1110781.
The work of P. Ru, B.-W. Zhang, E. Wang and W.-N. Zhang is supported in part by the Natural Science Foundation of China with Project Nos. 11322546, 11435004, 11221504.
The work of R. Vogt was performed under the auspices of the U. S. Department of Energy by Lawrence Livermore National Laboratory under Contract DE-AC52-07NA27344 and supported by the U. S. Department of Energy, Office of Science, Office of Nuclear Physics (Nuclear Theory) under contract number DE-SC-0004014.
The work of X.-N. Wang was performed under the auspices of the U. S. Department of Energy under Contract No. DE-AC02-05CH11231, by the National Natural Science Foundation of China under grant No. 11221504.
References
- [1] J. L. Albacete et al., Int. J. Mod. Phys. E 22 (2013) 1330007.
- [2] B. Abelev et al. [ALICE Collaboration], Phys. Rev. Lett. 110 (2013) 032301.
- [3] H. -U. Bengtsson and T. Sjostrand, Comput. Phys. Commun. 46 (1987) 43.
- [4] X. -N. Wang and M. Gyulassy, Phys. Rev. D 44 (1991) 3501.
- [5] M. Gyulassy and X. -N. Wang, Comput. Phys. Commun. 83 (1994) 307 [arXiv:nucl-th/9502021].
- [6] W. -T. Deng, X. -N. Wang and R. Xu, Phys. Rev. C 83 (2011) 014915.
- [7] W. -T. Deng, X. -N. Wang and R. Xu, Phys. Lett. B 701 (2011) 133.
- [8] R. Xu, W. -T. Deng and X. -N. Wang, arXiv:1204.1998 [nucl-th].
- [9] V. Topor Pop, M. Gyulassy, J. Barrette, and C. Gale, Phys. Rev. C 84 (2011) 022002.
- [10] V. Topor Pop, M. Gyulassy, J. Barrette, C. Gale, and A. Warburton, Phys. Rev. C 83 (2011) 024902.
- [11] G. G. Barnafoldi, J. Barrette, M. Gyulassy, P. Levai and V. Topor Pop, Phys. Rev. C 85 (2012) 024903.
- [12] V. Topor Pop, M. Gyulassy, J. Barrette, C. Gale and A. Warburton, arXiv:1203.6679 v2 [hep-ph].
- [13] Z. -W. Lin, C. M. Ko, B. -A. Li, B. Zhang and S. Pal, Phys. Rev. C 72 (2005) 064901.
- [14] Z. -B. Kang, I. Vitev and H. Xing, Phys. Rev. D 85 (2012) 054024.
- [15] Y. Zhang, G. I. Fai, G. Papp, G. G. Barnafoldi and P. Levai, Phys. Rev. C 65 (2002) 034903.
- [16] G. Papp, G. G. Barnafoldi, P. Levai, and G. Fai, arXiv:hep-ph/0212249.
- [17] J. Jalilian-Marian, A. Kovner, A. Leonidov and H. Weigert, Nucl. Phys. B 504 (1997) 415.
- [18] J. Jalilian-Marian, A. Kovner, A. Leonidov and H. Weigert, Phys. Rev. D 59 (1999) 014014.
- [19] E. Iancu, A. Leonidov and L. D. McLerran, Nucl. Phys. A 692 (2001) 583.
- [20] E. Ferreiro, E. Iancu, A. Leonidov and L. D. McLerran, Nucl. Phys. A 703 (2002) 489.
- [21] I. Balitsky, Nucl. Phys. B 463 (1996) 99.
- [22] Y. V. Kovchegov, Phys. Rev. D 60 (1999) 034008.
- [23] Y. V. Kovchegov, Phys. Rev. D 61 (2000) 074018.
- [24] I. Balitsky, Phys. Rev. D 75 (2007) 014001.
- [25] J. L. Albacete and Y. V. Kovchegov, Phys. Rev. D 75 (2007) 125021.
- [26] J. L. Albacete, A. Dumitru, H. Fujii and Y. Nara, Nucl. Phys. A 897 (2013) 1.
- [27] A. H. Rezaeian, Phys. Lett. B 718 (2013) 1058.
- [28] A. H. Rezaeian, Phys. Rev. D 85 (2012) 014028.
- [29] L. D. McLerran and R. Venugopalan, Phys. Rev. D 49 (1994) 2233.
- [30] L. D. McLerran and R. Venugopalan, Phys. Rev. D 49 (1994) 3352.
- [31] L. D. McLerran and R. Venugopalan, Phys. Rev. D 50 (1994) 2225.
- [32] H. Kowalski and D. Teaney, Phys. Rev. D 68 (2003) 114005.
- [33] P. Tribedy and R. Venugopalan, Nucl. Phys. A 850 (2011) 136; [Erratum-ibid. A 859 (2011) 185].
- [34] P. Tribedy and R. Venugopalan, Phys. Lett. B 710 (2012) 125; [Erratum-ibid. B 718 (2013) 1154].
- [35] A. H. Rezaeian and I. Schmidt, Phys. Rev. D 88 (2013) 074016.
- [36] N. Armesto and A. H. Rezaeian, Phys. Rev. D 90 (2014) 054003
- [37] E. Levin and A. H. Rezaeian, Phys. Rev. D 82 (2010) 014022.
- [38] E. Levin and A. H. Rezaeian, AIP Conf. Proc. 1350 (2011) 243.
- [39] E. Levin and A. H. Rezaeian, Phys. Rev. D 82 (2010) 054003.
- [40] E. Levin and A. H. Rezaeian, Phys. Rev. D 83 (2011) 114001.
- [41] G. Aad et al. [ATLAS Collaboration], arXiv:1508.00848 [hep-ex].
- [42] B. B. Back et al. [PHOBOS Collaboration], Phys. Rev. Lett. 93 (2004) 082301.
- [43] I. Arsene et al. [BRAHMS Collaboration], Phys. Rev. Lett. 94 (2005) 032301.
- [44] J. Adam et al. [ALICE Collaboration], Phys. Rev. C 91 064905 (2015).
- [45] B. Abelev et al. [ALICE Collaboration], Phys. Rev. Lett. 110 (2013) 082302.
- [46] CMS Collaboration [CMS Collaboration], CMS-PAS-HIN-12-017.
- [47] A. H. Rezaeian, Phys. Lett. B 727 (2013) 218.
- [48] B. B. Abelev et al. [ALICE Collaboration], Phys. Lett. B 727 (2013) 371.
- [49] J. Jalilian-Marian and A. H. Rezaeian, Phys. Rev. D 85 (2012) 014017.
- [50] I. Helenius, K. J. Eskola, H. Honkanen and C. A. Salgado, JHEP 1207 (2012) 073.
- [51] B. B. Abelev et al. [ALICE Collaboration], Eur. Phys. J. C 74 (2014) 3054.
- [52] M. L. Knichel [ALICE Collaboration], Nucl. Phys. A 931 (2014) 309.
- [53] V. Khachatryan et al. [CMS Collaboration], Eur. Phys. J. C 75 (2015) 237.
- [54] H. L. Lai, M. Guzzi, J. Huston, Z. Li, P. M. Nadolsky, J. Pumplin and C.-P. Yuan, Phys. Rev. D 82 (2010) 074024.
- [55] K. J. Eskola, H. Paukkunen and C. A. Salgado, JHEP 0904 (2009) 065.
- [56] S. Kretzer, Phys. Rev. D 62 (2000) 054001.
- [57] B. A. Kniehl, G. Kramer and B. Potter, Nucl. Phys. B 582 (2000) 514.
- [58] D. de Florian, R. Sassot and M. Stratmann, Phys. Rev. D 76 (2007) 074033.
- [59] P. Balek et al [ATLAS Collaboration], Nucl. Phys. A 931 (2014) 399.
- [60] N. Armesto, D. C. Gülhan and J. G. Milhano, Phys. Lett. B 747 (2015) 441.
- [61] D. d’Enterria, K. J. Eskola, I. Helenius and H. Paukkunen, Nucl. Phys. B 883 (2014) 615.
- [62] A. Adeluyi, G. G. Barnafoldi, G. Fai and P. Levai, Phys. Rev. C 80 (2009) 014903.
- [63] H. Paukkunen, PoS DIS 2014 (2014) 053.
- [64] P. Levai, Nucl. Phys. A 862-863 (2011) 146.
- [65] G. G. Barnafoldi, G. Fai, P. Levai, B. A. Cole and G. Papp, Indian J. Phys. 84 (2010) 1721.
- [66] M. Hirai, S. Kumano and M. Miyama, Phys. Rev. D 64 (2001) 034003.
- [67] K. J. Eskola, V. J. Kolhinen and C. A. Salgado, Eur. Phys. J. C 9, 61 (1999).
- [68] K. J. Eskola, H. Paukkunen, and C. A. Salgado, JHEP 0807 (2008) 102.
- [69] B. B. Abelev et al. [ALICE Collaboration], Eur. Phys. J. C 73 (2013) 2662.
- [70] S. Chatrchyan et al. [CMS Collaboration], JHEP 1108 (2011) 086.
- [71] S. Chatrchyan et al. [CMS Collaboration], Eur. Phys. J. C 72 (2012) 1945.
- [72] A. Bzdak and G. L. Ma, Phys. Rev. Lett. 113 (2014) 252301.
- [73] This version and more recent versions of the codes are available at http://myweb.ecu.edu/linz/ampt.
- [74] J. Xu and C. M. Ko, Phys. Rev. C 83 (2011) 034904.
- [75] W. Li [CMS Collaboration], Annals Phys. 352 (2015) 35.
- [76] S. Chatrchyan et al. [CMS Collaboration], Phys. Lett. B 724 (2013) 213.
- [77] S. Chatrchyan et al. [CMS Collaboration], JHEP 1402 (2014) 088.
- [78] S. Chatrchyan et al. [CMS Collaboration], Eur. Phys. J. C 74 (2014) 2951.
- [79] E. Appelt et al. [CMS Collaboration], Nucl. Phys. A 931 (2014) 377.
- [80] G. Aad et al. [ATLAS Collaboration], Phys. Lett. B 748 (2015) 392.
- [81] K. J. Eskola, H. Paukkunen and C. A. Salgado, JHEP 1310 (2013) 213.
- [82] S. S. Adler et al. [PHENIX Collaboration], Phys. Rev. Lett. 98 (2007) 172302.
- [83] Z. B. Kang, I. Vitev and H. Xing, Phys. Rev. C 92 (2015) 054911.
- [84] Z.-B. Kang, I. Vitev and H. Xing, Phys. Lett. B 718 (2012) 482.
- [85] R. Sharma, I. Vitev and B.-W. Zhang, Phys. Rev. C 80 (2009) 054902.
- [86] J. Pumplin et al., JHEP 0207 (2002) 012.
- [87] M. J. Leitch et al. [NuSea Collaboration], Phys. Rev. Lett. 84 (2000) 3256.
- [88] G. Ovanesyan and I. Vitev, Phys. Lett. B 706 (2012) 371.
- [89] Z.-B. Kang, R. Lashof-Regas, G. Ovanesyan, P. Saad and I. Vitev, Phys. Rev. Lett. 114 (2015) 092002.
- [90] Y.-T. Chien, A. Emerman, Z.-B. Kang, G. Ovanesyan and I. Vitev, arXiv:1509.02936 [hep-ph].
- [91] Y.-T. Chien and I. Vitev, arXiv:1509.07257 [hep-ph].
- [92] A. van Hameren, P. Kotko, K. Kutak, C. Marquet and S. Sapeta, Phys. Rev. D 89 (2014) 094014.
- [93] L. V. Gribov, E. M. Levin and M. G. Ryskin, Phys. Rept. 100 (1983) 1.
- [94] K. Kutak, Phys. Rev. D 91 (2015) 034021.
- [95] A. van Hameren, P. Kotko, K. Kutak and S. Sapeta, Phys. Lett. B 737 (2014) 335.
- [96] A. H. Mueller, B. W. Xiao and F. Yuan, Phys. Rev. D 88 (2013) 114010.
- [97] S. Catani, M. Ciafaloni, F. Hautmann, Nucl. Phys. B366 (1991) 135.
- [98] CMS Collaboration [CMS Collaboration], CMS-PAS-FSQ-12-008.
- [99] M. Deak, F. Hautmann, H. Jung and K. Kutak, arXiv:1012.6037 [hep-ph].
- [100] M. Deak, F. Hautmann, H. Jung and K. Kutak, JHEP 0909 (2009) 121.
- [101] K. Kutak and J. Kwiecinski, Eur. Phys. J. C 29 (2003) 521.
- [102] K. Kutak and A. M. Stasto, Eur. Phys. J. C 41 (2005) 343.
- [103] K. Kutak and S. Sapeta, Phys. Rev. D 86 (2012) 094043.
- [104] A. van Hameren, P. Kotko and K. Kutak, Phys. Rev. D 92 (2015) 054007.
- [105] P. Kotko, K. Kutak, C. Marquet, E. Petreska, S. Sapeta and A. van Hameren, JHEP 1509 (2015) 106.
- [106] B. B. Abelev et al. [ALICE Collaboration], JHEP 1402 (2014) 073.
- [107] B. B. Abelev et al. [ALICE Collaboration], Phys. Lett. B 740 (2015) 105.
- [108] R. Aaij et al. [LHCb Collaboration], JHEP 1402 (2014) 072.
- [109]
- [110] R. Aaij et al. [LHCb Collaboration], JHEP 1407 (2014) 094
- [111] E. G. Ferreiro, F. Fleuret, J. P. Lansberg and A. Rakotozafindrabe, Phys. Rev. C 88 (2013) 047901.
- [112] F. Arleo and S. Peigné, Phys. Rev. Lett. 109 (2012) 122301.
- [113] F. Arleo and S. Peigné, JHEP 1303 (2013) 122.
- [114] S. Peigné, F. Arleo, and R. Kolevatov, Phys. Rev. D 98 (2016) 014006.
- [115] F. Arleo, R. Kolevatov, S. Peigné and M. Rustamova, JHEP 1305 (2013) 155.
- [116] H. Fujii and K. Watanabe, Nucl. Phys. A 915 (2013) 1.
- [117] B. Ducloué, T. Lappi and H. Mäntysaari, Phys. Rev. D 91 (2015) 114005.
- [118] H. Fujii and K. Watanabe, Nucl. Phys. A 951 (2016) 45.
- [119] R. E. Nelson, R. Vogt and A. D. Frawley, Phys. Rev. C 87 (2013) 014908.
- [120] R. Vogt, Phys. Rev. C 92 (2015) 034909.
- [121] E. G. Ferreiro, F. Fleuret and A. Rakotozafindrabe, Eur. Phys. J. C 61 (2009) 859.
- [122] F. Arleo, S. Peigné, and T. Sami, Phys. Rev. D 83 (2011) 114036,
- [123] A. Adare et al. [PHENIX Collaboration], Phys. Rev. Lett. 111 (2013) 202301.
- [124] B. B. Abelev et al. [ALICE Collaboration], JHEP 1412 (2014) 073.
- [125] R. Arnaldi [ALICE Collaboration], Nucl. Phys. A (2014).
- [126] E. G. Ferreiro, F. Fleuret, J. P. Lansberg and A. Rakotozafindrabe, J. Phys. Conf. Ser. 422 (2013) 012018.
- [127] E. G. Ferreiro, Phys. Lett. B 749 (2015) 98.
- [128] S. Gavin and R. Vogt, Phys. Rev. Lett. 78 (1997) 1006.
- [129] A. Capella, A. Kaidalov, A. Kouider Akil, and C. Gerschel, Phys. Lett. B 393 (1997) 431.
- [130] N. Armesto and A. Capella, Phys. Lett. B 430 (1998) 23.
- [131] N. Armesto, A. Capella and E. G. Ferreiro, Phys. Rev. C 59 (1999) 395.
- [132] A. Capella, E. G. Ferreiro and A. B. Kaidalov, Phys. Rev. Lett. 85 (2000) 2080.
- [133] A. Capella and E. G. Ferreiro, Eur. Phys. J. C 42 (2005) 419.
- [134] A. Capella and E. G. Ferreiro, Phys. Rev. C 76 (2007) 064906.
- [135] A. Capella, L. Bravina, E. G. Ferreiro, A. B. Kaidalov, K. Tywoniuk and E. Zabrodin, Eur. Phys. J. C 58 (2008) 437.
- [136] E. G. Ferreiro, Phys. Lett. B 731 (2014) 57.
- [137] S. Catani, L. Cieri, G. Ferrera, D. de Florian and M. Grazzini, Phys. Rev. Lett. 103 (2009) 082001.
- [138] S. Catani and M. Grazzini, Phys. Rev. Lett. 98 (2007) 222002.
- [139] J. Gao et al., Phys. Rev. D 89 (2014) 033009.
- [140] A. D. Martin, W. J. Stirling, R. S. Thorne and G. Watt, Eur. Phys. J. C 63 (2009) 189.
- [141] I. Schienbein, J. Y. Yu, K. Kovarik, C. Keppel, J. G. Morfin, F. Olness and J. F. Owens, Phys. Rev. D 80 (2009) 094004.
- [142] K. Kovarik et al., Phys. Rev. Lett. 106 (2011) 122301.
- [143] P. Ru, B. W. Zhang, L. Cheng, E. Wang and W. N. Zhang, J. Phys. G 42 (2015) 085104.
- [144] Z. Citron et al. [ATLAS Collaboration], Nucl. Phys. A 931 (2014) 617.
- [145] A. J. Zsigmond et al. [CMS Collaboration], Nucl. Phys. A 931 (2014) 718. CMS-PAS-HIN-14-003.
- [146] V. Khachatryan et al. [CMS Collaboration], arXiv:1503.05825 [nucl-ex].
- [147] R. Aaij et al. [LHCb Collaboration], JHEP 1409 (2014) 030.
- [148] P. Ru, B. W. Zhang, E. Wang and W. N. Zhang, Eur. Phys. J. C 75 (2015) 426.
- [149] J. C. Collins, D. E. Soper and G. F. Sterman, Nucl. Phys. B 250 (1985) 199.
- [150] R. K. Ellis and S. Veseli, Nucl. Phys. B 511 (1998) 649.
- [151] J. w. Qiu and X. f. Zhang, Phys. Rev. D 63 (2001) 114011.
- [152] F. Landry, R. Brock, P. M. Nadolsky and C. P. Yuan, Phys. Rev. D 67 (2003) 073016.
- [153] Z. B. Kang and J. W. Qiu, Phys. Lett. B 721 (2013) 277.